ISSN(Online): 2320-9801
ISSN (Print): 2320-9798
I
nternational
J
ournal of
I
nnovative
R
esearch in
C
omputer
and
C
ommunication
E
ngineering
(An ISO 3297: 2007 Certified Organization)
Vol. 3, Issue 6, June 2015
Design and Implementation of Wireless
Educational Meteorological Station (WEMS)
Sara M. Taha1, Abuagla Babiker2, Salaheldin Edam 3
Associate Lecturer, Dept. of Electronics and Instrumentation, CAIS, University of Bahri, Khartoum, Sudan1
Assistant Professor, School of Electronics, College of Engineering, Sudan University of Science and Technology,
Khartoum, Sudan2,3
ABSTRACT:This paper describes a design and implementation of wireless educational meteorological station (WEMS). The essential feature of this design is to be used as an easy, low cost, and movable data-acquisition system for the meteorological students. The (WEMS) station was constructed from transmitter/receiver units. These units composed from ATMEGA32 microcontroller, meteorological sensors, GSM modules, programming software, conditioning circuit and LABVIEW software as graphical user interface. The microcontroller used to scan different weather sensors to collect a meteorological data from different positions at height of two meters from sea level at open area. The collected data sent via GSM modules to the receiver unit. The recorded results of WEMS tested data was calibrated with Sudan Meteorological Authority (SMA). WEMS record results achieved acceptable accuracy when compared with the SMA station sensor's results.
KEYWORDS:Educational Meteorological station; Weather sensors; Microcontroller; LABVIEW.
I. INTRODUCTION
The science of meteorology described the meteorological phenomena as observable weather events. Those events are usually temperature, humidity, pressure and wind measurements[1].In recent years the methods and techniques that used to measuring and observing the weather phenomena are increasingly more complex[2, 3]. These complex techniques used satellites to monitor the weather around the world [2].
The education of the meteorological science at the university level has grown extremely in contemporary years. In addition to classroom teaching, the meteorology scientists at universities supervise researches for students that are performing to earn their knowledge and degrees [4].
A wireless-Educational Meteorological Station (WEMS) is a project under implementation; its goal is to make an easy acquisition system for the meteorological students. The motivations of making an easy Meteorological data-acquisition system can conclude in the following two points; first, it is a responsibility of applied meteorologist and atmospheric scientist to confrontation the challenges of the changing atmosphere, investigating the natural forces that shape the weather and climate, and make knowledge to warning when danger is approaching in the form of tornadoes and hurricanes[4]. Secondly, the meteorologists provide a variety of services to industries and other organizations; help planners and contractors locate and design airports, factories and many other kinds of construction projects[4].
II. RELATED WORK
The researches at meteorological stations were begun in very early date. Many universities have a very old meteorological station. This station acts as an important part of the university .For example, the Radcliffe Meteorological Station at School of Geography and Environment- University of Oxford, which processed the longest series of temperature and rain fall records [5, 6].These records were continuous from January 1815. Irregular observations of rainfall, cloud and temperature exist from 1767. At the Radcliffe observatory, three observations were made each day until the end of 1924. Since 1925, eye-observations have been reduced to one per day, at 09.00 GMT (the automatic weather station provides continuous observations)[5-7].
ISSN(Online): 2320-9801
ISSN (Print): 2320-9798
I
nternational
J
ournal of
I
nnovative
R
esearch in
C
omputer
and
C
ommunication
E
ngineering
(An ISO 3297: 2007 Certified Organization)
Vol. 3, Issue 6, June 2015
relative humidity, vapour pressure deficit, precipitation, wind speed and direction, solar radiation, soil temperature at 2, 4 and 8 inches., atmospheric pressure, and soil moisture every 1 second[8].
University of Almeria implemented a modern remote meteorological station located about 100 Km from the university. This station used various wireless techniques especially radio, GSM (global system of mobile communication) and GPRS (general packet radio service).The data transmission serves to collect field’s meteorological information based on ATMEGA 16 microcontroller, which scans 8 sensors together at any programmable intervals[9].
The WEMS is an educational program based on LABVIEW software and inexpensive temperature, humidity, dew point, pressure, wind speed and wind direction wireless sensors system, this WSS designed to be calibrating and changing easy.
III. METHODOLOGY
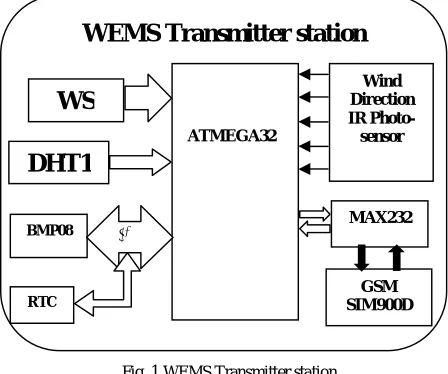
The WEMS system designed and implemented using ATMEAGA32 microcontroller, meteorological sensors, and GSM module.Figure.1 shows the block diagram of the transmitter station. In the transmitter station the microcontroller programmed with BASCOM AVR software. This software supports 1-wire serial interface, I2C interface, Rx/Tx serial interface, timer and general input/output purpose.
Fig. 1 WEMS Transmitter station
The transmitter station controlled by real time clock (RTC) system according to the time of observation. In the time of observation the microcontroller (ATMEGA32) sends instructions to start the data reading from the sensorsafter few milliseconds the sensors send the results to the microcontroller, and the microcontroller sends SMS data to the receiver station using GSM module.The digital sensor type BMP085 used to measure the pressure and temperature. This sensor has control unit with EEPROM and serial I2C interface to read the calibration data. The microcontroller sends a start sequence to start a pressure (UP) or temperature (UT) measurement. After converting time, the results value of UP or UT can be read. The BMP085 used to calculating temperature in degree centigrade and pressure in hecto-pascal units[10].The humidity sensor type DHT11 interfaced to ATMEGA32 via a single-wire serial interface used to measure the relative humidity. This 1-wire bus was pulled up with a resistor to VCC. The microcontroller programmed to send request to the DHT11 by pull down the bus for more than (18 ms), then pull it up for (45 us). The response time of DHT11 for the microcontroller request is (45 us) at low (0) and (80 us) at high (1). After a response time, the sensor sends packages of 5 segments of 8-bits for each package. The first two segments are humidity readout[11].The wind speed sensor fabricated using an optoelectronic sensor and cup wheel rotated by the wind. This cup wheel has three light-weight conical cups providing excellent linearity over the entire operating range up to 70 m/s. A chopper disc attached to the cup wheel's shaft cuts an infra-red light beam 14 times per revolution, generating a pulse train output from a phototransistor[12]. The timer of the ATMEGA 32 microcontroller used to count the pulses from the phototransistor in form of frequencies. The transfer functions used to measure the wind speed in meter per second[13]. The wind vane sensor fabricated using optoelectronic sensors with peripheral track connected to the shaft. Infra-red
WEMS Transmitter station
ATMEGA32
WS
DHT1
BMP08
RTC
Wind Direction IR
Photo-sensor
MAX232
ISSN(Online): 2320-9801
ISSN (Print): 2320-9798
I
nternational
J
ournal of
I
nnovative
R
esearch in
C
omputer
and
C
ommunication
E
ngineering
(An ISO 3297: 2007 Certified Organization)
Vol. 3, Issue 6, June 2015
LEDs and phototransistors mounted on five orbits on each side of 5-bits GRAY-code disc [12-14].The ATMEGA32 microcontroller of the receiver station was programed using BASCOM AVR software. The main purpose of using the microcontroller is to control and reading the SMS massage from the GSM module of the transmitter unit.
WEMS Receiver Station
Fig. 2 WEMS Receiver station
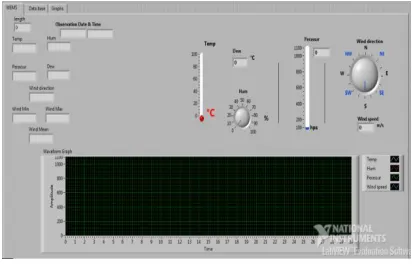
Figure 2 shows the receiver station block diagram. LABVIEW software was used to display, analysis, process, and storage the results. Figure 3 illustrates WMES graphical user interface (GUI) using LABVIEW software. This GUI implemented using front panel of the version 2009. WEMS design composed of slides, graphs, charts, gauges, and other controls and indicators[15].
Fig. 3 WEMS graphical user interface(GUI).
IV. RESULTS
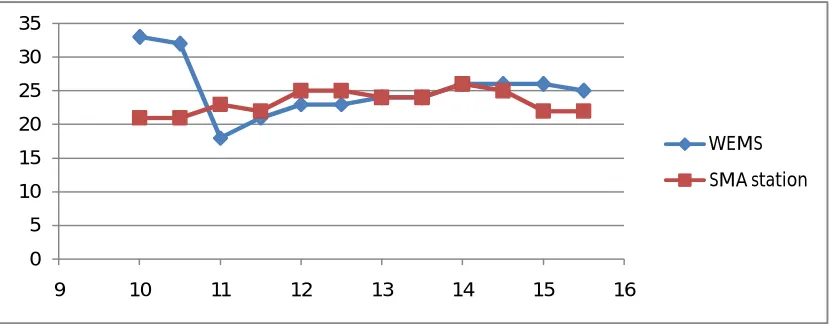
The WEMS readout data was collected and calibrated in random days in January of 2015. This data showed acceptable results when compared with Sudan Meteorological Authority (SMA) results.Figure 4 shows the data of WEMS temperature sensor in comparison with Sudan Meteorological Authority (SMA) temperature data on 13/1/2015 since 10 AM to 03:30 PM.
ATMEGA32
MAX232
GSM SIM900D User interface
PC 1
PC 2
ISSN(Online): 2320-9801
ISSN (Print): 2320-9798
I
nternational
J
ournal of
I
nnovative
R
esearch in
C
omputer
and
C
ommunication
E
ngineering
(An ISO 3297: 2007 Certified Organization)
Vol. 3, Issue 6, June 2015
Fig.4 Temperature comparison between WEMS and SMA sensors on 13/1/2015 since 10 AM to 03:30 PM
Figure 5 shows the data of WEMS pressure sensor in comparison with Sudan Meteorological Authority (SMA) pressure data on 13/1/2015 since 10 AM to 03:30 PM.
Fig. 5 Pressure comparison between WEMS and SMA sensors on 13/1/2015 since 10 AM to 03:30 PM
Figure 6 shows the data of WEMS humidity sensor in comparison with Sudan Meteorological Authority (SMA)
humidity data on 13/1/2015 since 10 AM to 03:30 PM.
Fig. 6Humidity comparison between WEMS and SMA sensors on 13/1/2015 since 10 AM to 03:30 PM 3
8 13 18 23 28 33
9 10 11 12 13 14 15 16
WEMS
SMA station
1014 1015 1016 1017 1018 1019 1020
9 10 11 12 13 14 15 16
WEMS
SMA station
0 5 10 15 20 25 30 35
9 10 11 12 13 14 15 16
WEMS
ISSN(Online): 2320-9801
ISSN (Print): 2320-9798
I
nternational
J
ournal of
I
nnovative
R
esearch in
C
omputer
and
C
ommunication
E
ngineering
(An ISO 3297: 2007 Certified Organization)
Vol. 3, Issue 6, June 2015
Figure 7 shows the data of WEMS dew pointin comparison with Sudan Meteorological Authority (SMA) dew pointdata on 13/1/2015 since 10 AM to 03:30 PM.
Fig. 7Dew point comparison between WEMS and SMA sensors on 13/1/2015 since 10 AM to 03:30 PM
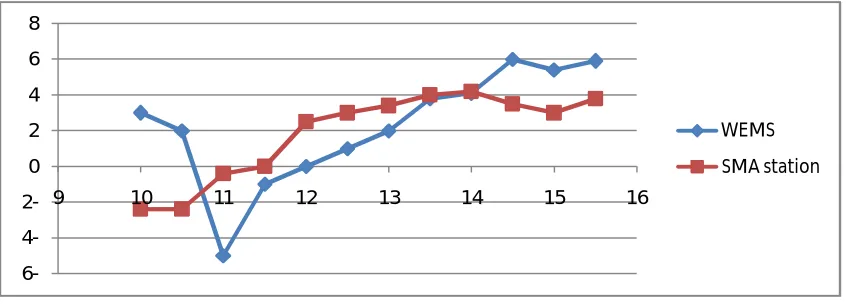
Figure 8 shows the data of WEMS Wind speed sensorin comparison with Sudan Meteorological Authority (SMA) Wind speed data on 13/1/2015 since 10 AM to 03:30 PM.
Fig. 8Wind speed comparison between WEMS and SMA sensors on 13/1/2015 since 10 AM to 03:30 PM
Figure 9 shows the data of WEMS temperature sensorin comparison with Sudan Meteorological Authority (SMA) temperaturedata on 26/1/2015 since 09 AM to 03:30 PM.
Fig. 9 Temperature comparison between WEMS and SMA sensors on 26/1/2015 since 09 AM to 03:30 PM
-6 -4
-2
0 2 4 6 8
9 10 11 12 13 14 15 16
WEMS
SMA station
0 2 4 6 8 10
9 10 11 12 13 14 15 16
WEMS
SMA station
0 5 10 15 20 25 30 35 40
9 10 11 12 13 14 15 16
WEMS
ISSN(Online): 2320-9801
ISSN (Print): 2320-9798
I
nternational
J
ournal of
I
nnovative
R
esearch in
C
omputer
and
C
ommunication
E
ngineering
(An ISO 3297: 2007 Certified Organization)
Vol. 3, Issue 6, June 2015
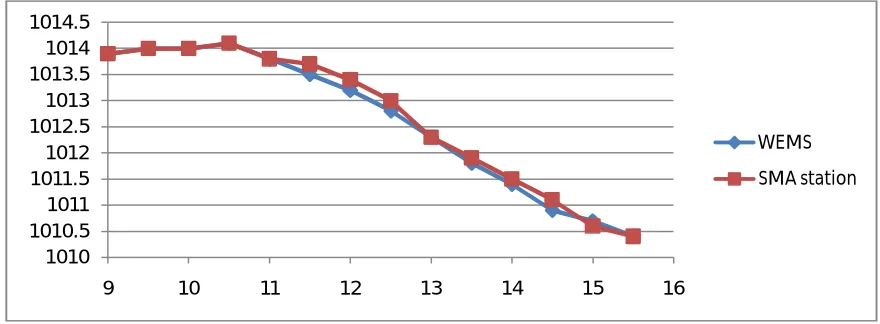
Figure 10 shows the data of WEMS pressure sensorin comparison with Sudan Meteorological Authority (SMA) pressure data on 26/1/2015 since 09 AM to 03:30 PM.
Fig. 10 Pressure comparison between WEMS and SMA sensors on 26/1/2015 since 09 AM to 03:30 PM
Figure 11 shows the data of WEMS humidity sensorin comparison with Sudan Meteorological Authority (SMA)humiditydata on 26/1/2015 since 09 AM to 03:30 PM.
Fig. 11 Humidity comparison between WEMS and SMA sensors on 26/1/2015 since 09 AM to 03:30 PM
Figure 12 shows the data of WEMS dew pointin comparison with Sudan Meteorological Authority (SMA) dew pointdata on 26/1/2015 since 09 AM to 03:30 PM.
1010 1010.5 1011 1011.5 1012 1012.5 1013 1013.5 1014 1014.5
9 10 11 12 13 14 15 16
WEMS
SMA station
0 5 10 15 20 25 30 35 40
9 10 11 12 13 14 15 16
WEMS
ISSN(Online): 2320-9801
ISSN (Print): 2320-9798
I
nternational
J
ournal of
I
nnovative
R
esearch in
C
omputer
and
C
ommunication
E
ngineering
(An ISO 3297: 2007 Certified Organization)
Vol. 3, Issue 6, June 2015
Fig. 12 Dew point comparison between WEMS and SMA sensors on 26/1/2015 since 09 AM to 03:30 PM
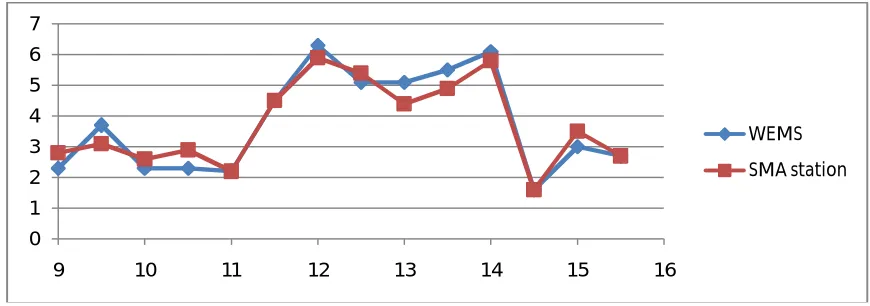
Figure 13 shows the data of WEMS wind speed sensor in comparison with Sudan Meteorological Authority (SMA) wind speeddata on 26/1/2015 since 09 AM to 03:30 PM.
Fig. 13 Wind speed comparison between WEMS and SMA sensors on 26/1/2015 since 09 AM to 03:30 PM
The standard deviation of WEMS data processed and calculated as shown in table 1 bellow. This table showed acceptable and efficient results. These results are the calibration and comparison results between WEMS and Sudan Meteorological Authority (SMA).
Table 1: standard deviation of WEMS
Date standard deviation
Temp
(°C) (hpa) P Hum % DP °C WS m/s 13/1/2015 0.01 0.34 1.23 0.29 0.70 20/1/2015 0.15 0.10 0.16 0.24 0.73 22/1/2015 0.27 0.01 0.64 0.49 0.53 25/1/2015 016 0.16 0.20 0.03 0.05 26/1/2015 0.24 0.04 0.30 0.42 0.02
0 2 4 6 8 10 12
9 10 11 12 13 14 15 16
WEMS
SMA station
0 1 2 3 4 5 6 7
9 10 11 12 13 14 15 16
WEMS
ISSN(Online): 2320-9801
ISSN (Print): 2320-9798
I
nternational
J
ournal of
I
nnovative
R
esearch in
C
omputer
and
C
ommunication
E
ngineering
(An ISO 3297: 2007 Certified Organization)
Vol. 3, Issue 6, June 2015
V. DISCUSSION AND CONCLUSION
WEMS has been developed and designed as a movable data-acquisition system for the meteorological students; it has satisfied accuracy and can be configured easily. A wireless data transmission system between two stations (as a model design) was implemented and calibrated in Sudan Meteorological Authority (SMA).
WEMS testing data for analysis and calibration purpose was collected randomly in January of 2015. This paper showed the data of 13/1/2015 (starting day) and data of 26/1/2015 (last day).
Temperature (Temp °C) and pressure (P/hpa) WEMS data compared with SAM temperature and pressure during all days and found that, the BMP085 used to measuring WEMS temperature and pressure had a good accuracy and response. Humidity (Hum %) data varied between in range and out of range and that for; the response of DHT11 (humidity sensor used in (WEMS) is very slow, and it needs a long time for a good response after power ON, and that is clear in starting time of figure 6 and figure 11 (needs more than 30 minutes for a good response). And that for the dew point (DP/ °C) also, because the DP depends on the value of humidity. For wind speed (WS m/s) in first day, it is clear that the most of WS data are out of range, WEMS wind speed in first day was taken instantly and the (SMA) wind speed was taken as an average for many readings according to the interval time (2 or 10 minutes before the actual reading) which determine by the meteorologist. In last day, the program code was changed to collect the wind speed data in average of 10 seconds readings compared with instant readings of SMA wind speed, it's clear that the wind speed readings became in a good interval compared with the other wind speed readings in first day.
REFERENCES
1. James R. Holton, andGregory J. Hakim, “An Introduction to Dynamic Meteorology”, Academic press: Elsevier, 3rdedition,pp.5-27, 2013. 2. Helen Brindly, and Jacqueline Russell, “Monitoring the climate system from space: progress, pitfalls and possibilities”,Grantham institute for
climate change-Imperial college,Briefing paper No 9, 2013.
3. Thomas H. VonderHaar., “Satellite Meteorology- An introduction“, Academic press: Elsevier,pp.183-396, 1995
4. Manuel J. Blanco, William M. Berg, and Fabio Urbani, “Wireless solar radiation and meteorological instrument for K-12 Technology Education”,American Society for Engineering EducationConference,Session 2359, 2003.
5. Ian Ashpole, “Radcliffe Meteorological Station:The Weather at Oxford in 2012 Annual report”,Oxford University Centre for the Environment,pp.1-3, 2012.
6. Ian Ashpole, “Radcliffe Meteorological Station: The Weather at Oxford in 2013 Annual report”,Oxford University Centre for the Environment,pp.1-2, 2013.
7. Station, R.M. 2014; Available from: http://www.geog.ox.ac.uk/research/climate/rms/.
8. GerritHoogenboom, D.D.Coker, J.M. Edenfield, D.M. Evans and C. Fang, “GeorgiaAutomated Environmental Monitoring Network -Ten Years of Weather Information for Water Resources Management”,Georgia Water Resources Conference,pp.896-902, 2003.
9. S. Rosiek, and F.J.Batlles,“A microcontroller-based data-acquisition system for meteorological station monitoring”,ScienceDirect: Elsevier,pp.3746–3754, 2008.
10. sensortec, B. Digital pressure sensor 2011; Available from: http://www.BMP085_DataSheet_Rev.1.0_01July2008.pdf.
11. ParthaPratim Ray, and Rebika.Rai, “Validation of Range of Resistance of Sensor through Sensor Data Acquisition using SimPlot: A Case Study”,International Journal of Advanced Research in Computer Science and Software Engineering, Volume 4,Issue 3,pp.1251-1255, 2014. 12. D. W. Wekesa, J.N.Mutuku, and .J.N.Kamau,“Microcontroller-Based Data Logging Instrumentation System for Wind Speed and Direction
Measurements”,Journal of Agriculture,Science and Technology,Volume 14,Issue 1,pp.176-189, 2012.
13. Vedat M. Karslı, and Haci Can, “Multipoint Wind Speed and Direction Measurement and Data Logging by using 8051-Based Microcontroller ”,American journal of science, Volume157,pp.2482-2488, 2007.
14. D. W. Wekesa, J.N.Mutuku, and .J.N.Kamau,“Automated Data Logging Instrumentation System for Wind Speed and Direction Measurements”,8thJKUAT Scientific Technological and Industrialization Conference,pp.289-295, 2013.