INVESTIGATION
Fixation Probability in a Two-Locus Model
by the Ancestral Recombination
–
Selection Graph
Sabin Lessard1and Amir R. Kermany Département de Mathématiques et de Statistique, Université de Montréal, Montréal, Québec H3C 3J7, Canada
ABSTRACTWe use the ancestral influence graph (AIG) for a two-locus, two-allele selection model in the limit of a large population size to obtain an analytic approximation for the probability of ultimatefixation of a single mutant alleleA. We assume that this new mutant is introduced at a given locus into afinite population in which a previous mutant alleleBis already segregating with a wild type at another linked locus. We deduce that thefixation probability increases as the recombination rate increases if alleleAis either in positive epistatic interaction withBand alleleBis beneficial or in no epistatic interaction withBand then alleleAitself is beneficial. This holds at least as long as the recombination fraction and the selection intensity are small enough and the population size is large enough. In particular this confirms the Hill–Robertson effect, which predicts that recombination renders more likely the ultimate fixation of beneficial mutants at different loci in a population in the presence of random genetic drift even in the absence of epistasis. More importantly, we show that this is true from weak negative epistasis to positive epistasis, at least under weak selection. In the case of deleterious mutants, thefixation probability decreases as the recombination rate increases. This supports Muller’s ratchet mechanism to explain the accumulation of deleterious mutants in a population lacking recombination.
T
HE Hill–Robertson (HR) effect (Hill and Robertson 1966) is often mentioned as one of the main arguments in favor of the evolution of recombination. In short, it pre-dicts that beneficial mutant alleles arising at different loci in afinite population are more likely tofix in the population as the recombination rate increases even when selection acts independently upon the loci.Since the early works of Fisher (1930) and Muller (1932), it is generally believed that an evolutionary advan-tage of recombination is to bring together beneficial mutant alleles arising at different loci. Accordingly the effect of re-combination should be to increase the rate of evolution of the population (Crow and Kimura 1965). However, it has been shown that recombination has no effect on this rate in an infinite population if there is initial linkage equilibrium and absence of epistasis so that linkage equilibrium is main-tained thereafter in the population (Felsenstein 1965; Maynard Smith 1968).
If recombination can have an effect on the rate of evolution only by breaking down linkage disequilibrium in
absolute value, then the effect should be to increase this rate only when linkage disequilibrium in the population is negative (NLD). In the case of a two-locus model, this happens when the frequency of the double mutant is strictly smaller than the product of the frequencies of the mutant alleles. This situation is arguably likely to happen in the view that beneficial mutations are very rare (Crow and Kimura 1969).
On the other hand, NLD could be produced by negative epistasis (NE), with the double mutant being less fit than what it would be under independent effects of the mutant alleles. Then the double mutant would die more often than is expected with mutant alleles acting independently, leaving NLD in the population. In the opposite case of positive epistasis (PE), Eshel and Feldman (1970) showed that the frequency of the double mutant in an infinite pop-ulation is always larger in an asexual poppop-ulation than in a population with recombination. This suggests that NE rather than PE could be advantageous for the evolution of recombination.
In taking account of a finite population size, Bodmer (1970) considered the expected time until the first forma-tion of a double mutant from two initial single mutants. He concluded that recombination would have a greater advan-tage in a small population than in a large one. Karlin (1973) Copyright © 2012 by the Genetics Society of America
doi: 10.1534/genetics.111.136309
Manuscript received June 10, 2011; accepted for publication November 14, 2011
1Corresponding author: Département de Mathématiques et de Statistique, Université
showed that this expected time, without selection effects, was indeed a decreasing function of the recombination rate
r. But he showed also that the expected time until the total fixation of the double mutant was an increasing function of
r. In other words, increasing recombination might be advan-tageous in speeding the time until thefirst formation of the double mutant, but disadvantageous by breaking apart the favored gamete type once formed.
Summingfirst-order terms for expected changes in gene frequencies in a largefinite population under weak selection with additive gene action, which corresponds to an absence of epistasis (AE), Hill and Robertson (1966) deduced that the probability offixation of an alleleAinitially in NLD with a beneficial alleleBat another tightly linked locus increases with the recombination fraction between the two loci. The effects of linkage disequilibrium and epistasis on the proba-bility offixation of gametes and alleles in afinite population under the assumption of weak selection were further stud-ied by diffusion approximations in the limit of a large pop-ulation size (Ohta 1968).
In the case of initial linkage equilibrium (LE) in afinite population, first-order approximations fail to detect the effect of linkage on the fixation probability. Higher-order effects in the absence of epistasis were first exhibited by simulations (Hill and Robertson 1966).
In afinite population initially in LE, genetic drift creates random instances of linkage disequilibrium. Although ran-dom drift can generate both positive and negative disequi-libria without anya prioribias on average, selection dispels positive linkage disequilibrium (PLD) more efficiently than NLD even in the absence of epistasis, so that the average linkage disequilibrium becomes negative. As shown by sim-ulations and some analytical arguments (Hill and Robertson 1966; see also Barton and Otto 2005), this leads to an av-erage accumulation of NLD. As a consequence, responses to selection at different loci are expected to interfere with each other, even in the absence of gene interaction. This is known as the HR effect. It is by reducing the interference caused by the randomly generated linkage disequilibrium that an in-crease in the recombination rate raises the rate offixation of favorable mutants.
The relationship between the HR effect and the Fisher– Muller theory for the evolutionary advantage of recombina-tion was pointed out by Felsenstein (1974). Moreover, it was noted that Muller’s ratchet mechanism (Muller 1964) for the accumulation of deleterious mutants in the absence of recombination, which is formally equivalent to the accumu-lation of advantageous mutants in the presence of recombi-nation, can be explained by the HR effect.
The theory of evolution at a selectively neutral modifier locus that controls the recombination fraction between two major loci that are under selection in an infinite population was developed by Feldman et al.(1980). If the major loci are in linkage disequilibrium at a balance between selection against deleterious alleles and mutation toward them, then a mutation increasing recombination succeeds if the linkage
disequilibrium is negative, which occurs when epistasis is negative, and the modifier locus is sufficiently tightly linked to the major loci. If the modifier locus is loosely linked, NE has to be weak enough (Otto and Feldman 1997). A similar conclusion has been reached for sweeps of beneficial alleles (Barton 1995a). However, including spatial heterogeneity extends the range of epistasis over which recombination can be favored, from strong NE to PE depending on envi-ronmental circumstances (Lenormand and Otto 2000).
On the other hand, Feldman et al. (1980) also showed that, if the major loci are at a stable equilibrium in linkage disequilibrium under selection and recombination, then a mutation at the modifier locus increases in frequency when rare if and only if it decreases the recombination frac-tion. This is part of a general reduction principle for genetic modifiers in an infinite population in a constant environ-ment (Feldman and Liberman 1986).
It has been argued that a modifier allele that increases the recombination rate would be promoted in a finite population due to its role in reducing the negative effect of poor genetic backgrounds on the probability offixation of favorable mutants, at least in the absence of epistasis. This has been shown by applying a branching process to mutant lines in an infinite population with deterministic changes in the frequencies of the genetic backgrounds (Barton 1995b; Otto and Barton 1997). The same approach has been used to study the probability that both beneficial mutantsfix. The analysis of this probability has been refined to deal with the troublesome case where the second mutant is more benefi -cial than thefirst (Yu and Etheridge 2010).
Simulations have indicated that this is true across a broad range of epistatic interactions, from weak negative epistasis to positive epistasis, provided that the population size is small enough (Otto and Barton 2001). This suggests that the HR effect overwhelms the influence of epistasis on LD over a wide range of epistasis values.
More recently, a perturbation method to track fl uctua-tions in linkage disequilibrium during the spread of benefi -cial alleles and to measure the impact on a modifier allele of recombination has been proposed (Barton and Otto 2005). The method consists of considering only thefirst and second moments of random sampling effects on the deterministic dynamics for the allele frequencies and linkage disequilib-rium in an infinite population.
size makes use of the coalescent (Kingman 1982) and its extension to incorporate multiple mergers in the case of highly skewed reproduction schemes (Pitman 1999; Sagitov 1999; Möhle and Sagitov 2001).
In the case of multilocus selection models with a Wright– Fisher reproduction scheme allowing for recombination in a population offixedfinite size, Lehman and Rousset (2009) considered Taylor expansions of the fixation probability with respect to the intensity of selection. They deduced exact linear recurrence systems of equations for gamete frequencies in sampled individuals backward in time under neutrality to compute the coefficients. Advanced matrix theory was used to interpret these coefficients in terms of mean sojourn times in the backward neutral process. How-ever, afirst-order expansion of thefixation probability with respect to the intensity of selection is not sufficient to de-tect the HR effect in a two-locus model in the absence of epistasis. Actually, a third-order expansion is necessary. In this case, the coefficients of the approximation become dif-ficult to interpret.
Our objective in this article is to consider an ancestral recombination–selection process to deduce an analytic ap-proximation for the probability of ultimate fixation of an allele in afinite but large population under weak selection and tight linkage. The allele is assumed to be a mutant type Aintroduced at a given locus into the population in which a previous mutant type B is already segregating with a wild type at another linked locus. Exact conditions for a small increase in the recombination rate to increase the probability of ultimate fixation of a single A are addressed.
We focus on a discrete-time two-locus selection model with a Moran reproduction scheme (Moran 1958). We con-sider the ancestral recombination–selection graph for sam-pled gametes in the limit of a large population size, which is known as the ancestral influence graph (AIG) (Donnelly and Kurtz 1999). The AIG provides a supragenealogy for a sample of individuals at linked, nonneutral loci in a limit-ing Flemlimit-ing–Viot measure-valued diffusion process with se-lection and recombination. It is a supragenealogy in the sense that the true genealogy of the sample is embedded into it. It combines the ancestral recombination graph (ARG) (Griffiths and Marjoram 1996, 1997) and the ancestral selec-tion graph (ASG) (Krone and Neuhauser 1997; Neuhauser and Krone 1997), extending the coalescent (Kingman 1982) to include both recombination and selection. The ARG and ASG, given the sample composition, have been widely used in likelihood methods to estimate the recombination rate or detect recombination hotspots (e.g., McVean et al.
2002; Stephens and Donnelly 2003; Fearnheadet al.2004; Wakeley and Sargsyan 2009) and to locate disease genes from marker loci (e.g., Hudson and Kaplan 1988; Fearnhead 2003; Larribe and Lessard 2008; Larribe and Fearnhead 2011).
We make use of a discrete-time Moran model for mortality selection determined at two loci in afinite haploid
population to ascertain the analysis. After recalling the def-initions and assumptions, the probability of ultimate fi xa-tion of an allele is expressed in terms of sums of expected sample frequencies, which correspond to expected times with given ordered random samples. Then the ancestral graphs obtained by tracing the supragenealogy of an or-dered random sample through coalescence, recombination, or selection events backward in time, whose limit as the population size increases is an AIG, are described. These graphs are used to express the expected times with ordered random samples of given types. It is shown that an approximation of any order of thefixation probability with respect to the population-scaled recombination and selec-tion parameters in the limit of a large populaselec-tion size can be obtained by considering ancestral graphs with enough recombination or selection events. Finally this is applied to directional selection with either beneficial mutants or deleterious mutants, in epistatic interaction or in the absence of interaction, by considering one recombination event and one or two selection events to detect the effect of recombination.
It is expected that the results are valid in the domain of attraction of the Fleming–Viot process with recombi-nation and selection in the same way that a wide class of Cannings exchangeable models including the Moran model and the Wright–Fisher model fall in the domain of attraction of the Kingman coalescent (Möhle and Sagitov 2001).
Definitions and Model
Suppose a population of finite size N distributed over N
distinct sites, so that each site is occupied by one and only one individual. Each individual is one of four types,AB,Ab,
aB, orab, with respect to two loci with allelesA,a segregat-ing at locus 1 andB,bat locus 2.
Reproduction is assumed to follow a discrete-time Moran model. At each time stept $0, two individuals are sampled at random in the population and they produce an offspring. Random sampling of the parents is assumed to take place with replacement so that selfing is permitted and then occurs with probabilityN21.
With respect to the two loci, the offspring produced is either an exact copy of one of its parents, with probability 1–r, or a recombinant, with probabilityr. This probability of recombination is inversely proportional to the population size, so that r = rN21, where r represents a population-scaled recombination fraction. Weak recombination is mod-eled by keepingrconstant asN/N.
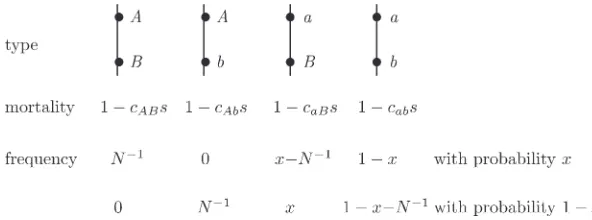
On the other hand, one individual is chosen at random to be replaced by the offspring. Replacement actually occurs with some probability that depends on the type of the individual, called its mortality. It is given by 1 –cABs, 1–cAbs, 1–caBs, or 1–cabsfor an individual of typeAB,
occur, then the offspring is eliminated and there is no change in the population during the corresponding time step.
Here, the parameters 0#cAB,cAb,caB,cab#1 represent coefficients of selection with respect to an intensity of selec-tion 0,s,1. They can be viewed as viability parameters. Neutrality corresponds tos= 0.
The intensity of selection is expressed in the form s = sN21, where N is the population size. The parameter s stands for a population-scaled intensity of selection. Weak selection is modeled by keepingsconstant asN/N.
Alleles AandB are mutant types, while allelesa and
b are wild types. The mutant allelesAandB are advan-tageous when each one reduces the mortality of its car-rier compared to what it would be without these alleles. This is the case if the coefficients of selection satisfy the inequalities
cAB . maxðcAb; caBÞ$minðcAb; caBÞ . cab: (1)
On the other hand, if we have
cAB , minðcAb; caBÞ#maxðcAb; caBÞ , cab; (2)
then the mutant allelesAandBare deleterious.
AlleleBis a mutant that was introduced some time ago at locus 2 into a population entirely composed ofabindividuals and its frequency has reached some value 0,x,1. Then a single mutant allele Ais introduced at random at locus 1 into the population, so that it is linked toBwith probabilityx
and tobwith the complementary probability 1–x. In both cases its frequency is given by the inverse of the population size, that is,N21. In the former case, the frequency ofaBis reduced tox–N21and in the latter the frequency ofab is reduced to 1–x–N21.
Linkage disequilibrium (LD) is measured by the differ-ence between the frequency of the double mutant,AB, and the product of the frequencies of the mutant alleles,AandB, which is represented by D. Alternatively,D is equal to the difference between the product of the frequencies ofABand
ab and the product of the frequencies ofAbandaB. In the present case, linkage disequilibrium following the introduc-tion of a singleAis initially positive (PLD) with probabilityx
and given byN21(1–x), while it is initially negative (NLD) with probability 1 – xand given by –N21x. This yields an average LD given by
D¼N21ð12xÞxþ2N21xð12xÞ ¼0: (3)
Then we are in a situation of an initial average LE.
Epistasis refers to the phenomenon in which the effect of a mutant at one locus, here B, is masked or enhanced by a mutant at another locus, here A. Population geneticists extended the concept to mean nonindependent or multipli-cative effects of mutants.
Epistasis is positive (PE) if interactions betweenAandB
are such that the double mutant is morefit in comparison to the wild gamete type than what it would be if the mutant alleles have independent effects onfitness. In terms of mor-tality parameters, this means the inequality
12cABs
12cabs,
12cAbs
12cabs
12caBs
12cabs:
(4)
If the inequality is reversed, then epistasis is negative (NE). In the case of an equality, there is no epistasis (AE).
Where advantageous mutations are concerned, PE enhances the fitness increase predicted from individual mutational effects, whereas NE lessens it. It is the opposite for deleterious mutations with respect tofitness decrease.
Note that, in the limit of weak selection when s = sN21/0 asN/N, epistasis is positive, negative, or null if
e ¼ cAB2cAb2caB þ cab (5)
is positive, negative, or null, respectively. Moreover, note that22#e#2 under our general conditions on the coef-ficients of selection, but21,e , 1 in the case of either advantageous mutations or deleterious mutations.
Expected Change in Allele Frequency
Letx(t) = (xAB(t),xAb(t),xaB(t),xab(t)) be the vector of the individual type frequencies at the current time step t $0. Then the frequency ofABat the next time step will increase by N21with probability
nABðtÞ ¼ xABðtÞð12xABðtÞÞ þN21sxABðtÞðcABxABðtÞ2cðtÞÞ
þ N21rð12xABðtÞÞðxAðtÞxBðtÞ2xABðtÞÞ
þ N22srðc
ABxABðtÞ2cðtÞÞðxAðtÞxBðtÞ2xABðtÞÞ:
(6)
Similarly it will decrease byN21with probability
mABðtÞ ¼ xABðtÞð12xABðtÞÞ2N21scABxABðtÞð12xABðtÞÞ
2 N21rx
ABðtÞðxAðtÞxBðtÞ2xABðtÞÞ
þ N22src
ABxABðtÞðxAðtÞxBðtÞ2xABðtÞÞ:
(7)
Otherwise it will remain the same with the complementary probability 1–nAB(t)–mAB(t). Here we use the notation
xAðtÞ ¼xABðtÞ þxAbðtÞ ¼12xaðtÞ (8)
for the frequency of alleleAand similarly
xBðtÞ ¼xABðtÞ þxaBðtÞ ¼12xbðtÞ (9)
for the frequency of alleleB. Moreover,
cðtÞ ¼cABxABðtÞ þcAbxAbðtÞ þcaBxaBðtÞ þcabxabðtÞ (10)
stands for the mean coefficient of selection at time stept. Therefore, the change in the frequency of ABfrom time steptto time stept+ 1, given byDxAB(t) = xAB(t+ 1)–
xAB(t), is found to have
EðDxABðtÞjxðtÞÞ ¼N22sxABðtÞðcAB2cðtÞÞ
þ N22rðxAðtÞxBðtÞ2xABðtÞÞ
2 N23srcðtÞðxAðtÞxBðtÞ2xABðtÞÞ
(11)
as conditional expectation. Similarly we have
EðDxAbðtÞxðtÞÞ ¼N22sxAbðtÞðcAb2cðtÞÞ
þ N22rðx
AðtÞxbðtÞ2xAbðtÞÞ
2 N23srcðtÞðx
AðtÞxbðtÞ2xAbðtÞÞ
(12)
for the change in the frequency of Ab. Hence the change in the frequency of allele A, which can be expressed as DxA(t) =DxAB(t) +DxAb(t), has conditional expectation
EðDxAðtÞxðtÞÞ ¼N22sxAðtÞðcAðtÞ2cðtÞÞ: (13)
Here the quantity
cAðtÞ ¼cABxABðtÞ
xAðtÞ
þcAb
xAbðtÞ
xAðtÞ
(14)
represents the marginal coefficient of selection of alleleAat time stept. Straightforward algebraic manipulations lead to the following conclusion.
Proposition 1 For the discrete-time Moran model with re-combination and selection described in Figure 1, the condi-tional expected change in the frequency of A is given by
N2s21EðDxAðtÞjXðtÞÞ ¼ xABðtÞxaBðtÞðcAB2caBÞ
þ xABðtÞxabðtÞðcAB2cabÞ
þ xAbðtÞxaBðtÞðcAb2caBÞ
þ xAbðtÞxabðtÞðcAb2cabÞ;
(15)
where N is the population size and s= sN is a population-scaled intensity of selection with coefficients0#cAB,cAb,caB,
cab # 1 for the individual types AB, Ab, aB, and ab,
respectively.
Probability of Fixation of an Allele at One Locus
The random process x(t) = (xAB(t),xAb(t),xaB(t), xab(t)) fort $0 is a Markov chain on afinite state spaceS. This is the set of all four-dimensional frequency vectors whose entries are multiples of N21.
There are four absorbing states represented by
eAB¼ ð1;0;0;0Þ; eAb¼ ð0;1;0;0;Þ; eaB¼ ð0;0;1;0Þ;
eab¼ ð0;0;0;1Þ:
These correspond to the fixation ofAB,Ab,aB, andab, re-spectively. All other states are transient.
In virtue of the ergodic theorem for Markov chains (see,
e.g., Karlin and Taylor 1975; Grimmett and Stirzaker 1982), the probability of transition from statexto stateyinktime steps, namely
PxyðkÞ ¼ PðxðkÞ ¼ y j xð0Þ ¼ xÞ; (16)
converges to somefixation probability in the limit of a large number of time steps, represented by Pxy(N). This proba-bility is 0 unlessyis an absorbing state. Therefore,
EðxAðkÞjxð0Þ ¼xÞ ¼ X
y
ðyABþyAbÞPxyðkÞ; (17)
where the summation is over ally= (yAB,yAb,yaB,yab) inS, converges in the same limit to
PXeABðNÞ þPXeAbðNÞ ¼uAðxÞ: (18) This is the probability of ultimate fixation of A given an initial population statex.
On the other hand, we have
xAðkÞ ¼xAð0Þ þ Xk
t¼0
DxAðtÞ; (19)
and therefore
EðxAðkÞjxð0ÞÞ ¼xAð0Þ þ Xk
t¼0
EðDxAðtÞjxð0ÞÞ (20)
by additivity of conditional expectation. As k / N, this leads to
uAðxð0ÞÞ ¼xAð0Þ þ XN
t¼0
EðDxAðtÞjxð0ÞÞ: (21)
EðDxAðtÞjxð0ÞÞ ¼EðEðDxAðtÞjxðtÞÞjxð0ÞÞ: (22)
Then Proposition 1 for the conditional expected change in the frequency ofAleads to the following result.
Proposition 2 For the discrete-time Moran model with re-combination and selection of Proposition 1, the probability of ultimatefixation of A is given by
uAðxð0ÞÞ ¼ xAð0Þ þ
s
2ðcAB2caBÞEAB;aBðxð0ÞÞ þ s
2ðcAB2cabÞEAB;abðxð0ÞÞ þ s
2ðcAb2caBÞEAb;aBðxð0ÞÞ þ s
2ðcAb2cabÞEAb;abðxð0ÞÞ;
where
Ez1;z2ðxð0ÞÞ ¼2N
22XN
t¼0
Eðxz1ðtÞxz2ðtÞjxð0ÞÞ; (23)
for z1= AB,Ab and z2= aB,ab.
The quantity Ez1;z2ðxð0ÞÞ defined in Proposition 2 repre-sents the expected time in number of N2/2 time steps and
over all time steps that two individuals chosen at random
with replacementin the population at the same time stept $ 0 will be of typesz1andz2in this order.
Ancestral Recombination–Selection Graph
An ancestral recombination–selection graph is a Markov chain on ordered samples obtained by tracing backward in time the ancestors, real or virtual, of a given number of individuals chosen at random without replacement in the population at a given time step. It is characterized by a se-quence of changes in the ancestry of the sample and times between these events.
As in Krone and Neuhauser (1997), this process is con-sidered in the framework of a Moran model, but in discrete time and with recombination allowed, so that a change in the ancestry can involve simultaneous events of coalescence, recombination, or selection. In the limit of a large popula-tion size, however, with time and parameters for recombi-nation and selection appropriately scaled, only one event of coalescence, recombination, or selection can occur at a time with probability one. The limiting process corresponds to the AIG introduced by Donnelly and Kurtz (1999), as described in Fearnhead (2003). An exact description of the ancestral graph incorporating recombination and selection in a dis-crete-time Moran model could not be found in the literature, although it might exist. Such a description is actually neces-sary to establish rigorous approximation results for the prob-ability of fixation in the presence of recombination and selection.
Consider the model of the previous section with 1–cABs, 1–cAbs, 1–caBs, and 1–cabsas mortalities associated to the
individual typesAB,Ab,aB, andab, respectively, under the conditions 0#cAB,cAb,caB,cab#1 and 0,s,1.
The replacement rule for an individual chosen at ran-dom can be described as follows. Replacement is inevitable irrespective of the type of the individual with probability 1 –s, which corresponds to the lowest possible mortality. On the other hand, replacement is type specific with prob-abilitys. In this case, replacement occurs with conditional probability
8 > > < > > :
12cAB if AB;
12cAb if Ab;
12caB if aB;
12cab if ab:
The law of total probability guarantees that the probability of replacement is given by the mortality of the individual. For an individual of typeAb, for instance, replacement will occur with probability 1–s+s(1–cAb), which is the same as 1 – cAbs. With the complementary probability, there is no replacement.
A type-specific replacement is considered to be a selection event. Its probability in one time step is expressed in the forms=sN21. Recall that the probability of a recombination event in one time step is expressed in a similar form, namely
r=rN21.
The scaling used for the probabilities of selection or recombination events, along withN2/2 time steps as unit of
time, will simplify the ancestral process in the limit of a large population size. This timescale is standard for a discrete-time Moran model (see,e.g., Ewens 1990).
Consider a sample ofn distinct individuals in the popu-lation at a given time step and label them arbitrarily with the integers i = 1,. . .,n. Label arbitrarily the otherN –n
individuals in the population at the same time step with the integersi=n+ 1,. . .,N.
Following the lineages of the sampled individuals in one time step back, there will be pure coalescence ofiandj, fori,
j= 1,. . .,nwithi6¼j, if the offspring produced was an exact copy of j [probability N21(1 – rN21)] and the individual replaced irrespective of its type was the individual that oc-cupied the site of i [probability N21(1 – sN21)] or vice versa. We conclude that
2
N2
12s
N
12r
N
¼2N221þON21#2N22 (24)
is the probability for each pure coalescence event to occur within a sample of size n in one time step back. Then the sample size is reduced by one by merging the lineages of two sampled individuals.
On the other hand, there will be pure recombination ofi
in one time step back, fori= 1,. . .,n, if the offspring pro-duced was a recombinant of kandlnot in the sample and different from each other, that is, fork,l=n+ 1,. . .,Nwith
that occupied the site of i [probability N–1(1 – sN21)].
Therefore, wefind that
rðN2nÞðN2n21Þ
N4
12s
N
¼rN221þON21# rN22
(25)
is the probability for each pure recombination event to occur in a sample of size nin one time step back. In this case the sample size is increased by one by splitting the lineage of one sampled individual into two, each one being actually ancestral to the sampled individual at only one of the loci.
Finally there will be pure selection ofiin one time step back, fori= 1,. . .,n, if the offspring produced was an exact copy of k not in the sample, that is, for k= n+ 1,. . .,N
[probability (N–n)N21(1–rN21)], and the individual cho-sen to be replaced according to its type is the one that oc-cupied the site of i(probabilitysN22). We conclude that
sðN2nÞ N3
12r
N
¼sN221þON21#sN22 (26)
is the probability for each pure selection event to occur in a sample of sizenin one time step back.
In the case of a pure selection event, the sample size is increased by one by branching the lineage of one sampled individual into two, each one being potentially ancestral to the sampled individual at both loci. The incoming lineage is the lineage of the offspring produced one time step back, while the continuing lineage is the lineage of the individual chosen to be replaced by the offspring. One of these lineages is real and the other virtual, but both lineages must be traced back until ancestors of known types are reached. Then the conditional probability of replacement can be determined.
Note that the probabilities of pure coalescence, recombi-nation, or selection events in one time step back for a sample offixed sizenare all functions of orderN22, denoted by
O(N22). On the other hand, the probabilities of multiple events involving simultaneous coalescence, recombination, or selection events that would affect the lineages of the sampled individuals in one time step back are all functions of orderO(N23). In all cases the sample size can decrease by at most one, when a pure coalescence event occurs, and increase by at most two, when a selection event and a re-combination event occur simultaneously but without any coalescence event occurring.
Given a sample of size n, the total number of pure co-alescence events to consider isn(n–1)/2, while this number is n for pure selection events and for pure recombination events. Therefore, the total probability of change in one time step back for the whole sample is given by
pn¼2lnN22þO
N23; (27)
where
ln¼
nðn21þrþsÞ
2 : (28)
This quantity represents the total rate of change in the limit of a large population size with N2/2 time steps as unit of
time. Moreover, given a change in one time step back, the conditional probability of each pure coalescence, recombi-nation, or selection event is
PðCnÞ ¼l1
nþO
N21; (29)
PðRnÞ ¼
r 2ln
þON21; (30)
or
PðSnÞ ¼
s 2lnþO
N21; (31)
respectively, and independently of everything else, while the conditional probability of each multiple event is
PðMnÞ ¼O
N21: (32)
In the limit of a large population size, the conditional probabilities of multiple events vanish.
Let the time back, in number of time steps, for a sample of size n to be affected by any coalescence, recombination, or selection event be represented bytn. This sojourn time is a geo-metric random variable independent of all previous transition events and sojourn times, whose expected value is given by
EðtnÞ ¼ XN
k¼0
Pðtn.kÞ; (33)
where
Pðtn.kÞ ¼ ð12pnÞk: (34)
The corresponding time back in number ofN2/2 time steps,
namely
Tn¼2tnN22; (35)
converges in distribution to an exponential random variable with parameterlnin the limit of a large population size. As a matter of fact,
PðTn>tÞ ¼P
tn>
º
tN2
2
⌋
; (36)
where⌊ ⌋denotes the integer value, and
lim
N/NP
tn>
º
tN 22
⌋
¼expð−lntÞ; (37)
EðTnÞ ¼ ZN
0
PðTn.tÞdt; (38)
where
PðTn.tÞ#
12lnN22 tN2=221
#2 exp
2lnt
2
; (39)
forNlarge enough. Therefore,
lim
N/NEðTnÞ ¼
ZN
0
expð2lntÞdt¼l2n1 (40)
in virtue of the dominated convergence theorem. Let us summarize.
Proposition 3 Consider the discrete-time Moran model of Proposition 1 with population-scaled recombination frac-tion r= rN and population-scaled intensity of selection s= sN in the case of coefficients of selection0#cAB,cAb,caB,cab# 1. In addition, consider an ordered sample without replace-ment of size n in a population of large size N. Backward in time,each pair of lineages merges as a result of a coalescence event with approximate probability 2N–2,while each lineage
splits into two as a result of a recombination event with ap-proximate probabilityrN–2or branches into two as a result of
a selection event with approximate probability sN–2, for an
approximate total probability of change 2lnN–2 = n(n – 1 + r+s)N–2. In number of N2/2time steps in the limit of
a large population size,the expected time for a change isl21 n .
Moreover,in the case of a change caused by a selection event,
the incoming lineage is real with conditional probability1–
cAB, 1–cAb, 1–caB,or1–cabif the type of the individual on
the continuing lineage is AB,Ab,aB,or ab,respectively.
Calculation for Fixation Probability
An ordered sample ofnindividuals is represented by ann -dimensional vectorz= (z1,. . .,zn), wherezi=AB,Ab,aB, orab, fori= 1,. . .,n. The sample configuration is given by the vectorn= (nAB,nAb,naB,nab) withnAB+nAb+naB+
nab=n.
Letz(t) be an ordered sample ofnindividuals chosen at randomwithout replacementat time stept $0. The proba-bility distribution of this sample will depend on the ancestral recombination-selection graph from time steptto time step 0, represented byG(t), and the type frequencies at time step 0, given byx(0). What will matter most is the suprageneal-ogy from time step t to time step 0. It is represented by sequence events backward in time written in the form
G¼ ðG1; . . . ;GmtÞ; (41) wheremtis the total number of events. These are events of
coalescence, recombination, or selection in one step back, either pure or multiple.
Let nG be the number of ancestors, real or virtual, after the occurrence of the last event ofGbackward in time. This
last event is assumed to take place at time backtG. On the other hand, the time withnGancestors is represented bytnG. For Gto be an admissible supragenealogy from time stept to time step 0, it is necessary thattG#t,tGþtnG. We define
GðtÞ ¼ fG;tG#t,tGþtnGg: (42)
Note that tG and tnG are independent random variables. Moreover,tnG is a geometric random variable with parame-terpnG, whiletGis a sum of independent geometric random variables.
The probability of the eventz(t) =z, givenx(0), can be expressed in the form
PðzðtÞ ¼zjxð0ÞÞ ¼X
GðtÞ
PðzðtÞ ¼zjGðtÞ;xð0ÞÞPðGðtÞÞ: (43)
The conditional probability in the summand of the above equation does not actually depend on time stept. Therefore, we define
PGðzjxð0ÞÞ ¼PðzðtÞ ¼zjGðtÞ;xð0ÞÞ: (44)
On the other hand, we have
PðGðtÞÞ ¼PðGÞPðtG#t,tGþtnGÞ; (45) where
PðGÞ ¼Y
mt
k¼1
PðGkÞ; (46)
with P(Gk) defined by (29)–(31) for pure events of coales-cence, recombination, or selection and by (32) for multiple events. Moreover, we have
PðtG#t,tGþtnGÞ ¼PðtGþtnG.tÞ2PðtG.tÞ: (47)
Note that
XN
t¼0
PðtG#t,tGþtnGÞ ¼EðtGþtnGÞ2EðtGÞ ¼EðtnGÞ:
(48)
Summing overt $0 in (43) yields the following result.
Proposition 4 Letz(t)be an ordered sample of n individuals chosen at random without replacement at time stept $0and
x(0)be the vector of the individual type frequencies at time step0. Then we have
XN
t¼0
PðzðtÞ ¼zjxð0ÞÞ ¼X
G
PGðzjxð0ÞÞPðGÞEðtnGÞ; (49)
where G is a sequence of pure or multiple events of coalescence,
recombination,or selection from time steptto time step0,nG
is the number of ancestors at time step0,andtnGis a time back
Actually the conditional probability ofz, givenGand
x(0), in Proposition 4 depends on the types of the nG or-dered ancestors at time step 0, represented byz(0), so that
PGðzjxð0ÞÞ ¼ X
zð0Þ
PGðzjzð0ÞÞPGðzð0Þjxð0ÞÞ: (50)
Moreover, we have
PGðzj zð0ÞÞ ¼ 0; (51)
ifzis incompatible withGandz(0). Otherwise, this condi-tional probability is 1 times a product of condicondi-tional proba-bilities of replacement, which is different from 1 only in the case of selection events inG. On the other hand,
PGðzð0Þjxð0ÞÞ ¼N2nGðNABð0ÞÞnABð0ÞðNAbð0ÞÞnAbð0Þ
·ðNaBð0ÞÞnaBð0ÞðNabð0ÞÞnabð0Þ;
(52)
where (N)n= N· (N21) ·. . . · (N2 n+ 1) denotes a falling factorial, while
Nxð0Þ ¼ ðNABð0Þ; NAbð0Þ; NaBð0Þ; Nabð0ÞÞ (53)
and
nð0Þ ¼ ðnABð0Þ; nAbð0Þ; naBð0Þ; nabð0ÞÞ (54)
represent the population configuration at time step 0 and the sample configuration ofz(0), respectively. Moreover, this sample satisfies
nABð0Þ þ nAbð0Þ þ naBð0Þ þ nabð0Þ ¼ nG; (55)
with the inequalities
nABð0Þ#NABð0Þ;
nAbð0Þ#NAbð0Þ;
naBð0Þ#NaBð0Þ;
nabð0Þ #Nabð0Þ;
which are necessary conditions for z(0) to be compatible with Gandx(0).
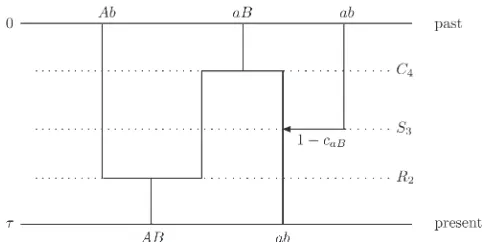
Consider, for instance, a sequence of events backward in time,G= (R2,S3,C4) for an ordered sample of sizen= 2, as
illustrated in Figure 2. Here we have a pure recombination event, a pure selection event, and a pure coalescence event, in this order backward in time. In the case of recombination, one lineage splits into two, a left lineage assumed to be ancestral at locus 1 and a right lineage assumed to be an-cestral at locus 2. In the case of selection, one lineage branches into two, a continuing lineage and a new incoming lineage, both potentially ancestral. And last, in the case of coalescence, two lineages merge. The probability of the whole sequence of events is
PðGÞ ¼PðR2ÞPðS3ÞPðC4Þ: (56)
Note that the number of ancestors increases by one following the recombination event and the selection event, but decreases by one following the coalescence event, so that the number of ancestors at the end isnG= 3. The time back to the last event,tG, can be expressed in the form
tG ¼ t2þt3 þt4; (57)
where t2, t3, and t4 are independent geometric random
variables with parameters p2, p3, and p4, respectively. On
the other hand, the time back spent withnGancestors,tnG, is a geometric random variable with parameter p3.
Finally, given thatG= (R2,S3,C4) andtG# t,tG+tnG,
the ordered samplez(t) = (AB,ab) occurs with probability 1 –caB, if the ancestral state at time step 0 isz(0) = (Ab,aB,
ab). The probability of this initial ancestral state given the initial type frequencies is
Pðzð0Þ¼ðAb;aB;abÞj xð0ÞÞ¼xAbð0ÞxaBð0Þxabð0Þð1þOðN21Þ:
(58)
Of course, we have to consider all possible initial ancestral states for this particular G and then all possible G for this particular ordered sample.
Approximation Results
We are now ready to approximate the probability of ultimate fixation ofAunder the assumptions that the population size is large and the population-scaled recombination and selec-tion parameters are small.
Considerz= (z1,z2), wherez1=ABorAbandz2=aBor
ab. First note that
Eðxz1ðtÞxz2ðtÞjxð0ÞÞ ¼ ð12N
21ÞPðzðtÞ ¼zjxð0ÞÞ; (59)
so that Proposition 4 leads to the expression
Ezðxð0ÞÞ ¼ ð12N21ÞX
G
PGðzjxð0ÞÞPðGÞEðTnGÞ; (60)
where TnG¼2tnGN22, for the quantity defined in Proposi-tion 2.
Let |G| denote the minimum number of ancestors along a sequence of eventsGfor the ordered samplez= (z1,z2).
Note that
PGðzj xð0ÞÞ ¼ 0; (61)
if |G| = 1, since allelesAinz1andainz2cannot have the
same ancestor, while
PGðz jx ð0ÞÞ#xAð0Þ; (62)
if |G|$2, since alleleAinz1must be present in at least one
ancestor. This leads to the inequality
Ezðxð0ÞÞ#xAð0ÞEðW2Þ; (63)
where
EðW2Þ ¼
X
fG:jGj$2g
PðGÞEðTnGÞ: (64)
Actually,W2is the time back in number ofN2/2 time steps
for the number of ancestors in the ancestral graph starting from a sample of size 2 to reach one for thefirst time. This occurs when the most recent ultimate ancestor (MRUA) is found. It can be shown thatE(W2) isfinite and bounded by
a constant that does not depend onN. This is also true for
E(Wn)$E(Wn–1), which is defined analogously for a sample
of any sizen$3. (SeeAppendix.)
Now, suppose that the population-scaled recombination and selection parameters,rands, are small and of the same order of magnitude, so thatr= ds,,1 for some constant
d . 0. Let nþG designate the sum of all increases in the number of ancestors along a sequence of events G for the ordered samplez= (z1,z2). IfnþG .k, then
G¼ ðGð1Þ; Gð2ÞÞ; (65) where G(1) is a sequence of events such that nþ
Gð1Þ.k and
nGð1Þ#kþ2. The numbernGð1Þ is the sample size at the
be-ginning ofG(2)just after thefirst increase in the number of
ancestors that brings this number abovek. Note that there is afinite number ofG(1)satisfying these conditions and that
the probability of each one can be neglected compared tosk; that is,
PðGð1ÞÞ ¼Oðskþ1Þ: (66) On the other hand,
X
fGð2Þ:jGð2Þj$2g
PðGð2ÞÞEðTnGð2ÞÞ#EðWkþ2Þ; (67)
which is a finite bound. Since P(G) = P(G(1))P(G(2)) and
nG¼nGð2Þ, we conclude that
X
fG:jGj$2;nþG.kg
PGðzjxð0ÞÞPðGÞEðTnGÞ#xAð0ÞO
skþ1: (68)
This gives the order of the error in the following approxi-mation result.
Proposition 5 Ignoring terms of order xA(0)O(slrm)for l +
m$k +1wherer= rN ands= sN are the population-scaled parameters for recombination and selection, respectively, the expected times in the probability of ultimatefixation of A given in Proposition2are approximated by
Ezðxð0ÞÞ ð12N21Þ X
fG:jGj$2;nþG#kg
PGðzjxð0ÞÞPðGÞEðTnGÞ;
(69)
forz=(z1,z2),with z1= AB,Ab and z2= aB,ab,where all
terms in the summation,given by (40), (46), and (50),are approximated by their leading terms in the case of a large population size. Here,the summation is over all sequences G of pure coalescence,recombination,or selection events back-ward in time with at most k pure recombination or selection events and a number of ancestors always larger than two with
final value nG.
Note that the coefficient ofslrmforl+m#kin Prop-osition 5 is obtained by considering all sequences of eventsG
involving up tolpure selection events andmpure recombi-nation events.
Using MATHEMATICA and (69), a polynomial of degree
kwith respect tosandrapproximating the quantity (23) in Proposition 2 for s and r small enough can be calcu-lated. This approach leads to the main results of this article.
Proposition 6 Consider the discrete-time Moran model with small population-scaled recombination fraction r = rN and small population-scaled intensity of selection s = sN with coefficients of selection 0#cAB,cAb,caB,cab#1such that e = cAB –cAb– caB + cab6¼ 0. Given the initial conditions in
Figure1with xA(0) =N–1and ignoring terms of order N–2or
N–1O(slrm)for l + m$4,the probability of ultimatefixation
of A is approximated by
uAðxð0ÞÞ 1
Nþ
s
2NðcAb2cabþexÞ
þ s2 12N
cAb2cabÞ2
þ exðcAB2caBþcAb2cab
þ 2ð12xÞðcaB2cabÞÞ
2 s3
24Nxð12xÞðcaB2cabÞ
2ð
cAb2cabþexÞ
þrs2e
432Nxð12xÞ
3ðcAB2cAbÞ þ2ðcaB2cabÞ
:
(70)
Proposition 7 Under the conditions of Proposition 6but in the case where the coefficients of selection satisfye= cAB2cAb
–caB+ cab=0and terms of order N–2orN21O(slrm)for l +
uAðxð0ÞÞ 1
Nþ
s
2NðcAb2cabÞ þ
s2
12NðcAb2cabÞ
2
2 s3
24Nxð12xÞðcAb2cabÞðcaB2cabÞ
2
2 s4
720NðcAb2cabÞ
cAb2cabÞ3
þ ðcaB2cabÞ2xð12xÞð8ðcAb2cabÞ
þ 7ðcaB2cabÞð122xÞÞ
þ19rs3
432Nxð12xÞðcAb2cabÞðcaB2cabÞ
2:
(71)
Discussion
Effect of selection at linked loci on the probability of
fixation of a single mutant allele
The conditional expected change in the frequency of an allele A in a two-locus, two-allele Moran model from one time step to the next as expressed in (15) can be interpreted [see (13)] as the current frequency ofAin the proportion of the population chosen to be replaced (here,N21) times its average excess in fitness (Fisher 1930). In this average ex-cess, the differences between the coefficients of selection of
A-bearing and a-bearing individuals have relative weights given by the products of the frequencies of the individual types. Proposition 2 says that the difference between the probability of ultimatefixation ofAand its initial frequency takes the same form with weights given by expected times with given pairs of individual types over all time steps. This corresponds to a projected average excess infitness (Lessard and Lahaie 2009).
The expected times in Proposition 2 depend on the population-scaled parameters, s=sNand r=rN, for the intensity of selection and the recombination fraction, respec-tively. As shown in Proposition 5, expansions inslrmforl+
m#kand a population sizeNlarge enough are obtained by considering up tokpure recombination or selection events in the ancestral recombination-selection graph of pairs of individuals chosen at random.
This has been applied to get analytical approximations for the probability of ultimatefixation of a single mutantA
introduced at random into a population in which a previous mutant B is segregating at another locus and has reached some frequency x. Here we make the assumptions of weak selection (s,,1), tight linkage (r,,1), and large pop-ulation size (N.. 1). In the case of positive or negative epistasis, thefirst-order effect of recombination on thefi xa-tion probability is of orderrs2. It is detected as soon as one
pure recombination event and one pure selection event are considered. This is best understood from the leading recom-bination terms when the single mutantAis initially linked to
B and LD is positive, which occurs with probability x, and
when it is the opposite, which occurs with the complemen-tary probability 1–x. In the case of coefficients of selection given bycab= 0,caB=cAb=c,cAB= 1 with 0#c#1, so thatAandBare equally advantageous, and epistasis given by e= 1–2c, these leading terms are approximated by
LBðrÞ 2
rs
24Nð12xÞð3þeÞ
þ rs2
864Nð12xÞðxð12eÞð24þ5eÞ þ3eð2þeÞ þ27Þ; LbðrÞ
rs
24Nxð3þeÞ
2 rs2
864Nxðxð12eÞð24þ5eÞ þeð1þ2eÞ þ27Þ;
respectively, which yields
LðrÞ ¼xLBðrÞ þ ð12xÞLbðrÞ
rs2
864Nxð12xÞeð5þeÞ;
for the weighted average in agreement with Proposition 6. We see that the primary effect of increasing the recombina-tion rate is to increase thefixation probability in the case of initial NLD, but the opposite happens in the case of initial PLD. In the case of initial average LE, the primary effects cancel out, while the weighted average of the secondary effects, obtained by taking into account one pure selection event in addition to one pure recombination event, is of the same sign as epistasis. In the absence of epistasis (e= 1–2c= 0), tertiary effects obtained by taking into account a sec-ond pure selection event have to be considered, and their weighted average is approximated by
LðrÞ 19rs
3
3456Nxð12xÞ;
according to Proposition 7. This expression is always positive and increases with the recombination rate. This confirms the HR effect when both mutants are advantageous and epistasis is absent (Hill and Robertson 1966).
that takes into account two pure selection events in the presence of epistasis is given by
LðrÞ r
17;280Nxð12xÞð95sþ100e
þ ð51244xÞesþ20e2
2 ð45234xÞe2s25ð122xÞe3sÞ:
Forsandesmall enough, this expression for the average leading recombination term is positive ife.–0.95s. More generally, it has been checked that this leading term when at most four pure recombination or selection events are taken into account is pos-itive ifeis larger than some negative value (see Figure 3).
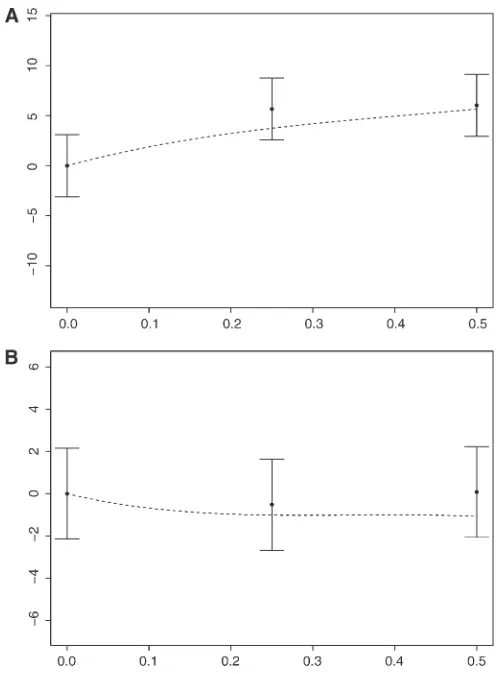
Therefore, our analytical approximations indicate that recombination increases the probability of ultimate fixation of beneficial mutants in the case of positive epistasis or weak negative epistasis, at least under weak enough selection. This is supported by simulations (see Figure 4A fore= 1). Even in the case of strong negative epistasis, an increase in the re-combination fraction may increase thefixation probability in a range of values of the recombination fraction (see Figures 3 and 4B fore=–1). This effect, though small, should provide some evolutionary advantage to recombination. This suggests that random drift may be an important factor in the evolution of recombination in the presence of selection.
Since negative epistasis is generally considered to be favorable to recombination in an infinite population, our conclusion that positive epistasis or weak negative epistasis, at least under weak selection, is a condition for recombina-tion to help ultimate fixation of beneficial mutants may appear surprising. Some numerical results for approxima-tions based on branching processes (Barton 1995b) and sim-ulations for modifiers of the recombination fraction (Otto and Barton 2001) obtained under the assumption of stron-ger selection (sN .. 1) suggested that this could be the case. However, this seems to have been little noticed up to now.
Note also that AE in an exactfinite population is modeled by multiplicative gene action on fitness. If advantageous mutants act additively and selection is weak, then epistasis is negative and weak. This is the situation that was actually simulated in Hill and Robertson (1966). However, compar-isons with results obtained under multiplicative selection showed no significant differences.
Conditions on the selection coefficients for recombination to be favored
In the presence of epistasis and assuming that allele B is advantageous, so that the coefficients of selection satisfy
cAB – cAb . 0 and caB – cab . 0, the coefficient of rs2 in
Figure 3 Contour plot of the derivative of the probability of ultimatefixation of
Awith respect tor, based on analytical approximations obtained by considering at most four selection or recombination events in the ancestry of samples of size 2. We consider the case where muta-tions are advantageous and mortalities of ab, aB,Ab, andABare given by 1, 1– csN21, 1– csN–1, and 1–sN–1, respectively. In this casee¼1–2c. Here we assume thats¼0.5 andx¼0.1. The values of the derivative are expressed in (100N)–1units. Regions with negative values indicate the parameter set for
the probability of ultimatefixation ofAgiven in Proposition 6, which is the leading recombination term under weak selection and low recombination, is positive if and only if
e=cAB–cAb–caB+cab.0; that is,cAB–cAb.caB–cab.0. This means thatAenhances the beneficial effect ofB. Under these circumstances, the probability of ultimatefixation ofA
increases as the recombination rate increases. Note, how-ever, that this does not require that alleleAitself is benefi -cial. It is favored to go tofixation as a result of a hitchhiking effect.
In the absence of epistasis, that is whene= 0, an approx-imation to the next order is necessary to detect the effect of recombination on the probability of ultimate fixation of A. Then the leading recombination term is given by the term in rs3 in Proposition 7, whose coefficient is positive if A is
advantageous, so thatcAb–cab=cAB–caB.0. Under this
condition, an increase of the recombination rate results in an increase of thefixation probability. This is in agreement with the HR effect when both mutants are advantageous (Hill and Robertson 1966). Note, however, that allele B does not have to be beneficial, since the sign ofcaB–cab=cAB–
cAbdoes not matter.
In both cases, the effect of recombination is more pro-nounced when the differences in the coefficients of se-lection are larger and when the frequency ofBis closer to
x=1 2.
The situation with deleterious mutants is comprised in the above discussion, since an allele is deleterious if and only if the alternate allele is advantageous. Therefore, the probability of ultimate fixation of an allele Adecreases as the recombination rate increases if this allele either is in positive epistatic interaction with a deleterious allele B or is itself deleterious in the case of no epistasis with B. This explains how recombination can reduce the rate at which the ratchet-like mechanism suggested by Muller (1964) slows down the rate of evolution.
Comparisons with previous results
In the absence of selection, the expected allele frequencies do not change and the probability of fixation of a gamete can be obtained from a transformation of a transition matrix (Karlin and McGregor 1968).
In the case where alleles Band bare neutral at locus 2 while allelesAandaare under selection at locus 1, so that
cAB–cAb=caB–cab= 0 andcAB–caB=cAb–cab= 1, there is no epistasis (e= 0). It follows from (71) that the probability of ultimate fixation of A when its initial frequency is the inverse of the population size, that isN21, is approximated by
uA
N21¼N21
1þs
2þ s2
122 s4
720þO
s5: (72)
It is easy to see that this is consistent with a Taylor expansion around s= 0 of the formula
uA
N21¼12e
2sN21
12e2s ; (73)
which is predicted from a diffusion approximation for allele frequencies at a single locus (Kimura 1957, 1962).
When selection acts on both loci, it is possible to use the Kolmogorov forward or backward diffusion equation for two-locus gamete frequencies (Kimura 1955) to approxi-mate the probability of ultiapproxi-mate fixation of a gamete and then that of an allele. The approximations obtained in this way up to the first-order effect of selection (Hill and Rob-ertson 1966; Ohta 1968) are consistent with Propositions 6 and 7.
Lehman and Rousset (2009) expressed the probability of ultimate fixation as a sum of expected changes in frequen-cies in an exact Wright–Fisher model and then considered Figure 4 (A and B) Simulation results for the effect of recombination on
the probability of ultimate fixation of Aassuming that mutations are advantageous with mortalities given by 1, 1 –csN–1, 1–csN–1, and 1–sN–1forab,aB,Ab, andAB, respectively, and corresponding epistasis
e¼1–2c. The values on they-axis show the mean difference between the number of times (in a block of 5·106runs) thatAwent tofixation compared to the case of no recombination. Means and 95% confidence intervals are calculated from 4·104blocks of runs for the case of positive epistasis (A fore¼1) and from 105trials for the case of negative epistasis (B fore¼–1). The dashed line shows the theoretical prediction based on our analytical approximations of thefixation probability. In this simulation
a Taylor expansion of this expression with respect to the intensity of selection. The coefficients in this expansion were obtained from a backward approach in a neutral model and symbolic calculation. An interpretation makes a clever use of matrix theory. Their approximation (A.34) for the reduction in the probability of ultimatefixation ofAdue to interfer-ence in the case of no epistasis is consistent with Proposi-tion 7 with the correspondences 2sA= (cAb–cab)sN–1, 2sB= (caB–cab)sN–1, 2r=rN–1, andpB(0) =x, ignoring terms of orderO(N–2). Therefore, the Moran and Wright–Fisher
mod-els lead to the same results after appropriate rescaling in the limit of a large population size.
One of the main interests in the approach based on the ancestral recombination–selection graph presented in this article is that the term in slrmin thefixation probability is known to come up when considering at mostl–1 selection events andmrecombination events in the supragenealogy of ordered sampled gametes backward in time to compute expected times in given states. The approach has been ap-plied to the probability of ultimatefixation of a single mu-tant allele at one locus in initial average linkage equilibrium with another segregating locus. It could be applied as well to an allele or a gamete given any initial conditions,e.g., a dou-ble mutant given an initial single doudou-ble mutant or two initial single mutants with mutants being deleterious when alone but beneficial when coupled as in simulations by Michalakis and Slatkin (1996). The results, however, would involve high-order polynomials with respect to the initial frequencies in the case of general initial conditions.
Implementation of the approach
The approximations given in Propositions 6 and 7 for the fixation probability rely on expected times in given ordered-sample states. These expected times are computed by conditioning on events of coalescence, recombination, or selection in the ancestry of the sample. Note that the calculation time can be shortened by considering only the material that is potentially ancestral to the original sample at either of the loci at every state change backward in time. Therefore, if the current number of ancestors at only one locus is n1and that of ancestors at both loci isn2, then the
total rate of change is
ln¼
nðn21þsÞ þn2r
2 ; (74)
wheren= (n1,n2) withn=n1+n2. This is the case since
a recombination event on an ancestral sequence will change the state of the ancestral material only if the sequence is ancestral at both loci.
Extensions to other models
The model considered in this article is a particular discrete-time viability model of the Moran type (Moran 1958) expressed in terms of probabilities of mortality that are lin-ear functions with respect to some intensity of selection.
This model was used to make as clear as possible the main ideas of the approach and to simplify as far as possible the rigorous justifications of the approximations. In the case of relative mortalities, for instance, the probabilities of replace-ment would generally be functions of any order with respect to the intensity of selection. Then Propositions 1 and 2 for the expected change in frequency and fixation probability for an allele would give only approximations up to terms of orderO(N–2). This would introduce technical details in the
limit of a large population size. Note, however, that a fertility model with the probability of replacement depending on the type of the offspring produced instead of the type of the individual chosen to be replaced could be analogously treated.
The Wright–Fisher model would introduce other kinds of difficulties. These are related to the possible number of ancestors in the exact ancestral recombination–selection graph and the expected time to reach the most recent ulti-mate ancestor. The analysis presented in the Appendix to justify the approach would have to be refined.
It is relatively easy to understand that the fixation probability in afinite population can be expressed in terms of expected times. It is less obvious to establish the corresponding result in the limiting process for an infinite population. Actually, (69) and (40) show that
Ez1;z2ðxð0ÞÞ Z N
0
Eðxz1ðtÞxz2ðtÞjxð0ÞÞdt; (75)
for z1 =AB, Abandz2=aB,ab, with timetmeasured in
number of N2/2 time steps, for a large enough population
sizeNand small enough population-scaled parametersrand s for recombination and selection, respectively. This sug-gests that thefixation probability corresponding to Proposi-tion 2 in the limiting AIG is given by the same expression but with integrals instead of sums.
Like those for the coalescent (Kingman 1982), the results obtained for the Moran model in the limit of a large popu-lation size are expected to be valid for a wide range of exchangeable models. This could be established by consid-ering an exact model extending the Cannings neutral model (Cannings 1974) to take into account not only selection (Lessard and Ladret 2007) but also recombination in the limit of a large population size. It could also be done by showing that thefixation probability obtained from a Kolmo-gorov backward or forward diffusion equation for gamete frequencies (Kimura 1955; Hill and Robertson 1966; Ohta 1968) takes the form given in Proposition 2 with expected values computed according to (75) in the corresponding AIG.
Acknowledgments
fixation of beneficial mutants. This research was supported in part by the Natural Sciences and Engineering Research Council of Canada.
Literature Cited
Barton, N. H., 1995a A general model for the evolution of recom-bination. Genet. Res. 65: 123–144.
Barton, N. H., 1995b Linkage and the limits to natural selection. Genetics 140: 821–841.
Barton, N. H., and S. P. Otto, 2005 Evolution of recombination due to random drift. Genetics 169: 2353–2370.
Bodmer, W. F., 1970 The evolutionary significance of recombi-nation in prokaryotes. Symp. Soc. Gen. Microbiol. 20: 279– 294.
Cannings, C., 1974 The latent roots of certain Markov chains arising in genetics: a new approach. I. Haploid models. Adv. Appl. Probab. 6: 260–290.
Crow, J. F., and M. Kimura, 1965 Evolution in sexual and asexual populations. Am. Nat. 99: 439–450.
Crow, J. F., and M. Kimura, 1969 Evolution in sexual and asexual populations: a reply. Am. Nat. 103: 89–91.
Donnelly, P., and T. G. Kurtz, 1999 Genealogical processes for Fleming-Viot models with selection and recombination. Ann. Appl. Probab. 9: 1091–1148.
Eshel, I., and M. W. Feldman, 1970 On the evolutionary effect of recombination. Theor. Popul. Biol. 1: 88–100.
Ewens, W. J., 1990 Population genetics theory—the past and the future, pp. 177–227 in Mathematical and Statistical
Develop-ments of Evolutionary Theory(NATO ASI Series C: Mathematical
and Physical Sciences, Vol. 299), edited by S. Lessard. Kluwer Academic Publishers, Dordrecht, The Netherlands.
Fearnhead, P., 2003 Ancestral processes for non-neutral models of complex diseases. Theor. Popul. Biol. 63: 115–130.
Fearnhead, P., R. M. Harding, J. A. Schneider, M. Myers, and P. Donnelly, 2004 Application of coalescent methods to reveal
fine-scale rate variation and recombination hotspots. Genetics 167: 2067–2081.
Feldman, M. W., and U. Liberman, 1986 An evolutionary reduc-tion principle for genetic modifiers. Proc. Natl. Acad. Sci. USA 83: 4824–4827.
Feldman, M. W., F. B. Christiansen, and L. D. Brook, 1980 Evolution of recombination in a constant environment. Proc. Natl. Acad. Sci. USA 77: 4838–4841.
Felsenstein, J., 1965 The effect of linkage on directional selection. Genetics 52: 349–363.
Felsenstein, J., 1974 The evolutionary advantage of recombina-tion. Genetics 78: 737–756.
Fisher, R. A., 1930 The Genetical Theory of Natural Selection. Clar-endon Press, Oxford.
Griffiths, R. C., and P. Marjoram, 1996 Ancestral inference from samples of DNA sequences with recombination. J. Comput. Biol. 3: 479–502.
Griffiths, R. C., and P. Marjoram, 1997 An ancestral recombina-tion graph, pp. 257–270 inProgress in Population Genetics and
Human Evolution(IMA Volumes in Mathematics and Its
Appli-cations, Vol. 87), edited by P. Donnelly and S. Tavaré. Springer-Verlag, Berlin.
Grimmett, G. R., and D. R. Stirzaker, 1982 Probability and
Ran-dom Processes. Oxford University Press, New York.
Hill, W. G., and A. Robertson, 1966 The effect of linkage on limits to artificial selection. Genet. Res. 8: 269–294.
Hudson, R. R., and N. L. Kaplan, 1988 The coalescent process in models with selection and recombination. Genetics 120: 831– 840.
Karlin, S., 1973 Sex and infinity: a mathematical analysis of the advantages and disadvantages of genetic recombination, pp. 155–194 inThe Mathematical Theory of the Dynamics of
Biolog-ical Populations, edited by M. S. Bartlett and R. W. Hiorns.
Academic Press, London.
Karlin, S., and J. McGregor, 1968 Rates and probabilities offi xa-tion for two locus random mating finite populations without selection. Genetics 58: 141–159.
Karlin, S., and H. M. Taylor, 1975 A First Course in Stochastic
Processes, Ed. 2. Academic Press, New York.
Kimura, M., 1955 Stochastic processes and distribution of gene frequencies under natural selection. Cold Spring Harbor Symp. Quant. Biol. 20: 33–55.
Kimura, M., 1957 Some problems of stochastic processes in ge-netics. Ann. Math. Stat. 28: 882–901.
Kimura, M., 1962 On the probability offixation of mutant genes in a population. Genetics 47: 713–719.
Kingman, J. F. C., 1982 The coalescent. Stoch. Proc. Appl. 13: 235–248.
Krone, S. M., and C. Neuhauser, 1997 Ancestral processes with selection. Theor. Popul. Biol. 51: 210–237.
Larribe, F., and P. Fearnhead, 2011 Composite likelihood meth-ods in statistical genetics. Stat. Sin. 21: 43–69.
Larribe, F., and S. Lessard, 2008 A composite-conditional-likelihood approach for gene mapping based on linkage disequilibrium in windows of marker loci. Stat. Appl. Genet. Mol. Biol. 7(1): 27. Lehman, L., and F. Rousset, 2009 Perturbation expansions of mul-tilocusfixation probabilities for frequency-dependent selection with applications to the Hill-Robertson effect and to the joint evolution of helping and punishment. Theor. Popul. Biol. 76: 35–51.
Lenormand, T., and S. P. Otto, 2000 The evolution of recombina-tion in a heterogeneous environment. Genetics 156: 423–438. Lessard, S., and V. Ladret, 2007 The probability of fixation of
a single mutant in an exchangeable selection model. J. Math. Biol. 54: 721–744.
Lessard, S., and P. Lahaie, 2009 Fixation probability with multiple alleles and projected average allelic effect on selection. Theor. Popul. Biol. 75: 266–277.
Maynard Smith, J., 1968 Evolution in sexual and asexual popu-lations. Am. Nat. 102: 469–473.
McVean, G., P. Awadalla, and P. Fearnhead, 2002 A coalescent-based method for detecting and estimating recombination from gene sequences. Genetics 160: 1231–1241.
Michalakis, Y., and M. Slatkin, 1996 Interaction of selection and recombination in thefixation of negative-epistatic genes. Genet. Res. Camb. 67: 257–269.
Möhle, M., and S. Sagitov, 2001 A classification of coalescent pro-cesses for haploid exchangeable population models. Ann. Pro-bab. 29: 1547–1562.
Moran, P. A. P., 1958 Random processes in genetics. Proc. Camb. Philos. Soc. 54: 60–71.
Muller, H. J., 1932 Some genetic aspects of sex. Am. Nat. 66: 118–138.
Muller, H. J., 1964 The relation of recombination to mutational advance. Mutat. Res. 1: 2–9.
Neuhauser, C., and S. M. Krone, 1997 The genealogy of samples in models with selection. Genetics 145: 519–534.
Ohta, T., 1968 Effect of initial linkage disequilibrium and epistasis onfixation probability in a small population, with two segregat-ing loci. Theor. Appl. Genet. 38: 243–248.
Otto, S. P., and N. H. Barton, 1997 The evolution of recombina-tion: removing the limits to natural selection. Genetics 147: 879–906.
Otto, S. P., and M. W. Feldman, 1997 Deleterious mutations, vari-able epistatic interactions and the evolution of recombination. Theor. Popul. Biol. 51: 134–147.
Pitman, J., 1999 Coalescents with multiple collisions. Ann. Pro-bab. 27: 1870–1902.
Rousset, F., 2003 A minimal derivation of convergence stability measures. J. Theor. Biol. 221: 665–668.
Sagitov, S., 1999 The general coalescent with asynchronous mergers of ancestral lines. J. Appl. Probab. 36: 1116– 1125.
Stephens, M., and P. Donnelly, 2003 Ancestral inference in pop-ulation genetics models with selection. Aust. N. Z. J. Stat. 45: 395–430.
Wakeley, J., and O. Sargsyan, 2009 The conditional ancestral se-lection graph with strong balancing sese-lection. Theor. Popul. Biol. 75: 355–364.
Yu, F., and A. Etheridge, 2010 The fixation probability of two competing beneficial mutations. Theor. Popul. Biol. 78: 36–45.
Communicating editor: L. M. Wahl
Appendix: Bound for the Expected Time to Reach the Most Recent Ultimate Ancestor
Consider the Markov chain describing the number of ancestors in the ancestral recombination–selection graph backward in time for an ordered sample in a population of sizeN. Fors=sNandr=rNsmall enough, the probabil-ities of transitionpi,j, fromitojfori,j= 1,. . .,N, satisfy the inequalities
pi;i21 $
iði21Þ
N2
12s
N
12r
N
$ iði21Þ
2N2 ; (A1)
pi;iþ1 #
iðsþrÞ N2 #
i
12N2; (A2)
and
pi;iþ2 #
isr N3 #
i
12N2: (A3)
The lower bound comes from the probability of a pure coalescence event, and the upper bounds come from the probability of a recombination event and/or a selection event. Moreover, we have
pi;i¼12pi;i212pi;iþ12pi;iþ2; (A4)
sincepi,j= 0 ifj,i–1 or j.i+ 2.
The sojourn time in statei$2 in number of time steps is a geometric random variable of parameter 1 – pi,i, whose expected value is
12pi;i
21
# 2N2
iði21Þ#N
2:
(A5)
In number ofN2/2 time steps, the upper bound is 2.
There-fore, the time in number ofN2/2 time steps to reach state 1
for the first time from state i $2, denoted byWi, has an expected value satisfying
EðWiÞ # 2EðMiÞ; (A6)
where Mi is the number of state changes before reaching state 1 for thefirst time from statei.
Given that the chain leaves statei $2, the conditional transition probabilities satisfy
qi;iþ1¼
pi;iþ1
12pi;i
# 2
12ði21Þ # 1
6; (A7)
qi;iþ2¼
pi;iþ2
12pi;i
# 2
12ði21Þ # 1
6; (A8)
and
qi;i21¼
pi;i21
12pi;i
¼12qi;iþ12qi;iþ2 $
2
3: (A9)
Let {Xn}n$0be a Markov chain on the integersi$1 withqi,j above as transition probabilities for i $ 2 and state 1 ab-sorbing. Such a Markov chain can be constructed from a se-quence of independent random variables {Un}n$1, each one
being uniformly distributed on (0, 1]. Given Xn–1=i$2,
thenth increment forn$1 is defined as
Xn2Xn21¼2Ið0;qi;iþ2ðUnÞ þIðqi;iþ2;12qi;i21ðUnÞ2Ið12qi;i21;1ðUnÞ;
(A10)
where I(a,b](u) = 1 if a ,u #b and 0 otherwise.
Analo-gously, givenYn–1=i$2, define
Yn2Yn21¼2Ið0;1=6ðUnÞ þIð1=6;1=3ðUnÞ2Ið1=3;1ðUnÞ:
(A11)
In both cases, the increment is 0 if the current state is 1. Moreover, givenX0=Y0=i$2, we have
Xn¼X0þ
Xn
k¼1
ðXk2Xk21Þ#Y0þ
Xn
k¼1
ðYk2Yk21Þ ¼Yn;
(A12)
forn$1. In particular,
PðXn.1jX0¼iÞ#PðYn.1jY0¼iÞ; (A13)