Anomaly Detection in Sensor Data Using
Unsupervised Machine Learning
K. Jaya Naga Ramya1, Dr. M Sampath Kumar2
M.Tech, Dept. of CS&SE, Andhra University, Visakhapatnam, AP, India1
Associate Professor, Dept. of CS & SE, Andhra University, Visakhapatnam, AP, India2
ABSTRACT: Pervasive sensing is one of the most prominent technologies being adapted by current process industry. Every process industry is highly equipped with wireless sensors for process monitoring in which locations human intervention need to be limited. Thus, major challenge with these numerous sensors is store and analyzes large volume of sensor data stream. This paper focus on sensor data analysis along with anomaly detection specific to process sector because the placement and nature of the data generated from these sensors follows a specific pattern during process flow. This data is more structured unlike other type of big data in which data is more unstructured. No assurance that any single algorithm can produce optimized results. So, this paper presenting a generic frame works with ensemble of methods such as probability and statistics, Neural Networks and Clustering. Here Neural Net is supervised learning model to predict new data based on trained data. But unseen data is wrongly predictable by neural nets. For that clustering is used as unsupervised learning model to efficiently handle concept drifts in sensor data stream. These solutions are implemented to various data scenarios with practical means to improve prediction and anomaly detection accuracy of equipment as well as process flows. Best of our knowledge no single framework is available to fully analyse sensor data stream related to independent, correlation based, group wise with respect to process flow segmentation and process and sub process hierarchy analysis.
KEYWORDS: Principal Component Analysis, Wireless sensor Network, Support Vector Machine, Ad Hoc Networks
I. INTRODUCTION
mining and machine learning fields is similarity measure [7]. The majority of data vectors with high similarity represents the normal behaviour of the given data vectors. Use of such similarity measure avoids making any assumption on statistical distribution of data as well as saves on expensive computational and memory complexity of data distribution estimation. For multivariate sensor data, modelling the normal behaviour of data precisely needs taking sensor data correlations into account [8]. In reality sensor data attributes are often correlated, e.g., ambient temperature has certain correlation with relative humidity. Observations indicate that when the air is warmer it can hold more humidity [4]. In this way, the correlated sensor data vectors are not distributed around the center of mass in a spherical manner, instead their distribution has an ellipsoidal shape [6]. The direction of the formed ellipsoid reveals the multivariate nature of data distribution trend as well as the strength of the correlation between data attributes.
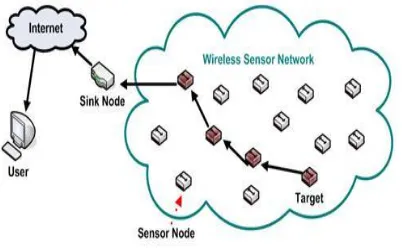
Fig 1. Wireless Sensor Networks
II. FUNDAMENTALS OF OUTLIER DETECTION
This section describes fundamentals of outlier detection in WSNs, including definitions of outliers, various causes of outliers, motivation of outlier detection, and challenges of outlier detection in WSNs.
A. What is an Outlier?
The term outlier, also known as anomaly, originally stems from the field of statistics [9]. The two classical definitions of outliers are:
(Hawkins [10]): “an outlier is an observation, which deviates so much from other observations as to arouse suspicions that it was generated by a different mechanism”.
(Barnett and Lewis [11]): “an outlier is an observation (or subset of observations) which appears to be inconsistent with the remainder of that set of data”.
In addition, a variety of definitions depending on the particular method outlier detection techniques are based upon exist [12]. Each of these definitions signify the solutions to identify outliers in a specific type of data set.
In WSNs, outliers can be defined as, “those measurements that significantly deviate from the normal pattern of sensed data” [13]. This definition is based on the fact that in WSN sensor nodes are assigned to monitor the physical world and thus a pattern representing the normal behaviour of sensed data may exist. Potential sources of outliers in data collected by WSNs include noise and errors, actual events, and malicious attacks. Noisy data as well as erroneous data should be eliminated or corrected if possible as noise is a random error without any real significance that dramatically affects the data analysis [14]. Outliers caused by other sources need to beidentified as they may contain important information about events that are of great interest to the researchers.
B. Motivation of Outlier Detection in WSNs
weather prediction, etc [13]. Recently, the topic of outlier detection in WSNs has attracted much attention. According to potential sources of outliers as mentioned earlier, the identification of outliers provides data reliability, event reporting, and secure functioning of the network. Specifically, outlier detection controls the quality of measured data, improves robustness of the data analysis under the presence of noise and faulty sensors so that the communication overhead of erroneous data is reduced and the aggregated results are prevented to be affected. Outlier detection also provides an efficient way to search for values that do not follow the normal pattern of sensor data in the network. The detected values consequently are treated as events indicating change of phenomenon that are of interest. Furthermore, outlier detection identifies malicious sensor
Fig 2: Three outlier sources in WSNs and their corresponding detection techniques
that always generate outlier values, detects potential network attacks by adversaries, and further ensures the security of the network. Here, we exemplify the essence of outlier detection in several real-life applications.
• Environmental monitoring, in which sensors such as temperature and humidity are deployed in harsh and unattended regions to monitor the natural environment. Outlier detection can identify when and where an event occurs and trigger an alarm upon detection.
• Habitat monitoring, in which endangered species can be equipped with small non-intrusive sensors to monitor their behaviour. Outlier detection can indicate abnormal behaviours of the species and provide a closer observation about behaviour of individuals and groups.
• Health and medical monitoring, in which patients are equipped with small sensors on multiple different positions of their body to monitor their well-being. Outlier detection showing unusual records can indicate whether the patient has potential diseases and allow doctors to take effective medical care.
• Industrial monitoring, in which machines are equipped with temperature, pressure, or vibration amplitude sensors to monitor their operation. Outlier detection can quickly identify anomalous readings to indicate possible malfunction or any other abnormality in the machines and allow for their corrections.
• Target tracking, in which sensors are embedded in moving targets to track them in real-time. Outlier detection can filter erroneous information to improve the estimation of the location of targets and also to make tracking more efficiently and accurately.
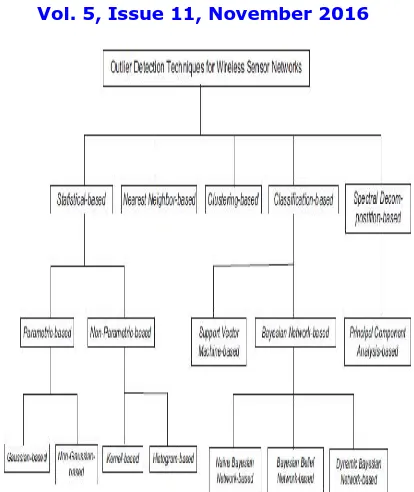
Fig 3: Taxmony of outline detection techniques for WSN
III. ANOMALY DETECTION
Anomaly is defined as an observation that deviates too much from other observations. The identification of anomalies can lead to the discovery of useful and meaningful knowledge and has a number of practical applications in areas such as transportation, ecology, public safety, public health, climatology, and location based services. Jingke Xi has presented anomalies into two categories viz. classic anomaly approach and spatial anomaly approach. The classic anomaly approach analyzes anomaly based on transaction dataset, which can be grouped into statistical-based approach, distance-based approach, deviation-based approach, density-based approach. The spatial anomaly approach analyzes anomaly based on spatial dataset, which can be grouped into space based approach, graph-based approach. Thirdly, they conclude some advances in anomaly detection recently.
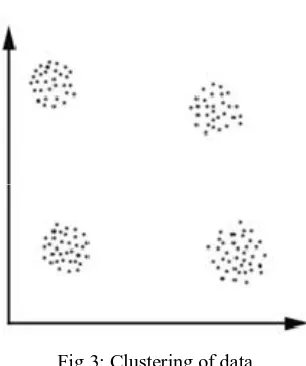
Clustering based Anomaly Detection
Fig 3: Clustering of data
Causes: Anomalies can have many anomalous causes. A physical apparatus for taking measurements may have suffered a transient malfunction. There may have been an error in data transmission or transcription. Anomalies arise due to changes in system behavior, fraudulent behavior, human error, instrument error or simply through natural deviations in populations. A sample may have been contaminated with elements from outside the population being examined. Alternatively, an anomaly could be the result of a flaw in the assumed theory, calling for further investigation by the researcher. Additionally, the pathological appearance of anomalies of a certain form appears in a variety of datasets, indicating that the causative mechanism for the data might differ at the extreme end (King effect).
There is no rigid mathematical definition of what constitutes an anomaly; determining whether or not an observation is an anomaly is ultimately a subjective exercise. Anomaly detection has been used for centuries to detect and, where appropriate, remove anomalous observations from data. Anomaly detection can identify system faults and fraud before they escalate with potentially catastrophic consequences. The original anomaly detection methods were arbitrary but now, principled and systematic techniques are used, drawn from the full gamut of computer science and statistics. There are three fundamental approaches to the problem of anomaly detection:
Type 1 - Determine the anomalies with no prior knowledge of the data. This is essentially a learning approach analogous to unsupervised clustering. The approach processes the data as a static distribution, pinpoints the most remote points, and flags them as potential anomalies.
Type 2 - Model both normality and abnormality. This approach is analogous to supervised classification and requires pre-labeled data, tagged as normal or abnormal.
Type 3 - Model only normality (or in a few cases model abnormality). This is analogous to a semi-supervised recognition or detection task. It may be considered semisupervised as the normal class is taught but the algorithm learns to recognize abnormality.
IV. METHODOLOGY
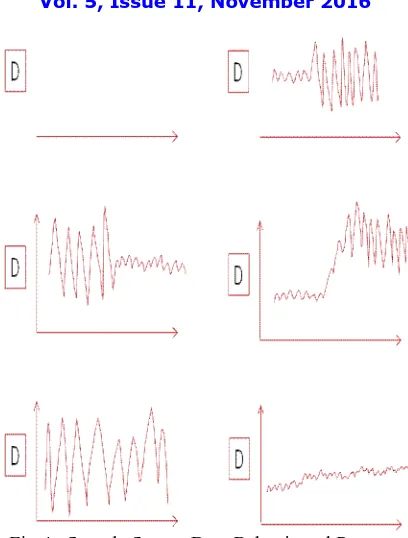
Fig 4. Sample Sensor Data Behavioural Patterns
To find the correct behaviour of any sensor or related equipment there is need to find "steady state". Steady state is an operating mode of equipment in which that equipment has fewer fluctuations in its working behaviour. But it is not easy to find right steady state behaviour of equipment. It is fully depend on the placement of equipment in process flow. It is easy to identify steady state in sensor data but difficult to identify correct steady state variance in it because same sensor show different steady state variance at different times based on the plant operation or depreciation in equipment or influenced by other equipment's behaviour. Among those steady state variances we need to find which one is the most frequent steady state variance. This is only possible based on history but not on single snapshot or single window or sliding windows for period of time. One more problem is each sensor is having different ranges of values and thus steady state variance levels. Without identifying correct steady state threshold, equipment behaviour can't be predicated in online analysis. But it is difficult to specify single steady state threshold to all the equipments.
Identify the steady state in off-line analysis requires various factors. Firstly, we need to identify whether the part is idle or active or in shut down state. To know this one trigger equipment is required. Trigger equipment means if this equipment is in active position then the other equipment which are dependent on this equipment must also in active position or vice versa. But this is not universal rule for all equipment. Because some equipment might maintain their state independent from trigger components. Some equipments change their behaviour gradually. There are two possibilities in this case. If the equipment is in starting position then it changes its behaviour from rest or starting position to steady state. Other case is in its operation. This case is significant because equipment is not changing its behaviour all of sudden. It is taking some time to shift from one range of variance to other level of range. Similarly equipment's right steady state range may also change based on time i.e. if it is a new equipment then its initial steady state range may be change after six months or later. According to the data stream theory it is called concept drift. So proposed model must identify that change and produce the results accordingly.
a. Consider initial variance threshold and variance difference threshold.
b. Calculate running variance and variance difference between current and previous variance. c. Calculate slope from current value to previous value to identify sudden or gradual increase. d. Group the values if their running variance is less than variance threshold
f. Find the mean and slope in current group to identify gradual increase in equipment behaviour within the same steady state group. but actually this not steady state group. So ignore that group.
g. Now create new group h. Reset running variance
i. Increase or decrease the variance and variance threshold j. Repeat steps 2 to 9 till end of data
k. Now find the intra group variance of all the groups
l. Find the frequent variance threshold and longest steady state group variance threshold.
m. Store high frequent and lengthy steady state thresholds for the sensor in the database and this will be used for online analysis.
V. RESULTS
Here we load input data set and its corresponding signature file. We specify the output folder where the result has to be stored. Distance threshold and deviation threshold are the tuning parameter for cluster radius and tolerance parameter for anomalous reading.
Based on the data obtained after processing, a graph is drawn using actual sensor value represented using a blue line, observed value represented by a red line, and the deviation% of actual from the predicted.
-20 -10 0 10 20 30 40
0 0.5 1 1.5 2 2.5 3 3.5 4
1 6 1116212631364146
11MBD11 CY102&X Q01_PRED
VI. CONCLUSION
This paper focuses on sensor data analysis along with anomaly detection in partial related to process sector to cater their needs. According to this study we developed various scenarios for various behavioural patterns. Sensor data analysis in normal areas such as whether forecasting is different from process sector in which there is inter dependency among various sensors. Those sensors are also high in volume. For that purpose a genetic framework is developed using predictive analytics. Experimental results show the analysis results. Query time complexity is only 0.06sec even for millions of records. We applied the above mentioned methods on 6 months data of a process plant. Due to sensitivity of the data we hide the plant information. This work can be extended to improve the anomaly detection process by incorporating ensemble and data stream mining techniques. Further fine tune the given techniques to specific process industries such as Chemical, Pharmacy, Food Processing, Automobile Manufacturing industries.
REFERENCES
[1] I.F. Akyildiz, W. Su, Y. Sankarasubramaniam, E. Cayirci, A survey on sensor networks, IEEE Communications Magazine 40 (2002) 102–114. [2] C.F. Garcia-Hernandez, P.H. Ibarguengoytia-Gonzalez, J. Garcia- Hernandez, J.A. Perez-Diaz, Wireless sensor networks and applications: a survey, International Journal of Computer Science and Network Security 7 (2007) 264–273.
[3] T. Arampatzis, J. Lygeros, S. Manesis, A survey of applications of wireless sensors and wireless sensor networks, in: Proceedings of the 13rd Mediterranean Conference on Control and Automation, Limassol, Cyprus 2005, pp. 719–724.
[4] V. Chandola, A. Banerjee, V. Kumar, Anomaly detection: a survey, ACM Computing Surveys 41 (2009) 1–58.
[5] Y. Zhang, N. Meratnia, P.J.M. Havinga, Outlier detection techniques for wireless sensor network: a survey, IEEE Communications Surveys & Tutorials 12 (2010) 159–170.
[6] P. Kelly, An Algorithm for Merging Hyperellipsodial Clusters, Technical report, Los Alamos National Laboratory, 1994.
[7] D. Wang,D.S. Yeung, E.C.C. Tsang, Structured one-class classification, IEEE Transactions on System, Man and Cybernetics 36 (2006) 1283– 1295.
[8] P.N. Tan, M. Steinback, V. Kumar, Introduction to Data Mining, Addison Wesley, 2006.
[9] V. Hodge and J. Austin, A Survey of Outlier Detection Methodologies, Artificial Intelligence Review, Vol. 22, pp. 85-126, 2003. [10] D.M. Hawkins, Identification of Outliers, London: Chapman and Hall, 1980.
[11] V. Barnett and T. Lewis, Outliers in Statistical Data, New York: John Wiley Sons, 1994.
[12] Y. Zhang, N. Meratnia, and P.J.M. Havinga, A Taxonomy Framework for Unsupervised Outlier Detection Techniques for Multi-Type Data Sets, Technical Report, University of Twente, 2007.
[13] V. Chandola, A. Banerjee, and V. Kumar, Anomaly Detection: A Survey, Technical Report, University of Minnesota, 2007. [14] P.N. Tan, M. Steinback, and V. Kumar, Introduction to Data Mining, Addison Wesley, 2006.
[15] J. Han and M. Kamber, Data Mining: Concepts and Techniques, Morgan Kaufmann, San Francisco, 2006.
BIOGRPHY
K. Jaya Naga Ramya pursuing her M.Tech in the department of Computer Science and Systems Engineering, Andhra University, Visakhapatnam, AP, India. She obtained her B.Tech(CSE) from JNTU Kakinada.