Static Voltage Stability Analysis Using PSAT
Tejaswini Gawande1, Komal Kaur Khokhar1, Naveen Verma1, Tushar Sahare1, Bhupesh Metangale1, Naved Bakhtiyar1, Dr.Altaf Badar2
Student, Dept. of EE, Anjuman College of Engineering and Technology, Sadar, Nagpur, Maharashtra, India1
Assistant Professor, Dept. of EE, Anjuman College of Engineering and Technology, Sadar, Nagpur, Maharashtra,
India2
ABSTRACT: Power System may lose stability and cause blackout when operating under loaded condition. In order to protect the power system it becomes essential to predict and identify the voltage instability. This paper presents the analysis of static voltage stability using continuation power flow method considering the power system contingencies and its effect on Mega Watt Margin (MWM) and maximum loading point (MLP). The weak bus in the system is identified by using contingencies ranking. On the basis of MWM percentage decrease, ranking of the system is done. IEEE 6 and IEEE 30 are simulated using PSAT to verify the results.
KEYWORDS: Voltage collapse, voltage stability, megawatt margin, maximum loading point.
I. INTRODUCTION
The increasing demand of electricity results into overloaded condition of the system. The overloaded condition leads the system to operate in unstable condition. In unstable condition voltages of the buses decreases and can cause voltage collapse [1]. It is a phenomenon that causes severe changes in the power system hence voltage stability analysis becomes necessary. Analysis of voltage stability is also essential from the power system protection point of view [2-3]. Continuation power flow (CPF) is the main analysis tool used for the IEEE 6 and IEEE 30 bus system. CPF technique involves the use of predictor and corrector step for analysing static voltage stability [4]. In this paper, for the analysis of static voltage stability maximum loading point (MLP) and megawatt margin (MWM) are used. Contingency analysis is important factor while considering the power system protection [5]. Operation of system under no contingency gives maximum loading point and maximum megawatt margin. Continuation power flow method is implemented on IEEE 6 and IEEE 30 bus systems for the computation of MLP and its corresponding decrease in MWM.
Contingency ranking is obtained by using percentage decrease in MWM [6]. On the basis of ranking system effect of contingencies on the test system and proximity towards voltage collapse can be determined. As a result, weak bus in the system can be determined and corrective action can be taken out before system collapse. Contingency identification can be done by using channel component theorem [7]. Contingency ranking is done by using artificial neural method, using line stability index method and performance index method [8-10]. Exact and precise method can be used to rank the contingency of power system [11]. Analysis of contingency ranking gives the idea about corrective measure that can be taken before system gets collapse [12]. FACTS devices can be used to enhance voltage stability during contingency [13].
II. STATIC VOLTAGE STABILITY AND RANKING CONTINGENCIES
Static voltage stability includes slowly occurring changes in the system which results into the insufficient supply of reactive power and the voltage drop in the buses. This can be determined from V – λ curve which gives proximity
towards voltage collapse. The V – λ curve shows that increase in loading factor (λ) reduces the voltage at receiving end
Continuation power flow method is used to rank power system contingency. In the contingency analysis, maximum loading point and corresponding decrease in percentage of MWM is computed. Contingencies ranking is done by arranging the MLP in ascending order and its corresponding MWM decrease in decreasing order. Contingency having lower MLP and higher percentage change in MWM is ranked higher than other contingencies. The values of MMWM and MWM are calculated as:
MMWM = P imax-P base
MWM = P i+1max - P base
where, P max is maximum load active power corresponding with MLP and P base is base load active power.
The MWM decrease percent is calculated as: MWM decrease percent = 100 × [1-( )]
The number of contingencies in the power system depends upon the number of elements subjected to failure. For the event number of L with NCL: L=0,1,2,…,
NCL =
!
! ( )!
NC0 means no element is exposed to failure in the system called as zero level contingency. First level contingency
NC1means only one unique element is subjected to failure. Usually, first and second number of contingency is taken
into account. In this paper zero and first level contingency are considered. NC0,1= 1+N.
III. SIMULATION RESULTS
The line and bus data for IEEE 6 and 30 bus systems are taken from case6ww and case 30 in Matpower 5.1. The P and Q load powers are voltage independent and its changes can be assumed as:
PL= PL0(1+λ) &QL=QL0(1+λ)
Where, PL0 and QL0 are the active and reactive base loads and PL and QLare the active and reactive loads at bus L for
the operating point is given by λ.
A. IEEE 6 bus system
Continuation power flow is executed on IEEE 6 bus system with no contingency, maximum loading point λmaxis
obtained as 3.3208.The base load active power which is the summation of total active power at the buses during no contingency is computed as 2.94p.u. The maximum load active power is the summation of total active power at the buses during contingency is 6.9735p.u.
(01) SINGLE GENERATION UNIT OUTAGES
In single generation unit outage contingency the values obtained are tabulated in table 1. In generation unit outage the bus number with lowest voltage magnitude is specified with loading factor, real and reactive power in the table 1.
Table 01 GENERATION UNIT OUTAGES
Generation unit outage
Bus no. with lowest voltage magnitude
Magnitude of lowest voltage in MLP(p.u)
λmax (p.u)
Pload (p.u)
Qload (p.u)
No contingency 5 0.5603 3.3208 2.3245 2.3245
Bus 2 4 0.6127 2.2893 1.6025 1.6025
Bus 3 6 0.5334 2.2179 1.5525 1.5525
Table 02 MWM and %MWM FOR GENERATION UNIT OUTAGES
The values obtained of percentage decrease in MWM are tabulated in table 3. In generation unit outage for bus 3 having λ=2.2179 and MWM % decrease= 57.42 is identified as critical contingency among the remaining contingency of generation unit outage and it is tabulated in table 3
.
Table 03 CONTINGENCIES RANKING OF SINGLE GENERATION UNIT OUTAGES
In generation unit outage connected tobus 3 ismarked as critical contingency in the system. Similarly other generator outages are ranked on the basis of MWM percentage decrease, given in table 3.
(02) LINE OUTAGES
In line unit outage values obtained are tabulated in table 4.The bus number with lowest voltage magnitude is specified with loading factor in the table.
Table 04 SINGLE LINE UNIT OUTAGES
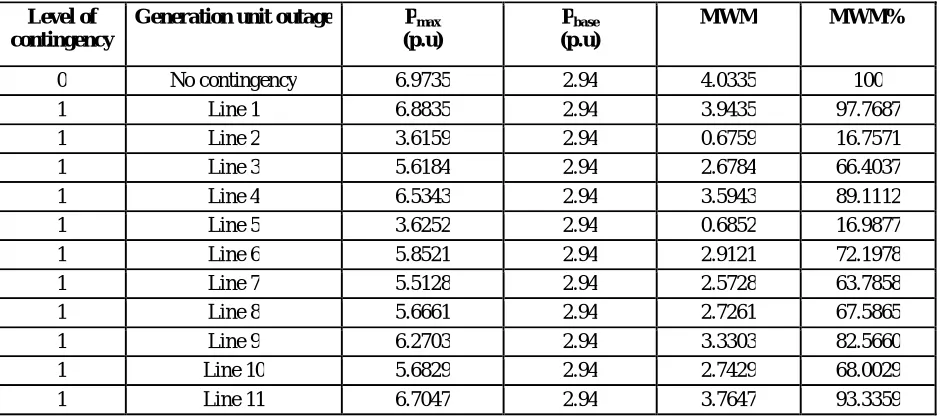
The result obtained of MWM during zero level contingency is 4.0335. The values obtained of MWM and MWM% is tabulated in the table 5.
Level of contingency
Generation unit outage Pmax (p.u)
Pbase (p.u)
MWM MWM%
0 No contingency 6.9735 2.94 4.0335 100
1 Bus 2 4.8075 2.94 1.8675 46.2997
1 Bus 3 4.6575 2.94 1.7175 42.5808
Rank of the contingency Generation unit outage λmax(p.u) Percentage decrease in MWM
1 Bus 3 2.2179 57.42
2 Bus 2 2.2893 53.70
Outage line Bus no with lowest voltage magnitude
Magnitude of lowest voltage in MLP (p.u)
λmax (p.u)
No contingency 5 0.5603 3.3208
Line 1 5 0.5617 3.2778
Line 2 6 0.6659 1.7218
Line 3 5 0.5085 2.6754
Line 4 5 0.5315 3.1116
Line 5 4 0.6599 1.7263
Line 6 5 0.6874 2.7867
Line 7 4 0.5859 2.6251
Line 8 5 0.5233 2.6981
Line 9 5 0.5785 2.9859
Line 10 5 0.4778 2.7062
Table 05 MWM and %MWM FOR LINE UNIT OUTAGES
In line unit outage, line 2 connected between bus 3 and 6 having λ= 1.7218 and MWM % decrease= 83.24 is identified as critical contingency among the remaining contingencies of line unit outages and it is tabulated in table 6.
Table 06 CONTINGENCIES RANKING OF SINGLE LINE UNIT OUTAGES
In line unit outage, line 2 connected to bus 3 and 6 ismarked as critical contingency in the system. Similarly other lines are ranked on the basis of MWM percentage decrease, given in table 6.
B. IEEE 30 bus system
Continuation power flow is executed on IEEE 30 bus system with no contingency, maximum loading point λmaxis
obtained as 5.5171. The base load active power which is the summation of total active power at the buses during no contingency is computed as 2.6488 p.u. The maximum load active power is the summation of total active power at the
Level of contingency
Generation unit outage Pmax (p.u)
Pbase (p.u)
MWM MWM%
0 No contingency 6.9735 2.94 4.0335 100
1 Line 1 6.8835 2.94 3.9435 97.7687
1 Line 2 3.6159 2.94 0.6759 16.7571
1 Line 3 5.6184 2.94 2.6784 66.4037
1 Line 4 6.5343 2.94 3.5943 89.1112
1 Line 5 3.6252 2.94 0.6852 16.9877
1 Line 6 5.8521 2.94 2.9121 72.1978
1 Line 7 5.5128 2.94 2.5728 63.7858
1 Line 8 5.6661 2.94 2.7261 67.5865
1 Line 9 6.2703 2.94 3.3303 82.5660
1 Line 10 5.6829 2.94 2.7429 68.0029
1 Line 11 6.7047 2.94 3.7647 93.3359
Rank of the contingency Generation unit outage λmax(p.u) Percentage decrease in MWM
1 Line 2 1.7218 83.24
2 Line 5 1.7263 83.01
3 Line 7 2.6251 36.21
4 Line 3 2.6754 33.60
5 Line 8 2.6981 32.41
6 Line 10 2.7062 32.00
7 Line 6 2.7867 27.80
8 Line 9 2.9859 17.43
9 Line 4 3.1116 10.89
10 Line 11 3.1927 6.66
(01)SINGLE GENERATION UNIT OUTAGES
In single generation unit outage contingency the values obtained are tabulated in table 7. In generation unit outage the bus number with lowest voltage magnitude is specified with loading factor, real and reactive power in the table.
Table 07RESULTS OF GENERATION UNIT OUTAGES
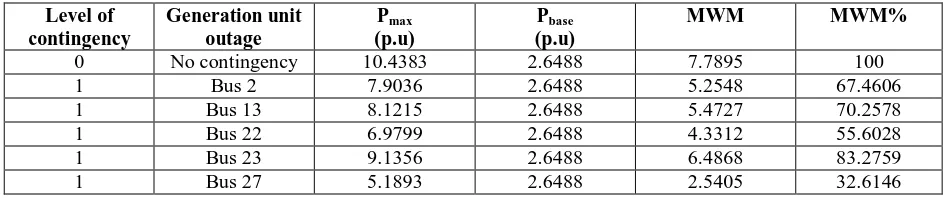
The results obtained of MWM during zero level contingency are 7.7895. The values obtained of MWM and MWM %is tabulated in the table 8 for generation unit outages.
Table 08 MWM and %MWM FOR GENERATION UNIT OUTAGES
The values obtained of percentage decrease in MWM are tabulated in table 9. In generation unit outage connected to bus 27 having λ= 2.7428 and MWM % decrease= 67.39 is identified as critical contingency among the remaining contingencies of generation unit outage.
Table 09 CONTINGENCIES RANKING OF SINGLE GENERATION UNIT OUTAGES
In generation unit outage connected to bus 27 ismarked as critical contingency in the system. Similarly other generator outages are ranked on the basis of MWM percentage decrease, given in table 3.
(02)LINE OUTAGES
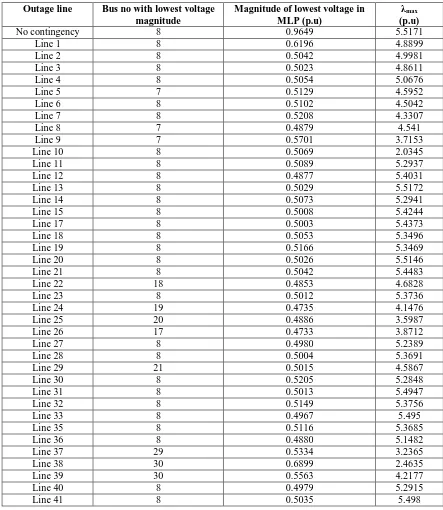
In line unit outage values obtained are tabulated in table 10. The bus number with lowest voltage magnitude is specified with loading factor in the table.
Generation unit outage
Bus no with lowest voltage magnitude
Magnitude of lowest voltage in MLP (p.u)
λmax (p.u)
Pload (p.u)
Qload (p.u)
No contingency 8 0.9649 5.5171 0.3 0.3
Bus 2 8 0.4837 4.1774 1.2532 1.2532
Bus 13 8 0.5528 4.2926 1.2878 1.2878
Bus 22 21 0.5181 3.6892 0.6456 0.4132
Bus 23 8 0.5109 4.8285 1.4486 1.4486
Bus 27 30 0.6374 2.7428 0.2907 0.0521
Level of contingency
Generation unit outage
Pmax (p.u)
Pbase (p.u)
MWM MWM%
0 No contingency 10.4383 2.6488 7.7895 100
1 Bus 2 7.9036 2.6488 5.2548 67.4606
1 Bus 13 8.1215 2.6488 5.4727 70.2578
1 Bus 22 6.9799 2.6488 4.3312 55.6028
1 Bus 23 9.1356 2.6488 6.4868 83.2759
1 Bus 27 5.1893 2.6488 2.5405 32.6146
Rank of the contingency Generation unit outage λmax(p.u) Percentage decrease in MWM
1 Bus 27 2.7428 67.39
2 Bus 22 3.6892 44.40
3 Bus 2 4.1774 32.54
4 Bus 13 4.2926 29.74
Table 10 SINGLE LINE UNIT OUTAGES
The result obtained of MWM during zero level contingency is 7.7895. The values obtained of MWM and MWM% is
Outage line Bus no with lowest voltage magnitude
Magnitude of lowest voltage in MLP (p.u)
λmax (p.u)
No contingency 8 0.9649 5.5171
Line 1 8 0.6196 4.8899
Line 2 8 0.5042 4.9981
Line 3 8 0.5023 4.8611
Line 4 8 0.5054 5.0676
Line 5 7 0.5129 4.5952
Line 6 8 0.5102 4.5042
Line 7 8 0.5208 4.3307
Line 8 7 0.4879 4.541
Line 9 7 0.5701 3.7153
Line 10 8 0.5069 2.0345
Line 11 8 0.5089 5.2937
Line 12 8 0.4877 5.4031
Line 13 8 0.5029 5.5172
Line 14 8 0.5073 5.2941
Line 15 8 0.5008 5.4244
Line 17 8 0.5003 5.4373
Line 18 8 0.5053 5.3496
Line 19 8 0.5166 5.3469
Line 20 8 0.5026 5.5146
Line 21 8 0.5042 5.4483
Line 22 18 0.4853 4.6828
Line 23 8 0.5012 5.3736
Line 24 19 0.4735 4.1476
Line 25 20 0.4886 3.5987
Line 26 17 0.4733 3.8712
Line 27 8 0.4980 5.2389
Line 28 8 0.5004 5.3691
Line 29 21 0.5015 4.5867
Line 30 8 0.5205 5.2848
Line 31 8 0.5013 5.4947
Line 32 8 0.5149 5.3756
Line 33 8 0.4967 5.495
Line 35 8 0.5116 5.3685
Line 36 8 0.4880 5.1482
Line 37 29 0.5334 3.2365
Line 38 30 0.6899 2.4635
Line 39 30 0.5563 4.2177
Line 40 8 0.4979 5.2915
Table 11 MWM and %MWM FOR LINE UNIT OUTAGES
Level of contingency
Generation unit outage
Pmax (p.u)
Pbase (p.u)
MWM MWM%
0 No contingency 10.4383 2.6488 7.7895 100
1 Line 1 9.2517 2.6488 6.6029 84.7671
1 Line 2 9.4564 2.6488 6.8076 87.3946
1 Line 3 9.1971 2.6488 6.5483 84.0663
1 Line 4 9.5879 2.6488 6.9391 89.0830
1 Line 5 8.6942 2.6488 6.0454 77.6099
1 Line 6 8.5219 2.6488 5.8732 75.3986
1 Line 7 8.1936 2.6488 5.5448 71.1833
1 Line 8 8.5915 2.6488 5.9427 76.2905
1 Line 9 7.0294 2.6488 4.3806 56.2372
1 Line 10 3.8492 2.6488 1.2004 15.4107
1 Line 11 10.0156 2.6488 7.3668 94.5739
1 Line 12 10.2227 2.6488 7.5739 97.2318
1 Line 13 10.4385 2.6488 7.7897 100.0028
1 Line 14 10.0164 2.6488 7.3676 94.5836
1 Line 15 10.263 2.6488 7.6142 97.7494
1 Line 17 10.2873 2.6488 7.6385 98.0614
1 Line 18 10.1215 2.6488 7.4727 95.9326
1 Line 19 10.1164 2.6488 7.4676 95.8673
1 Line 20 10.4336 2.6488 7.7848 99.9395
1 Line 21 10.3082 2.6488 7.6594 98.3301
1 Line 22 8.8600 2.6488 6.2112 79.7384
1 Line 23 10.1669 2.6488 7.5181 96.5153
1 Line 24 7.8473 2.6488 5.1985 66.7371
1 Line 25 6.8087 2.6488 4.1599 53.4044
1 Line 26 7.3243 2.6488 4.6755 60.0235
1 Line 27 9.9119 2.6488 7.2632 93.2428
1 Line 28 10.1583 2.6488 7.5095 96.4059
1 Line 29 8.6780 2.6488 6.0292 77.4022
1 Line 30 9.9989 2.6488 7.3501 94.3592
1 Line 31 10.3959 2.6488 7.7471 99.4552
1 Line 32 10.1706 2.6488 7.5218 96.5631
1 Line 33 10.3965 2.6488 7.7477 99.4635
1 Line 35 10.1571 2.6488 7.5083 96.3905
1 Line 36 9.7405 2.6488 7.0917 91.0414
1 Line 37 6.1234 2.6488 3.4746 44.6066
1 Line 38 4.6608 2.6488 2.0120 25.8302
1 Line 39 7.9798 2.6488 5.3310 68.4386
1 Line 40 10.0114 2.6488 7.3626 94.5198
1 Line 41 10.4023 2.6488 7.7535 99.5383
Table 12 CONTINGENCIES RANKING OF SINGLE GENERATION UNIT OUTAGES
Rankof the contingency Generation unit outage λmax (p.u)
Percentage decrease in MWM
1 Line 10 2.0345 84.59
2 Line 38 2.4635 74.17
3 Line 37 3.2365 55.39
4 Line 25 3.5987 46.60
5 Line 9 3.7153 43.76
6 Line 26 3.8712 39.98
7 Line 24 4.1476 33.26
8 Line 39 4.2177 31.56
9 Line 7 4.3307 28.82
10 Line 6 4.5042 24.60
11 Line 8 4.541 23.71
12 Line 29 4.5867 22.60
13 Line 5 4.5952 22.39
14 Line 22 4.6828 20.26
15 Line 3 4.8611 15.93
16 Line 1 4.8899 15.23
17 Line 2 4.9981 12.61
18 Line 4 5.0676 10.92
19 Line 36 5.1482 8.96
20 Line 27 5.2389 6.76
21 Line 30 5.2848 5.64
22 Line 40 5.2915 5.48
23 Line 11 5.2937 5.43
24 Line 14 5.2941 5.42
25 Line 19 5.3469 4.13
26 Line 18 5.3496 4.07
27 Line 35 5.3685 3.61
28 Line 28 5.3691 3.59
29 Line 23 5.3736 3.48
30 Line 32 5.3756 3.44
31 Line 12 5.4031 2.77
32 Line 15 5.4244 2.25
33 Line 17 5.4373 1.94
34 Line 21 5.4483 1.67
35 Line 31 5.4947 0.54
36 Line 33 5.495 0.54
37 Line 41 5.498 0.46
38 Line 20 5.5146 0.06
39 Line 13 5.5172 0
IV.CONCLUSION
In this paper, we have analysed static voltage stability by using power system contingencies like generator outage and line outage. Ranking of contingencies is done on the basis of percentage decrease in MWM and MLP by using continuation power flow method in PSAT. The results obtained during contingencies shows that reduction in voltage drop in the buses of the system, hence it gives reduce value of MWM and percentage decrease in MWM. Contingency having higher percentage decrease in MWM is placed at the top. The weak bus in the system can be found out by this method and corrective action can take place before system gets collapse.
REFERENCES
[01] PrabhaKundur, “Power System Stability and Control”, New York: McGraw-Hill, 1994. [02] K. B Hemalatha, S.T Jayachristra, “Power System Analysis”, SCI TECH Publication, 2010. [03] R. K. Rajput, “A Textbook of Power System Engineering”, Laxmi publication, 2012.
[04] MostafaAlinezhad and MehrdadAhmadiKamarposhti, “Static Voltage Stability Assessment Considering the Power System Contingencies using Continuation Power Flow Method”, InternationalJournal of Electrical and Electronics Engineering, 2010.
[05] ArthitSode-Yome, NadarajahMithulananthan and Kwang Y. Lee, “A Maximum Loading Margin Method for Static Voltage Stability in Power Systems”, IEEE Transactions on Power Systems, Vol. 21, Issue 2, May 2006.
[06] KusumVerma, K.R. Niazi, “Supervised Learning Approach to on Line Contingency Screening And Ranking In Power System,” Electrical Power and Energy Systems, 2012.
[07] IrajRahimiPordanjani, YunfeiWang and WilsunXu, “Identification of Critical Components for Voltage Stability Assessment Using Channel Components Transform” IEEE Transactions on Smart Grid, Vol. 4, Issue 2, pp: 1122-1132, June 2013.
[08] Sidhu T.S., Cui L., “Contingency screening for steady-state security analysis by using FFT and artificial neural networks”, IEEE Transaction on Power System, Vol. 15, Issue 1, pp. 421–26, 2000.
[09] Subramani C., SubhransuSekhar Dash,Vivek Kumar and Harish Kiran, “Implementation of Line Stability Index for Contingency Analysis and Screening in Power Systems”, Journal of Computer Science Science Publications, pp: 585-590, 2012.
[10] Ali Abdulwahhaband Abdulrazzaq, “Contingency ranking of power systems using a performance index”, International Research Journal of Engineering and Technology, Vol 02, Issue 02, May 2015.
[11] Udaykumar and Udaykuma, “Contingency Ranking in Modern Power System by Exact and Precise Method” International Journal of Innovative Research in Electrical, Electronics, Instrumentation and Control Engineering, Vol. 3, Issue 5, May 2015.
[12]MoussaReda Mansour, Luís Fernando Costa Alberto and Rodrigo Andrade Ramos, “Preventive Control Design for Voltage Stability Considering Multiple Critical Contingencies” IEEE Transactions on Power systems, Vol. 31, Issue 2, pp: 1517-1525, March 2016.