Brain Tumor Detection using Watershed Algorithm
Dawood Dilber 1, Jasleen 2
P.G. Student, Department of Electronics and Communication Engineering, Amity University, Noida, U.P, India1 P.G. Student, Department of Electronics and Communication Engineering, Amity University, Noida, U.P, India2
ABSTRACT: The brain is the interior most part of the central nervous system and is an intracranial solid neoplasm. Tumors are created by an abnormal and uncontrollable cell division in the brain. In this work, axial view of the brain image (2D) from MRI scan has been used because MRI scan is less harmful than CT brain scan. The study of brain tumor is important as it is occurring in many people. In this paper, an image segmentation method was proposed for the identification or detection of tumor from the brain. The methodology consists of the following steps: pre-processing by using grey-level, sharpening and median filters; segmentation of the image was performed by thresholding and also by applying the watershed segmentation. Finally the tumor region was obtained with its area.
KEYWORDS:Brain tumor, MRI, Thresholding, Filtration, Segmentation, Watershed, Pre-Processing.
I. INTRODUCTION
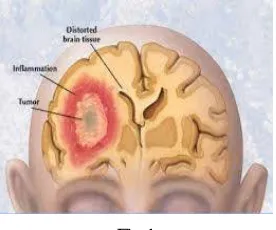
A tumor is a mass of tissues that is formed by an accumulation of abnormal cells. Normally, the cells in our body grow, age, die, and are replaced by new cells but the cancer and other tumors damage this cycle. The tumor cells do grow, even if the body does not want them and unlike old cells, these cells do not die easily causing tumor or cancer. As the process goes (i.e., as the tumor cells grow on) the tumor continues to grow and more and more cells are added to mass as shown in Fig 1.
There are two types of tumors namely, cancerous tumors and non-cancerous tumors. These tumors are ranked from 1 to 4 according to their behaviour. Malignant tumor is either graded 3 or 4, whereas grade 1 or 2 tumors are usually benign tumors. Most of the malignant tumors are secondary cancers, which mean they start in another part of the body and spread to the brain region and are harmful. Benign tumors are started in brain and are not aggressive as compared to malignant tumors. Normally, benign tumors do not spread to surrounding tissues but they can be harmful with time.
Fig 1. Area effected with Tumor: The picture below shows the area being infected with abnormal growth of the cells causing tumor in the brain maybe cancerous or non-cancerous. This picture clearly shows the tumor region being infected.
II. RELATEDWORK
Image processing is the technique which is used to get an enhanced image by converting an image into digital form. Image processing is achieved by applying operations on image so as to get some useful information from that image. Image Processing Toolbox which is providing different algorithms, functions, and applications for the processing of the images, analysing them, visualizing them, developing algorithm and applying algorithm over it. Various techniques like image analysis, segmenting the image, enhancement of the image, reducing noise from the image, geometric transformations of the image, and also image registration can be performed using Image Processing Toolbox. It is one of the most rapidly growing technologies nowadays.
ARCHITECTURE
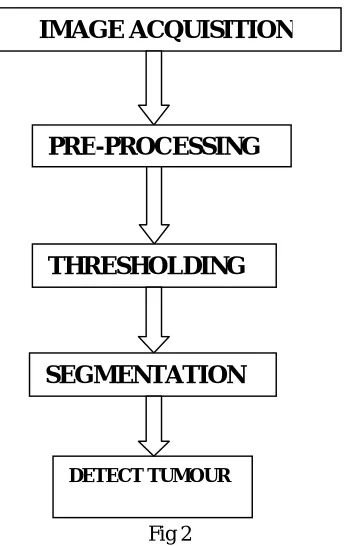
The objective of this paper was to detect the brain tumor using segmentation method on MATLAB software (implemented on MATLAB version R2011a). This method was divided into different stages as shown in Fig 2.
Fig 2. Architecture of the System: This figure shows the whole process of the system to detect the brain tumor which include Image acquisition, pre-processing, thresholding, segmentation and final stage tumor detection. In this the input image is being processed by various methods and then finally we segment the input image of the tumor infected brain and hence tumor area in detected and its area is computed.
Fig 2
The architecture is fully applicable on the general functioning of the system description. In this, the first time, it is started with the magnetic resonance image (MRI) of the brain, which is seen as an image of inputs. Here the processing is done on the input images to scale the image input by converting the image and removal of the noise contents from the image by using filtering method. Then, the segmentation of this image was done after thresholding i.e. converting
IMAGE ACQUISITION
PRE-PROCESSING
THRESHOLDING
DETECT TUMOUR
the image to binary which is the black and white. After applying thresholding, the Watershed segmentation technique is applied which helps in segmenting the objects that touches each other so as to isolate them.
1. IMAGE ACQUISITION
The MRI Images were acquired from sources which are publically available. The images used were in .jpg format. This image could be read from either computer or from internet using 'imread' command.
2. PRE-PROCESSING
The MRI Images which are obtained from publicly available sources cannot be feed directly for processing of these images as it contain noises such as external noise or the noise due to the movement of patient during MRI scan etc. These noises needed to be removed and the images were needed to be enhanced for the detection of efficient brain tumor. The pre-processing stage consists of following steps listed below:
a) Gray-level conversion:
The image read in .jpg format was first converted from RGB image to gray-level image. So, the very first step in this method was to convert the input image i.e. MRI image to be pre-processed into a Gray-scale image. Gray-scale images were occasionally known as "black and white" image, but this was not correct. The halftone image also known as true black and white image could be achieved by thresholding.
In true black and white image, gray shading can be acquired by letting the image as a grid of white dots on black background and vice-versa. The lightness of the gray can be determined from the size of individual dots in the vicinity. For example, the brightness levels of RGB components can be represented as decimal numbers from 0 to 255 in case of transmitted light or by binary from 00000000 to 11111111. For every pixel in a RGB grayscale image [1], R = G = B.
The numbers which are representing the brightness levels of primary colors is directly proportional to lightness of gray. Black is illustrated by R = G = B = 0 in case of decimal or R = G = B = 00000000 in case of binary. Similarly, white is symbolized by R = G = B = 255 in decimal form or R = G = B =11111111 in binary form. The imaging method is called 8-bit Grayscale because the representation of gray level in binary is in 8-bits. Grayscale can be collectively known as the range of shades of gray [6]. Black is the darkest possible shade i.e. there is no transmitted or reflected light. While, white is the lightest possible shade i.e. there is transmission or reflection of light at all visible wavelengths. So the very first step in this method is the conversion of the input image i.e. MRI image to be pre-processed into a Grayscale image.
b) High Pass Filter
After the above procedure the gray-scale image was given as an input to high pass filter (HPF). A HPF is the basically for sharpening methods. Sharpening is a method or technique in which the fine details of the image being processed is highlighted. Also, the HPF is used for edge detection technique. These filters sharpen the image by making a high contrast or distinction overlay that highlight edges in the image.
c) Median Filter
The median filter technique is the non-linear digital filtering method, and is generally used to remove the noise in the image. The input image is filtered by using median filter to remove present noise from the gray-level image and is also used to limit the effects of edge fading from the image. This noise is typical the processing step to improve the post-treatment outcomes of the image.
3. THRESHOLDING
It converts or transforms the grayscale image, say I, to a bilateral or binary image. BW image output replace the each pixel of the input image with the greatest luminance level of value of 1 (white) and replacing all other pixels value to 0 (black).
Algorithm:
1) Select the initial estimated value for threshold, say T.
2) Segment the image using value T
G1 is calculated as the pixels having intensities greater than T
G2 is calculated as the pixels having intensities less than or equal to T 3) Compute averages for m1 & m2 for the pixels given G1 & G2.
4) Let, T = (m1+m2)/2
5) Repeat 1-2 until no more changes.
4. SEGMENTATION
Segmentation is a division or partition of the digital images into the various segments process. The purpose of segmentation is to simplify the representation of the image which will be clearer and easier to analyze for further processes. The image segmentation locates the objects in border and also it allocates the label to each pixel in the input image.
5. TUMOR DETECTION
1. In the final step, tumor is retrieved from the marked MRI image area. The marked area occupies the maximum space in the picture, so there was exactly one label in the picture which is designated as having maximum frequency value. The brain tumor was detected using the ‘region props’ command in the MATLAB. It is also used to determine the characteristics or the properties of the image which measures the area of the affected part of the brain. An efficient edge detection scheme is applied to the greyscale image. The image I is blurred (to reduce false edges and over-segmentation) using open-close and close-open filters. The final blurred image Ib is the average of the outputs of these filters. The 3 x 3 8-connected structuring element of type ‘square’ is used here. Next, the morphological gradient operator is applied to the blurred image Ib resulting in an image G as follows:
G = Dilation (Ib) – Erosion (Ib)
The Morphological gradient is an edge-strength extraction operator that gives symmetric edges between foreground and background regions.
The resulting image is then thresholded to obtain a binary edge image. Global thresholding technique is used for that.
2. Closed edges in the binary edge image are grouped by dilation using eight- connected structuring elements. Then small connected components in the dilated image are filtered using erosion. The output is a binary image that contains text candidate regions.
3. Connected component labelling is performed to label each object separately.
4. After applying connected component labelling, the first set of criteria is applied which eliminate all objects whose area is greater than 10000 and filled area is greater than 8000. One more criteria namely major axis length is used which is used to retain the text region alone. All objects, whose major axis lengths are in between 20 to 3000, are considered to be text. To eliminate small objects, connected component labelling is applied to the resultant image and the second set of criteria is applied which eliminates all the objects whose area is less than 300 and filled area is less than 500.
III.EXPERIMENTALRESULTS
In this, we have used 2 samples of magnetic resonance images (MRI) by using processing of the image. The MRI was the picture of a brain tumor that does not appear to be at exact location of a tumor in the brain, so the exact position of the tumor in an MRI image processing was found using various techniques like the segmentation and the threshold techniques. It has given the exact shape of the tumor in the form of MRI, and finally detection of brain tumor in magnetic resonance images was obtained.
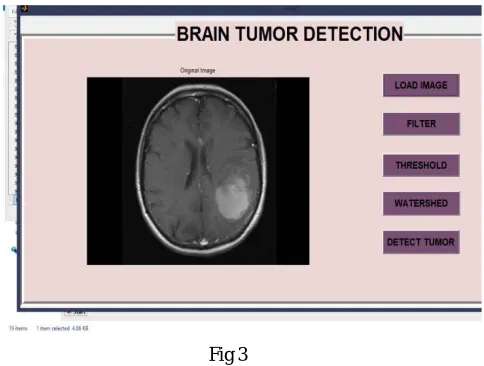
Implementation of a brain tumor was carried on the graphical user interface and the resultant images were displayed on the axes shown in fig 3.
Fig 3. GUI Implementation of Brain Tumor: By Graphical User Interface (GUI) we made the application in which we created various buttons like LOAD IMAGE, FILTER, THRESHOLD, WATERSHED, and DETECT TUMOR which will first load the input image by clicking the load button and displays the image on the right axes. After this, the image is filtered and then segmented and finally tumor is detected.
Fig 3
The watershed segmentation technique and filtration technique on two MRI image samples of different patients were applied and results have been shown in the figures 4 and figure 5.
Here, the different values were applied on different images for detecting the tumor. Like, the values taken for the threshold method were different for different images because the location of the tumor was different.
SAMPLE 1:
(a) (b) (c) (d
)
(e)
SAMPLE 2:
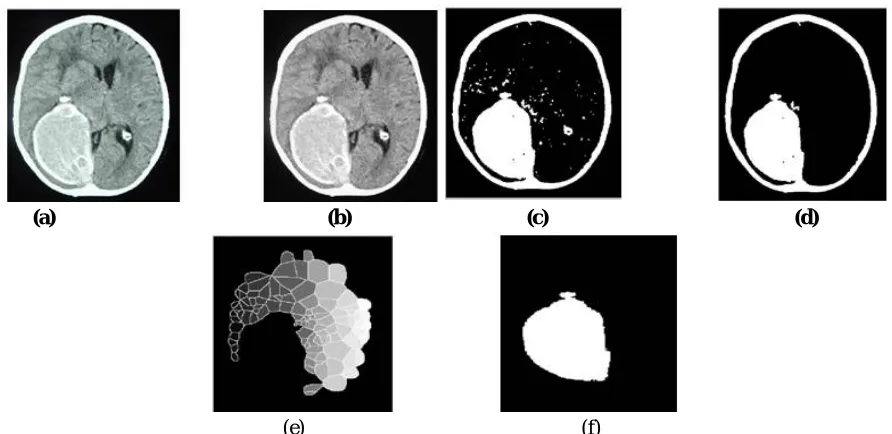
Fig 5. (a) Original input image of the patient having tumor in the brain; (b) grey-level imaging is done in which the input image which is in rgb form is converted to gray level image; (c) image labelling is done on the gray level image which labels each and every object in the image (d) threshold is applied in which the image is converted to black and white (e) watershed is applied which separates two touching objects; (f) finally, tumor is detected.
(a) (b) (c) (d)
(e) (f)
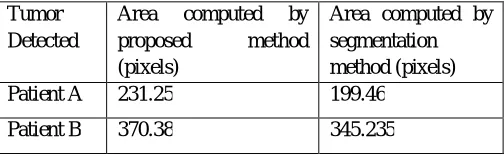
TABLE 1: Area computed by proposed method and by segmentation method of two patients. In this, we take 2 patients having tumor in the brain and we computed the area infected with the tumor of both the patients (in pixels) and compared the data with other method.
Here, the different values were applied on different images for detecting the tumor. Like, the values taken for the threshold method were different for different images because the location of the tumor was different. The tumor can be prolonged to the other body parts, so we can do classifications so as to classify the cells as it is tumorus or not. This could be achieved more advanced such that tumor can be classified according to their type. Tumor of infected patient can also be studied by plotting graph.
Also, new ideas or ways can be made so that the extraction of the tumor part or the area must be correct. Hence, the tumor can be easily detected or analyzed so that it can be more helpful for the doctors to know the exact location that where the tumor has infected the area and also helpful for the treatment of the patients to diagnose it.
IV. CONCLUSION
In this paper, brain tumor was detected from the MRI images obtained from locally available sources using watershed algorithms and filtering techniques. For the brain tumor detection, pre-processing was applied so as to enhance the input MRI image and also to remove the noise from the MRI image.
Various operators were used to change the image according to the need which was very beneficial in extracting the tumor from the image. The pre-processing was implemented using filtering, grey-levelling and adjusting the image.
For different input images, different values have to be assigned to some operators because the tumor is not always at the same part or location. For different people, tumor may be at different places, or it may or may not be deep inside the brain (as it depends on the level of the tumor). So, new concept and different techniques can be used to improve the correctness of these algorithms. Such that, the tumor is detected automatically without changing the values again and again for different images.
REFERENCES
[1] Anam Mustaqeem,Ali Javed,Tehseen Fat ima, “An Efficient Brain Tumor Detection Algorithm Using Watershed & Thresholding Based Segmentation”, International Journal of Image, Graphics and Signal Processing, vol.4, pp. 34-39,September 2012.
[2] J. Selvakumar, A. Lakshmi, and T. Arivoli, "Brain tumor segmentation and its area calculation in brain mr images using k-mean clustering and fuzzy c-mean algorithm," in Proceedings in IEEE-International Conference On Advances In Engineering, Science And Management, 2012, pp. 186-190.
[3] G. Hamerly and C. Elkan, "Learning the k in k-means," in Proceedings i7th Annual Conference on Neural Information Processing Systems (NIPS), 2003, pp. 281-288.
[4] K. Thapaliya and G. Kwon, "Extraction of brain tumor based on morphological operations," in Proceedings iEEE-8th international Conference on Computing Technology and Information Management, 2012, pp. 515-520.
[5] Pratibha Sharma, Manoj Diwakar and Sangam Choudhary, “Application of edge det ect ion in brain t umor det ect ion”, Int ernat ional Journal of Computer Applicat ions ,vol.58, pp.21-25, November 2012.
[6] Kailash Sinha and G.R.Sinha, “ Efficient segmentat ion methods for tumor detection in MRI images”, IEEE Student‟s Conference on Electrical, Electronics and Computer Science,pp.1-6,March 2014.
[7] B.K Saptalakar and Rajeshwari.H, “Segmentat ion based detect ion of brain tumor,” International Journal of Computer and Electronics Research,vol. 2, pp. 20-23, February 2013.
Tumor Detected
Area computed by proposed method (pixels)
Area computed by segmentation method (pixels) Patient A 231.25 199.46
[8] Pratibha Sharma, Manoj Diwakar and Sangam Choudhary, “Application of edge detection in brain tumor detection”, International Journal of Computer Applications ,vol.58, pp.21-25, November 2012.
[9] Charutha S. and M.J.Jayashree, “An integrated brain tumor detection technique”, International Journal of Research in Advent Technology, vol.2, pp. 211-214, May 2014.