Patterns of DNA Sequence Variation Suggest the Recent Action of Positive
Selection in the
janus-ocnus
Region of
Drosophila simulans
John Parsch, Colin D. Meiklejohn and Daniel L. Hartl
Department of Organismic and Evolutionary Biology, Harvard University, Cambridge, Massachusetts 01238-2020 Manuscript received April 2, 2001
Accepted for publication July 16, 2001
ABSTRACT
Levels of nucleotide polymorphism in three paralogousDrosophila simulansgenes,janusA(janA),janusB (janB), andocnus(ocn), were surveyed by DNA sequencing. The three genes lie in tandem within a 2.5-kb region of chromosome arm 3R. In a sample of eight alleles from a worldwide distribution we found a significant departure from neutrality by several statistical tests. The most striking feature of this sample was that in a 1.7-kb region containing thejanAandjanBgenes, 30 out of 31 segregating sites contained variants present only once in the sample, and 29 of these unique variants were found in the same allele. A restriction survey of an additional 28 lines ofD.simulansrevealed strong linkage disequilibrium over thejanA-janBregion and identified six more alleles matching the rare haplotype. Among the rare alleles, the level of DNA sequence variation was typical forD.simulansautosomal genes and showed no departure from neutrality. In addition, the rare haplotype was more similar to theD.melanogastersequence, indicating that it was the ancestral form. These results suggest that the derived haplotype has risen to high worldwide frequency relatively recently, most likely as a result of natural selection.
T
HE comparison of DNA sequences both between mous and synonymous substitution rates,dN/dS) among and within species provides valuable information the three genes, suggesting that each gene has evolved for understanding the evolutionary forces affecting ge- under different selective constraints following duplica-netic loci. Interspecific comparisons are useful for mea- tion. In addition, all three genes showed a faster rate suring rates of molecular evolution, inferring functional of evolution than genes encoding metabolic enzymes. domains that are under strong selective constraint, and This result was consistent with a general pattern of in-understanding processes such as gene duplication. In- creased evolutionary rates in genes with reproductive traspecific comparisons reveal the standing genetic vari- function (CivettaandSingh 1998). Some reproduc-ation within a populreproduc-ation and the microevolutionary tive genes, such as the Drosophila accessory protein forces that have shaped such variation. Previously we geneAcp26Aa, show evidence for positive selection by investigated the rates of molecular evolution of three adN/dSratio that is significantly greater than 1 (Tsaur paralogous male-reproductive genes,janusA(janA),ja- and Wu 1997). This ratio was much less than 1 for nusB(janB), andocnus(ocn), in theDrosophila melanogas- janA, janB, and ocn, and thus there was no evidence ter species subgroup (Parsch et al. 2001). The three for positive selection by this strict criterion. However, a genes are the result of two duplication events. The initial number of powerful statistical techniques have been duplication of an ancestral sequence produced thejanA developed to detect patterns of selection from intraspe-andjanBgenes and clearly predates the divergence of cific DNA polymorphism data. For this reason, we chose theD.melanogasterandD.obscuraspecies groups (Yani- to investigate intraspecific variation in the janA, janB, costaset al. 1995), which is estimated to have occurred andocngenes.25 million years ago (mya) (Russo et al. 1995). The In species of the D. melanogaster species subgroup, subsequent duplication ofjanBto produceocnappears janA,janB, andocnlie in tandem within a 2.5-kb region to have occurred after the divergence of theD.melano- of the right arm of chromosome 3 (Figure 1). janA gasterandD.obscura species groups but prior to diver- produces two alternatively spliced transcripts, one that gence of theD.melanogasterspecies subgroup (Parsch is specific to testes and another that is found in various et al. 2001), which occurredⵑ10 mya (Russoet al. 1995). tissues and in both sexes (Yanicostaset al. 1989). The Our results indicated significant heterogeneity in rates two janA transcripts differ in their 5⬘ untranslated re-of evolution (as measured by the ratio re-of the nonsynony- gions (UTRs) and their translation begins at different
AUG initiation codons, with initiation of the sperm-specific polypeptide occurring 48 bp downstream of the
Corresponding author:John Parsch, Department of Organismic and general initiation site (Yanicostaset al. 1989). The 3⬘ Evolutionary Biology, Harvard University Biological Laboratories, 16
UTR ofjanAoverlaps with the 5⬘UTR ofjanBand the
Divinity Ave., Cambridge, MA 02138-2020.
E-mail: [email protected] beginning of thejanBprotein-encoding region (
Figure 1.—Diagram of the janus-ocnus genomic region. The relative chromosomal lo-cation of the three genes is shown at the top, with coding regions represented as solid boxes. A bracket indicates the region that was PCR amplified and sequenced in this study. The janA, janB, and ocn transcrip-tional units are shown below. Solid boxes represent coding re-gions, open boxes represent un-translated regions, and lines rep-resent introns.
purified by the alkaline lysis procedure (Sambrooket al. 1989) costaset al. 1989; Figure 1). Despite this overlap, both
and used as a template for DNA sequencing. Alternatively, janA andjanBproduce monocistronic transcripts that
PCR products were purified using the QIAquick PCR purifica-are controlled by independent promoters (Yanicostas tion kit (QIAGEN, Valencia, CA) and used directly as sequenc-andLepesant1990).janBandocnproduce only testis- ing templates. DNA sequencing was performed with the dye terminator cycle sequencing kit (Applied Biosystems, Foster specific transcripts (Yanicostas et al. 1989; Parsch et
City, CA), using the amplification primers and gene-specific al. 2001). The ocn transcriptional unit lies ⵑ250 bp
internal primers (Parschet al. 2001). In addition, universal downstream from the janB polyadenylation site, and
M13 forward and reverse primers were used for sequencing there is no overlap between thejanBandocntranscripts plasmid templates. Sequencing gels were run on an ABI 373 (Figure 1). ThejanB5⬘UTR contains translational con- automated sequencer. DNA was sequenced on both strands and a minimum of either two independently cloned plasmid trol elements that have been shown to restrict
transla-templates or one plasmid template and one PCR template tion to the postmeiotic stages of sperm development
were sequenced for each line. Additional clones or PCR tem-(Yanicostaset al. 1995). The high degree of similarity
plates were sequenced when necessary to resolve ambiguities. between the janB andocn 5⬘ UTR sequences suggests We did not encounter any heterozygous positions within the thatocntranslation is under similar post-transcriptional sequenced regions. DNA sequences have been submitted to the GenBank database under accession nos. AF393330– regulation (Parschet al. 2001).
AF393368. In this article, we report DNA sequence variation in
Restriction analysis:Restriction enzymes and buffers were the janA-ocn region of D. simulans. We find reduced
supplied by New England Biolabs (Beverly, MA). The follow-levels of polymorphism at these loci relative to other ing enzymes were used:BstYI,RsaI,MluI, andFokI. For restric-third chromosome loci surveyed previously. More strik- tion analysis, the janA, janB, and ocn genes were amplified separately from eachD. simulansline and an aliquot of the ingly, we find two highly divergent haplotypes in a 1.7-kb
undigested product was run on a 1% agarose gel to ensure region spanning thejanAandjanBgenes. The
distribu-correct amplification. Five microliters of PCR product was tion of variants at segregating sites is shown to differ
then digested using the manufacturer’s buffer and 2–6 units significantly from the neutral expectation by several sta- of enzyme. Digests were carried out at 37⬚for 2 hr. Digestion tistical tests. These results are consistent with a model products were separated on 2% agarose gels, which allowed the unambiguous scoring of the presence or absence of a of genetic hitchhiking and suggest the recent action of
particular restriction site. Separate digests were performed for positive selection in this region of the genome.
each restriction enzyme.
Sequence analysis:Standard DNA polymorphism analyses and coalescent simulations to determine the probabilities of MATERIALS AND METHODS
the observed number of haplotypes, haplotype diversity, and
Tajima’s(1989)Dstatistic were performed using DnaSP 3.50 Fly stocks:EachD.simulansline was derived from a single
(Rozas and Rozas 1999). Coalescent simulations to
deter-wild-caught female and maintained by brother/sister mating
mine the statistical significance of Fay and Wu’s (2000)H for ⬎50 generations. The lines were collected from various
statistic were performed using a program provided by J. Fay. geographic locations and at various times and were kindly
The haplotype test ofHudsonet al. (1994), which determines provided to us by P. Capy and Y. Tao. The Canton-S strain of
the probability of observing a subset of i alleles with j or D.melanogasterwas used as an outgroup. Genomic DNA was
fewer segregating sites given a total sample ofnalleles with prepared from a single male of each line as described
pre-Ssegregating sites, was performed using a program provided viously (Parschet al. 2001).
by J. Braverman. Values ofi andj were chosen to produce PCR and DNA sequencing:ThejanA-ocn region was PCR
the most extreme subset possible from the observed data. The amplified as a single 2.4-kb fragment from genomic DNA using
probability was corrected for thea posteriorichoice of iand primers and amplification conditions described inParschet
j by including the probability of all more extreme configura-al. (2001). The amplified region contained the complete
cod-tions theoretically possible. For all of the above, 10,000 ran-ing sequences of janA andjanBand a large portion of the
dom coalescent simulations (Hudson1990) were performed ocncoding sequence extending into exon 3 (Figure 1). PCR
under the conservative assumption of no recombination. The products were cloned following the protocol of the TOPO TA
Figure2.—Segregating sites in the original sample of eight D. simulanslines (s1–s8) from a worldwide distribution. m1 represents the D. melanogaster outgroup sequence. Dots indi-cate a match to the s1 se-quence. Gaps are indicated by dashes. The dash at position 2188 represents a 3-bp deletion beginning at 2188.
RESULTS tion of variation. Five of the eight alleles are identical and match the s1 sequence. Of the three remaining Nucleotide polymorphism in thejanA-ocnregion:We
alleles, two are identical to each other (s5 and s7) but initially surveyed levels of nucleotide polymorphism in
differ from s1 at 11 sites. The final allele, s8, differs the janA-ocn region of eight D. simulans lines from a
from s1 at 8 sites but also differs from s5 and s7 at worldwide distribution. This survey revealed a total of
7 sites. Interestingly, the rare variants inocn occur in 44 single nucleotide polymorphisms (SNPs) and two
different lines than the rare variants injanAandjanB. insertion/deletion (indel) polymorphisms (Figure 2).
Because many of these rare variants match theD. melano-All of the polymorphisms were at silent or noncoding
gastersequence, we can discount the possibility that they sites, with the exception of a C/A polymorphism at
are all new mutations and can infer a recombination position 93. Interestingly, this polymorphism changes
event within the intergenic region between janB and the sperm-specific downstream initiation codon ofjanA
ocn(Figure 2). from AUG (Met) to CUG (Leu). This change
presum-Several statistical tests were applied to the data to ably eliminates the sperm-specific form of thejanA
poly-determine whether the observed distribution of variants peptide in line s2. However, s2 males appear
phenotypi-at segregphenotypi-ating sites differed from the neutral expecta-cally normal and are completely fertile (our unpublished
tion (Table 1). Only SNPs were considered in the calcu-results).
lation of statistics presented in Table 1 and in the analy-The most striking feature of the data is the
distribu-ses below. All tests were applied separately to each gene tion of variants at segregating sites over thejanA-janB
and to the region as a whole. In addition, due to the region. In this region there are a total of 31 segregating
strong linkage disequilibrium between variants in the sites. Variants at 30 of these sites are unique within the
janAandjanBgenes, we applied the tests to the com-sample (singletons), and 29 of the singletons are found
in line s3. Theocngene also shows an unusual distribu- binedjanA-janBregion. First, we tested for a departure
TABLE 1
Summary statistics for original sample (eight alleles)
Gene sites Sa a a D Nhap Hdiv Sub(i,j) H
janA 720 18 0.0063 0.0096 ⫺1.82* 3* 0.46** (7, 1)** ⫺11.57**
(411) (17) (0.0103) (0.0160)
janB 973 13 0.0036 0.0052 ⫺1.49* 3 0.68 (7, 1)** ⫺9.21**
(649) (13) (0.0054) (0.0077)
janA⫹B 1693 31 0.0048 0.0071 ⫺1.74* 4* 0.79 (7, 2)** ⫺20.78**
(1060) (30) (0.0073) (0.0109)
ocn 569 13 0.0103 0.0088 0.85 3 0.61* (5, 0) ⫺2.57
(238) (13) (0.0246) (0.0210)
All 2262 44 0.0061 0.0075 ⫺0.97 5 0.86* (4, 2) ⫺23.36**
(1298) (43) (0.0105) (0.0128)
S, number of segregating sites;, average number of pairwise nucleotide differences (Nei1987);, Watter-son’s(1975) estimator of 4N;D,Tajima’s(1989)Dstatistic; Nhap, number of haplotypes; Hdiv, haplotype diversity (Nei1987); Sub (i, j), the most extreme subset of the sample, whereiandjare the number of alleles and number of segregating sites in the subsample, respectively (Hudsonet al. 1994);H,FayandWu’s(2000) H statistic. Significance levels were determined by 10,000 random coalescent simulations on the basis of the number of alleles and the observed number of segregating sites. *P⬍0.05; **P⬍0.01.
TABLE 2
Restriction survey of a worldwide sample ofD. simulans
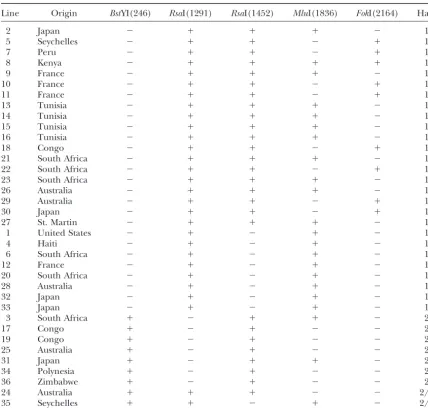
Line Origin BstYI(246) RsaI(1291) RsaI(1452) MluI(1836) FokI(2164) Hapa
2 Japan ⫺ ⫹ ⫹ ⫹ ⫺ 1
5 Seychelles ⫺ ⫹ ⫹ ⫺ ⫹ 1
7 Peru ⫺ ⫹ ⫹ ⫺ ⫹ 1
8 Kenya ⫺ ⫹ ⫹ ⫹ ⫹ 1
9 France ⫺ ⫹ ⫹ ⫹ ⫺ 1
10 France ⫺ ⫹ ⫹ ⫺ ⫹ 1
11 France ⫺ ⫹ ⫹ ⫺ ⫹ 1
13 Tunisia ⫺ ⫹ ⫹ ⫹ ⫺ 1
14 Tunisia ⫺ ⫹ ⫹ ⫹ ⫺ 1
15 Tunisia ⫺ ⫹ ⫹ ⫹ ⫺ 1
16 Tunisia ⫺ ⫹ ⫹ ⫹ ⫺ 1
18 Congo ⫺ ⫹ ⫹ ⫺ ⫹ 1
21 South Africa ⫺ ⫹ ⫹ ⫹ ⫺ 1
22 South Africa ⫺ ⫹ ⫹ ⫺ ⫹ 1
23 South Africa ⫺ ⫹ ⫹ ⫹ ⫺ 1
26 Australia ⫺ ⫹ ⫹ ⫹ ⫺ 1
29 Australia ⫺ ⫹ ⫹ ⫺ ⫹ 1
30 Japan ⫺ ⫹ ⫹ ⫺ ⫹ 1
27 St. Martin ⫺ ⫹ ⫹ ⫹ ⫺ 1
1 United States ⫺ ⫹ ⫺ ⫹ ⫺ 1
4 Haiti ⫺ ⫹ ⫺ ⫹ ⫺ 1
6 South Africa ⫺ ⫹ ⫺ ⫹ ⫺ 1
12 France ⫺ ⫹ ⫺ ⫹ ⫺ 1
20 South Africa ⫺ ⫹ ⫺ ⫹ ⫺ 1
28 Australia ⫺ ⫹ ⫺ ⫹ ⫺ 1
32 Japan ⫺ ⫹ ⫺ ⫹ ⫺ 1
33 Japan ⫺ ⫹ ⫺ ⫹ ⫺ 1
3 South Africa ⫹ ⫺ ⫹ ⫹ ⫺ 2
17 Congo ⫹ ⫺ ⫹ ⫺ ⫺ 2
19 Congo ⫹ ⫺ ⫹ ⫺ ⫺ 2
25 Australia ⫹ ⫺ ⫹ ⫺ ⫺ 2
31 Japan ⫹ ⫺ ⫹ ⫹ ⫺ 2
34 Polynesia ⫹ ⫺ ⫹ ⫺ ⫺ 2
36 Zimbabwe ⫹ ⫺ ⫹ ⫺ ⫺ 2
24 Australia ⫹ ⫹ ⫹ ⫺ ⫺ 2/1
35 Seychelles ⫹ ⫹ ⫺ ⫹ ⫺ 2/1
Restriction sites are given at the top, with the coordinates in parentheses.⫹, cut;⫺, uncut.
aHaplotype is defined by restriction pattern overjanA-janBregion (sites 247 and 1242). Putative recombinants
are labeled as both types (i.e.,2/1).
from neutrality in the frequency distribution of variants a significant paucity of haplotypes at janA and in the combined janA-janB region (Table 1). We also find a at segregating sites using Tajima’s (1989) D statistic.
We obtained a significantly negative value ofDforjanA, significant reduction in haplotype diversity at bothjanA and ocn and in the region as a whole (Table 1). In janB, and the combined janA-janB region (Table 1).
This indicates an excess of low-frequency variants and addition, the haplotype test of Hudson et al. (1994) revealed a highly significant departure from the neutral can be explained by the large number of sites at which
s3 differs from the other alleles. Tajima’sDis positive, expectation forjanA,janB, and the combinedjanA-janB region (Table 1). This indicates that there are fewer although not significantly so, for ocn, where many of
the variants are in intermediate frequency. segregating sites within the common haplotype than would be expected under a neutral equilibrium model. Two haplotype tests implemented in the DnaSP
com-puter program (RozasandRozas1999) were applied Finally, we compared the frequency spectrum of de-rived variants at polymorphic sites to the neutral expec-to our data. These test for either a reduction in the
number of haplotypes or in haplotype diversity by com- tation using the H statistic of Fay andWu (2000). A significantly negative value ofHindicates that derived paring the observed data to the results of random
TABLE 3
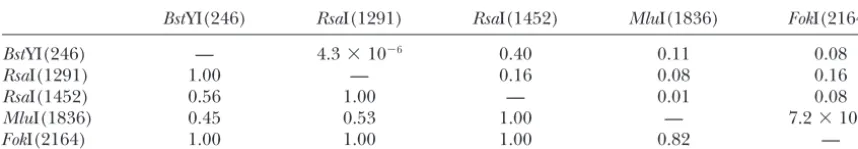
Linkage disequilibrium between polymorphic restriction sites
BstYI(246) RsaI(1291) RsaI(1452) MluI(1836) FokI(2164)
BstYI(246) — 4.3⫻10⫺6 0.40 0.11 0.08
RsaI(1291) 1.00 — 0.16 0.08 0.16
RsaI(1452) 0.56 1.00 — 0.01 0.08
MluI(1836) 0.45 0.53 1.00 — 7.2⫻10⫺4
FokI(2164) 1.00 1.00 1.00 0.82 —
Pvalues (Fisher’s exact test) are shown above the diagonal. The ratio of the observed linkage to its theoretical maximum (given the observed allele frequencies) is shown below the diagonal.
are expected to increase in frequency when linked to Nucleotide polymorphism in the rare haplotype:The six additional alleles matching the restriction pattern a positively selected site, this can be used as a test for
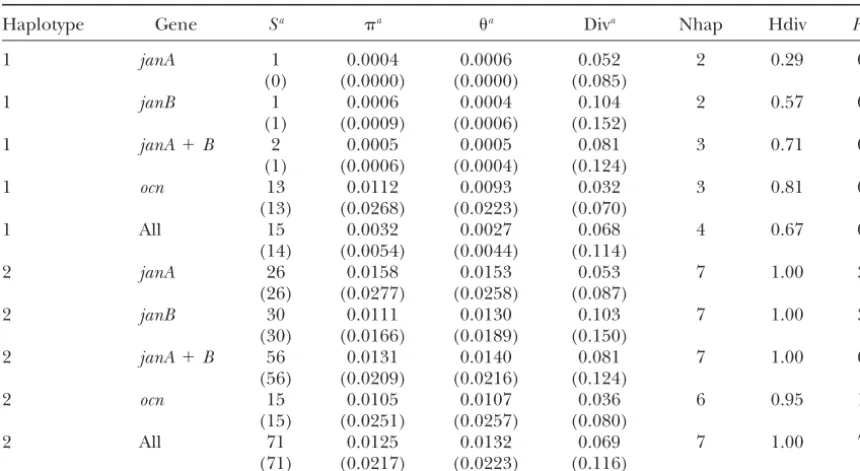
genetic hitchhiking (Fay and Wu 2000). Our results of haplotype 2 were completely sequenced over the janA-ocn region and compared to the original s3 se-indicate that H is significantly negative for janA and
janBand also for the combined janA-janB region and quence. This revealed a total of 71 SNPs and 3 indel polymorphisms (Figure 3). All of the polymorphisms the entire janA-ocn region (Table 1). Although H is
not significantly negative for theocngene by itself, the occurred at silent or noncoding sites. Levels of nucleo-tide polymorphism within haplotype 2 were typical ofD. commonocnhaplotype does show the derived state at
8 of 13 SNP sites and at both of the indel sites (Figure simulansautosomal loci (MoriyamaandPowell1996; Table 4), and we found no significant departure from 2). These results suggest that the haplotype structure
observed in this region may be explained by previously neutrality by any of the statistical tests described above when applied to each gene separately, the entire region, rare variants being driven to high frequency due to their
linkage with a positively selected site. or to the combinedjanA-janBregion (data not shown). The amount of polymorphism in the janA and janB Restriction survey: To further investigate the
haplo-type structure in this region of the genome, we surveyed genes within haplotype 2 is nearly 30-fold greater than that within haplotype 1 (Table 4), suggesting that haplo-restriction site polymorphism in an additional 28 lines
collected from a worldwide distribution. On the basis type 2 is ancestral. The ancestral state of haplotype 2 is also supported by the neighbor-joining tree shown in of our initial sequencing, we chose five polymorphisms
that resulted in either the gain or loss of a restriction site. Figure 4, where the haplotype 1 alleles form a single clade within the haplotype 2 alleles. The separate evolu-The first two polymorphisms [BstYI(246) andRsaI(1291)]
span thejanA-janBregion and distinguish the s3 allele tionary histories of these alleles over thejanA-janBand ocn genes further indicate recombination between the from all others. Furthermore, these were sites at which
the s3 allele matched theD. melanogaster outgroup se- janB andocn genes. For example, the s3 allele differs substantially from the common haplotype overjanAand quence, suggesting that the rare variant represents the
ancestral state. We also surveyed anRsaI polymorphism janBbut is identical to the most common haplotype at ocn(Figure 4).
at site 1452. This is the only site over the janA-janB region that is not a singleton and represents a derived polymorphism segregating within the common
haplo-DISCUSSION type (Figure 2). The final two restriction site
polymor-phisms [MluI(1836) andFokI(2164)] span theocngene. Our survey of nucleotide polymorphism in the janA-ocn region of D. simulans reveals two noteworthy fea-The former polymorphism distinguishes the s5 and s7
alleles from all others, while the latter distinguishes s5, tures. First, we detect strong linkage disequilibrium be-tween variants in thejanAandjanBgenes, which results s7, and s8 from all others. In both cases, the less frequent
variant matches the D. melanogaster sequence. A sum- from the segregation of variation in two divergent haplo-types. There are 13 fixed differences between the two mary of restriction site polymorphism is shown in Table
2. Over thejanA-janBregion, we found 27 alleles match- haplotypes. The common haplotype, designated here as haplotype 1, has an estimated frequency of 75% and ing the common haplotype and 7 alleles matching the
rare haplotype (i.e., a restriction pattern identical to s3). is present in worldwide populations. The rare haplotype, designated as haplotype 2, is present in several geo-Two alleles (s24 and s35) appear to be recombinants.
Overall, the strongest linkage disequilibrium was be- graphically distinct regions but appears to be more fre-quent in populations from central/southern Africa and tween site 246 injanAand site 1291 injanB(Table 3).
The restriction pattern at these two sites was used as a the Pacific rim (Table 2). A recent report of nucleotide variation in thejanus region of threeD.simulanslines diagnostic to classify the alleles as either haplotype 1 or
Figure3.—Segregating sites in seven D. simulans lines matching the restriction pat-tern of haplotype 2. m1 repre-sents the D. melanogaster out-group sequence. Dots indicate a match to the s3 sequence. Gaps are indicated by dashes. Insertions are indicated by “i” and represent sequences of 23, 2, and 7 bp beginning at sites 266, 1499, and 1568, respec-tively.
results, as all three matched haplotype 2 at the diagnos- haplotype structures at a number of loci, includingSod (Hudsonet al. 1994),white(KirbyandStephan1995, tic sites. The second noteworthy feature of our data is
that levels of nucleotide polymorphism among alleles 1996),Suppressor of Hairless(Depauliset al. 1999),Fbp2 (Be´nassiet al. 1999), and the region spanning the proxi-of the common haplotype are greatly reduced in
com-parison to alleles of the rare haplotype. The latter show mal breakpoint of the chromosomal inversion In(2L)t (Andolfatto et al. 1999). In D. simulans, nonneutral levels of polymorphism typical forD.simulansautosomal
genes, while the former show a nearly 30-fold reduction haplotype structures have been reported forPgd(Begun and Aquadro 1994), runt (Labate et al.1999), G6pd in polymorphism. Previous surveys of DNA sequence
variation in D. melanogaster have revealed nonneutral and vermilion (Hamblin and Veuille 1999), and the
Figure
TABLE 4
Summary statistics for haplotypes 1 and 2 (seven alleles each)
Haplotype Gene Sa a a Diva Nhap Hdiv R
m
1 janA 1 0.0004 0.0006 0.052 2 0.29 0
(0) (0.0000) (0.0000) (0.085)
1 janB 1 0.0006 0.0004 0.104 2 0.57 0
(1) (0.0009) (0.0006) (0.152)
1 janA⫹B 2 0.0005 0.0005 0.081 3 0.71 0
(1) (0.0006) (0.0004) (0.124)
1 ocn 13 0.0112 0.0093 0.032 3 0.81 0
(13) (0.0268) (0.0223) (0.070)
1 All 15 0.0032 0.0027 0.068 4 0.67 0
(14) (0.0054) (0.0044) (0.114)
2 janA 26 0.0158 0.0153 0.053 7 1.00 3
(26) (0.0277) (0.0258) (0.087)
2 janB 30 0.0111 0.0130 0.103 7 1.00 3
(30) (0.0166) (0.0189) (0.150)
2 janA⫹B 56 0.0131 0.0140 0.081 7 1.00 6
(56) (0.0209) (0.0216) (0.124)
2 ocn 15 0.0105 0.0107 0.036 6 0.95 1
(15) (0.0251) (0.0257) (0.080)
2 All 71 0.0125 0.0132 0.069 7 1.00 7
(71) (0.0217) (0.0223) (0.116)
Symbols and abbreviations are the same as in Table 1; Div, average pairwise divergence fromD. melanogaster; Rm, the minimum number of recombination events (HudsonandKaplan1985) inferred from theD. simulans polymorphism data.
aValues in parentheses are for silent⫹noncoding sites only.
In(2L)tbreakpoint (AndolfattoandKreitman2000). to be reduced in certain chromosomal regions, particu-larly those flanking centromeres and telomeres ( Lind-In addition,Andolfatto andPrzeworski(2000)
re-port that for an unexpectedly high number ofD.melano- sleyandSandler1977). Since the janA-ocn region is near the tip of chromosome arm 3R, this is a possibility. gasterandD.simulansloci that have been surveyed, there
is a discordance between the recombination rate in- However, several observations argue against reduced recombination being the cause of the observed haplo-ferred from population surveys and that from
experi-mental mapping, with the experiexperi-mental rates being type structure. First, a comparison of the physical and genetic distances for loci on the third chromosome higher. This can be interpreted as a genome-wide excess
of linkage disequilibrium, although note that this crite- (Hamblin andAquadro1996) indicates that there is not a great reduction in recombination in this region rion for detecting linkage disequilibrium is not as strict
as many of the haplotype tests that assumed no recombi- in D.simulans. Second, a worldwide sample of nine al-leles of the Tpi locus (Hasson et al. 1998), which is nation. Below we consider some genetic and
evolution-ary forces that may affect the distribution of variants at located distal toocnon chromosome 3R, shows no depar-ture from neutrality by the haplotype number, haplo-segregating sites in a population and discuss whether
or not they can explain the patterns observed in the type diversity, or Hudson’s haplotype test as implemented in this article. Third, there is ample evidence for recom-janA-ocnregion.
One potential cause of strong linkage disequilibrium bination within thejanA-ocnregion in haplotype 2 (Fig-ure 3). From the distribution of segregating sites in the over an extended region of DNA sequence is a severe
reduction in the rate of recombination. For example, seven alleles of haplotype 2 we infer a minimum of seven recombination events by the method of Hudson and recombination rates are known to be reduced in regions
containing chromosomal inversions. To eliminate this Kaplan (1985), six of which fall within the janA-janB region (Table 4). Finally, the probabilities associated possibility, we performedin situhybridizations of a
janA-ocnprobe to polytene chromosomes of several represen- with all of the statistical tests in Table 1 were estimated from coalescent simulations under the conservative as-tative lines from each haplotype to ensure that the genes
were at the same cytological location in both haplotypes. sumption of no recombination. Thus, even in the ex-treme case of zero recombination, the observed data In addition, we examined Giemsa-stained polytene
chro-mosomes of the remaining lines of each haplotype and differ significantly from the neutral expectation. The presence of two divergent haplotypes could also saw no evidence for inversion polymorphism in this
popula-Figure5.—Comparison of DNA poly-morphism atjanA(open triangles),janB (open squares), and ocn(open circles) with 19 otherD. simulansloci (solid cir-cles) spanning chromosome arm 3R. (A) Two measures of nucleotide polymor-phism (synandsyn) at synonymous sites. (B) Synonymous nucleotide polymor-phism divided by interspecific diver-gence, whereDsynis the average pairwise divergence at synonymous sites of the original eight D. simulans alleles from the outgroup D. melanogastersequence.
(C) Tajima’s (1989) D statistic. (D)
Probability ofH(FayandWu2000) and sub(i,j) (Hudsonet al. 1994) shown on a log scale. In D, only loci with a sample sizeⱖ8 are shown.
tion subdivision, changes in population size, or founder morphism within the common haplotype). A compari-son of DNA polymorphism atjanA,janB, andocnwith effects. A survey of nucleotide polymorphism in the
vermilion and G6pd genes detected significant popula- other D. simulans third chromosome loci studied by Begun and Whitley (2000) is relevant to these two tion subdivision withinD.simulans, particularly among
African populations (HamblinandVeuille1999). Pop- points. Figure 5 shows the distribution of several statis-tics for 19 loci on chromosome arm 3R (see Table 1 of ulation subdivision is also indicated by the presence of
distinct mitochondrial races within the species (Baba- Begun and Whitley 2000) as well as for janA, janB, andocn. All three of these genes show low levels of silent Aissaet al. 1988). Although these results indicate thatD.
simulanslikely departs from the standard demographic DNA polymorphism (Figure 5A). For example, thejanB gene has lower values of syn and syn than any of the assumption of panmixis, it is unlikely that demographics
alone can explain the pattern of nucleotide polymor- other genes.janAandocnare also among the lowest for these values (Figure 5A). The low variability observed phism in the janA-ocn region. This is because
demo-graphic forces are expected to affect the entire genome, in these genes cannot be caused by reduced mutation rates in this region of the genome or by unusually strong not just particular loci, and when compared with
pre-viously sequenced loci the janA-ocn region appears to selective constraints, as measures of nucleotide variabil-ity are low in these genes even when standardized by inter-be unusual (see inter-below). Furthermore, a demographic
poly-Whitley(2000) strengthen support for the conclusion tion seems unlikely because there are many linked sites overjanAandjanBand all of the segregating sites that that thejanA-ocnregion is unusual among chromosome
3R loci. Most of the genes in Begun and Whitley’s study distinguish the two haplotypes are at silent or noncoding positions. One possibility is that epistatic selection is were sampled from a single California population
(al-though two notable exceptions are discussed below), acting at silent or noncoding sites to maintain mRNA or pre-mRNA secondary structures. Such interactions whereas our data are from a worldwide sampling ofD.
simulans. If there is population subdivision, one would have been proposed to explain patterns of linkage dis-equilibria in theAdhgene ofD.pseudoobscura(Kirbyet expect that increasing the geographical scope of a
sam-ple would increase, not decrease, the observed level of al. 1995). However, we find no evidence for strongly conserved RNA secondary structures in either janAor nucleotide polymorphism. In this respect, comparison
of our data to Begun and Whitley’s is conservative. In janB, using the comparative method of Parsch et al. (2000).
addition, none of the other third chromosome loci show
a significant departure from neutrality by any of the Finally we consider a model of genetic hitchhiking (Maynard Smith andHaigh1974), in which neutral statistical tests used in this study. This is illustrated by
the distributions of Tajima’sD(Figure 5C), the probabil- variants are driven to high frequency in a population due to their linkage with a positively selected variant. ity of Fay and Wu’sH,and the probability of Hudson’s
haplotype test (Figure 5D). For the latter two quantities, If selection is strong or recombination is low, hitchhik-ing will result in a “selective sweep” that removes varia-only loci with a sample sizeⱖ8 are shown because the
power to detect significant results with these tests in- tion in the region flanking the selected site (Kaplanet al. 1989;Stephanet al. 1992). A reduction in polymor-creases with sample size. However, it should be noted
that none of the loci with sample size ⬍8 showed a phism is also expected under a model of “background selection” (Charlesworthet al. 1993), in which neutral significant departure from neutrality. Of course, if there
is population subdivision then the comparisons in Fig- variants are removed from the population due to the recurrent action of purifying selection at tightly linked ure 5, C and D, could be misleading due to the different
sampling schemes used for the different loci. However, sites. Several features of our data are consistent with the selective sweep hypothesis. For example, genetic if one invokes population subdivision to explain the
divergent haplotypes it becomes difficult to explain the hitchhiking is expected to affect the frequency distribu-tion of variants at segregating sites such that derived low levels of polymorphism within haplotype 1. The
most obvious way to divide the sample under a popula- variants will be in higher frequency than expected under a neutral equilibrium model (Fayand Wu2000; Kim tion subdivision model would be to consider all of the
haplotype 1 alleles as a single population. When this is andStephan2000). The significantly negative value of Fay and Wu’sHin thejanA-janBregion (Table 1) agrees done the level of polymorphism injanAandjanBdrops
to nearly zero (see Table 4). Thus, the comparison of with this prediction. Genetic hitchhiking is also ex-pected to skew the frequency distribution of variants at variability among 3R loci would be even more extreme
than shown in Figure 5, A and B, and would argue segregating sites toward rare alleles, resulting in a sig-nificantly negative value of Tajima’s D(Bravermanet against a purely demographic explanation of the data.
Although thejanA-janBregion shows the most extreme al. 1995). We find that Tajima’sDis significantly nega-tive forjanAandjanB(Table 1). This is due to the large haplotype structure of loci on chromosome 3R, some
loci on the X chromosome show a similar pattern (La- number of unique variants in our sample (Figure 2). However, many of these singletons can be inferred to be bateet al. 1999;BegunandWhitley2000). In general,
it appears that the amount of variation on the X chromo- ancestral from theD.melanogasteroutgroup sequence, so the negative Tajima’sDis not caused by new mutations some is lower than that on the autosomes, while the
amount of linkage disequilibrium on the X is higher occurring after a complete selective sweep as modeled by Braverman et al. (1995). This is confirmed by the (AndolfattoandPrzeworski2000;Begunand
Whit-ley2000). This difference is larger than expected even tests ofFuandLi(1993) that use an outgroup to identify derived singletons and do not produce a significant after correcting for the different effective population
sizes of the X and the autosomes and may be explained result when applied to ourjanA-janBdata (D⫽ ⫺0.34, P ⬎0.10;F⫽ ⫺0.88,P⬎ 0.10).
by stronger selection on X-linked loci (Begunand
Whit-ley2000). Although a selective sweep can explain the low level
of polymorphism within haplotype 1 and the high fre-Another potential explanation for the maintenance
of two divergent haplotypes in a population is balancing quency of many derived variants, it does not explain the presence of the highly divergent haplotype 2, which selection. However, the very low levels of nucleotide
polymorphism within haplotype 1 are inconsistent with shows a normal level of polymorphism. One possibility is that the selective sweep is either temporally or spatially this being an old balanced polymorphism. It is also
possible that strong linkage disequilibria are maintained incomplete (Hudsonet al. 1994, 1997), perhaps due to limited gene flow into ancestral African populations. It by epistatic selection favoring combinations of
at different sites in the two haplotypes, and fixation of a LITERATURE CITED
single haplotype is delayed until a recombination event Andolfatto, P., andM. Kreitman, 2000 Molecular variation at
theIn(2L)tproximal breakpoint site in natural populations of
brings the two variants together on the same
chromo-Drosophila melanogasterandD.simulans. Genetics154:1681–1691.
some (the “traffic” model;KirbyandStephan 1996).
Andolfatto, P., andM. Przeworski, 2000 A genome-wide
depar-A final possibility is that the positively selected site re- ture from the standard neutral model in natural populations of Drosophila. Genetics156:257–268.
sponsible for the hitchhiking event lies proximal to the
Andolfatto, P., J. D. WallandM. Kreitman, 1999 Unusual
haplo-janA gene, and there has been limited recombination type structure at the proximal breakpoint ofIn(2L)tin a natural between this unknown site andjanA. Our results indi- population ofDrosophila melanogaster. Genetics153:1297–1311.
Ayala, F. J., andD. L. Hartl, 1993 Molecular drift of thebride of
cate that distally the haplotype structure is broken in
sevenless(boss) gene inDrosophila. Mol. Biol. Evol.10:1030–1040.
the intergenic region betweenjanBandocn. However, Ayala, F. J., B. S. ChangandD. L. Hartl, 1993 Molecular evolution the strong linkage disequilibrium in the janA-janBre- of theRh3gene inDrosophila. Genetica92:23–32.
Baba-Aissa, F., M. Solignac, N. DennebouyandJ. R. David, 1988
gion does not allow us to define the proximal limit of
Mitochondrial DNA variability inDrosophila simulans: quasi
ab-the haplotype structure. Two of ab-the chromosome 3R sence of polymorphism within each of the three cytoplasmic loci included inBegunandWhitley’s(2000) study,Rh3 races. Heredity61:419–426.
Begun, D. J., and C. F. Aquadro, 1994 Evolutionary inferences
(Ayalaet al. 1993) andboss(AyalaandHartl1993),
from DNA variation at the6-phosphogluconate dehydrogenaselocus
were sampled from a worldwide distribution and in- in natural populations of Drosophila: selection and geographic
differentiation. Genetics136:155–171.
cluded some of the same lines used in our study. Both
Begun, D. J., andP. Whitley, 2000 Reduced X-linked nucleotide
of these loci show high levels of variation relative to
polymorphism inDrosophila simulans. Proc. Natl. Acad. Sci. USA
other loci on chromosome 3R and show no sign of 97:5960–5965.
Be´nassi, V., F. Depaulis, G. K. MeghlaouiandM. Veuille, 1999
haplotype structure. In particular, the line s3
(desig-Partial sweeping of variation at theFbp2locus in a west African
nated as “f ” in those articles), which shows a quite diver- population of
Drosophila melanogaster. Mol. Biol. Evol.16:347–353.
gent haplotype over thejanA-janBregion in our survey Braverman, J. M., R. R. Hudson, N. L. Kaplan, C. H. Langleyand
W. Stephan, 1995 The hitchhiking effect on the site frequency
(Figure 2), does not show this same pattern atRh3or
spectrum of DNA polymorphisms. Genetics140:783–796.
boss. Both of these loci lie proximal tojanA, with boss Charlesworth, B., M. T. MorganandD. Charlesworth, 1993 being relatively close at 96F. The observation of high The effect of deleterious mutations on neutral molecular
varia-tion. Genetics134:1289–1303.
variation and no haplotype structure atbossagain argues
Civetta, A., andR. S. Singh, 1998 Sex-related genes, directional
against a purely demographic explanation for our data sexual selection, and speciation. Mol. Biol. Evol.15:901–909. and indicates that the unusual haplotype structure does Depaulis, F., andM. Veuille, 1998 Neutrality tests based on the
distribution of haplotypes under an infinite-site model. Mol. Biol.
not extend over a large portion of the chromosome. It
Evol.15:1788–1790.
is tempting to speculate that the janB gene may be a Depaulis, F., L. Brazier and M. Veuille, 1999 Selective sweep
at theDrosophila melanogaster Suppressor of Hairlesslocus and its
target of positive selection. Our previous work showed
association with theIn(2L)tinversion polymorphism. Genetics
that within the D. melanogaster species subgroup janB
152:1017–1024.
has a faster rate of evolution thanjanAorocn(Parsch FayJ. C., and C .-IWu, 2000 Hitchhiking under positive Darwinian
selection. Genetics155:1405–1413.
et al. 2001).janBis also the most divergent of these genes
Fu, Y.-X., and W.-H.Li, 1993 Statistical tests of neutrality of
muta-in a comparison betweenD.simulansandD.melanogaster
tions. Genetics133:693–709.
(Table 4). In addition, janBshows the lowest level of Hamblin, M. T., and C. F. Aquadro, 1996 High nucleotide se-quence variation in a region of low recombination inDrosophila
within-species polymorphism (Table 1). This
combina-simulansis consistent with the background selection model. Mol.
tion of high divergence and low polymorphism is sugges- Biol. Evol.13:1133–1140.
tive of positive selection. However, further surveys of Hamblin, M. T., andM. Veuille, 1999 Population structure among African and derived populations ofDrosophila simulans: evidence
DNA sequence polymorphism in this region of the
ge-for ancient subdivision and recent admixture. Genetics153:305–
nome are required to identify the selected site or sites 317.
and allow estimation of the selection coefficient associ- Hasson, E., I. N.Wang, L. W.Zeng, M.Kreitmanand W. F.Eanes, 1998 Nucleotide variation in thetriosephosphate isomerase(Tpi)
ated with the hitchhiking event.
locus ofDrosophila melanogasterandDrosophila simulans. Mol. Biol. We thank J. Braverman and J. Fay for providing computer programs Evol.15:756–769.
Hudson, R. R., 1990 Gene geneologies and the coalescent process, and P. Capy and Y. Tao for providingD. simulans stocks. We are
pp. 1–44 inOxford Surveys in Evolutionary Biology, Vol. 7, edited grateful to W. Stephan and members of the D. Hartl and J. Wakeley
by D. Futuymaand J.Antonovics. Oxford University Press, labs for valuable suggestions throughout the course of our work. We
Oxford.
also thank M. Aguade´ and two anonymous reviewers for comments Hudson, R. R., andN. L. Kaplan, 1985 Statistical properties of the on an earlier version of the manuscript. This work was supported by number of recombination events in the history of a sample of National Institutes of Health grants GM60035 and HG01250 to D.L.H. DNA sequences. Genetics111:147–164.
Hudson, R. R., K. Bailey, D. Skarecky, J. KwiatowskiandF. J. Ayala, 1994 Evidence for positive selection in the superoxide
Note added in proof: Following the submission of this manuscript,
dismutase (Sod) region ofDrosophila melanogaster. Genetics136: Rozaset al.(Rozas, J., M. Gullaud, G. BlandinandM. Aguade´,
1329–1340. 2001, DNA variation at therp49gene region ofDrosophila simulans:
Hudson, R. R., A. G. Sa´ezandF. J. Ayala, 1997 DNA variation at evolutionary inferences from an unusual haplotype structure. Genetics theSod locus ofDrosophila melanogaster: an unfolding story of
158:1147–1155) reported unusual haplotype structure in therp49 natural selection. Proc. Natl. Acad. Sci. USA94:7725–7729.
gene region in both a European and an African population ofD. simulans. Kaplan, N. L., R. R. HudsonandC. H. Langley, 1989 The “hitch-hiking effect” revisited. Genetics123:887–899.
Kim, Y., andW. Stephan, 2000 Joint effects of genetic hitchhiking janusgenes in theDrosophila melanogasterspecies subgroup. Mol. Biol. Evol.18:801–811.
and background selection on neutral variation. Genetics 155:
1415–1427. Rozas, J., andR. Rozas, 1999 DnaSP version 3: an integrated pro-gram for molecular population genetics and molecular evolution
Kimura, M., 1956 A model of a genetic system which leads to closer
linkage by natural selection. Evolution10:278–287. analysis. Bioinformatics15:174–175.
Russo, C. A. M., N. TakezakiandM. Nei, 1995 Molecular phylogeny
Kirby, D. A., and W.Stephan, 1995 Haplotype test reveals departure
from neutrality in a segment of thewhitegene ofDrosophila melano- and divergence times of Drosophilid species. Mol. Biol. Evol.12:
391–404.
gaster. Genetics141:1483–1490.
Kirby, D. A., andW. Stephan, 1996 Multi-locus selection and the Sambrook, J., E. F. FritschandT. Maniatis, 1989 Molecular Clon-ing: A Laboratory Manual, Ed. 2. Cold Spring Harbor Laboratory structure of variation at thewhitegene ofDrosophila melanogaster.
Genetics144:635–645. Press, Cold Spring Harbor, NY.
Stephan, W., T. H. E. WieheandM. W. Lenz, 1992 The effect of
Kirby, D. A., S. V. MuseandW. Stephan, 1995 Maintenance of
pre-mRNA secondary structure by epistatic selection. Proc. Natl. strongly selected substitutions on neutral polymorphism: analyti-cal results based on diffusion theory. Theor. Popul. Biol. 41:
Acad. Sci. USA92:9047–9051.
Kliman, R. M., P. Andolfatto, J. A. Coyne, F. Depaulis, M. Kreit- 237–254.
Tajima, F., 1989 Statistical method for testing the neutral mutation
man et al., 2000 The population genetics of the origin and
divergence of theDrosophila simulanscomplex species. Genetics hypothesis by DNA polymorphism. Genetics123:585–595.
Tsaur, S.-C., andC.-I. Wu, 1997 Positive selection and the molecular
156:1913–1931.
Labate, J. A., C. H. BiermannandW. F. Eanes, 1999 Nucleotide evolution of a gene of male reproduction,Acp26AaofDrosophila. Mol. Biol. Evol.14:544–549.
variation at theruntlocus inDrosophila melanogasterandDrosophila
simulans. Mol. Biol. Evol.16:724–731. Watterson, G. A., 1975 On the number of segregating sites in genetical models without recombination. Theor. Popul. Biol.7: Lewontin, R. C., 1974 The Genetic Basis of Evolutionary Change.
Co-lumbia University Press, New York. 256–276.
Yanicostas, C., and J.-A.Lepesant, 1990 Transcriptional and
trans-Lindsley, D. L., andL. Sandler, 1977 The genetic analysis of
meio-sis in femaleDrosophila melanogaster. Philos. Trans. R. Soc. Lond. lationalcis-regulatory sequences of the spermatocyte-specific Dro-sophila janusBgene are located in the 3⬘exonic region of the Ser. B277:295–312.
Maynard Smith, J., andJ. Haigh, 1974 The hitch-hiking effect of overlappingjanusAgene. Mol. Gen. Genet.224:450–458. a favourable gene. Genet. Res.23:23–35. Yanicostas, C., A. Vincentand J.-A. Lepesant, 1989
Transcrip-Moriyama, E. N., andJ. R. Powell, 1996 Intraspecific nuclear DNA tional and posttranscriptional regulation contributes to the sex-variation inDrosophila. Mol. Biol. Evol.13:261–277. regulated expression of two sequence-related genes at the janus
Nei, M., 1987 Molecular Evolutionary Genetics. Columbia University locus ofDrosophila melanogaster. Mol. Cell. Biol.9:2526–2535. Press, New York. Yanicostas, C., P. Ferrer, A.Vincent and J.-A. Lepesant, 1995
Parsch, J., J. M. BravermanandW. Stephan, 2000 Comparative Separatecis-regulatory sequences control expression ofserendipity
sequence analysis and patterns of covariation in RNA secondary andjanus A, two immediately adjacentDrosophilagenes. Mol. structures. Genetics154:909–921. Gen. Genet.246:549–560.
Parsch, J., C. D. Meiklejohn, E. Hauschteck-Jungen, P. Hunziker