DOI: 10.1534/genetics.105.047126
DNA Sequence Variation and Selection of Tag Single-Nucleotide
Polymorphisms at Candidate Genes for Drought-Stress
Response in
Pinus taeda
L.
Santiago C. Gonza´lez-Martı´nez,*
,†Elhan Ersoz,* Garth R. Brown,* Nicholas C. Wheeler
‡,1and David B. Neale*
,§,2*Department of Plant Sciences, University of California, Davis, California 95616,†Department of Forest Systems and Resources, Forest Research Institute, CIFOR-INIA, 28040 Madrid, Spain,‡Weyerhaeuser Company, Weyerhaeuser Technical Center, Tacoma, Washington 98477 and
§Institute of Forest Genetics, USDA Forest Service, Davis, California 95616
Manuscript received June 21, 2005 Accepted for publication December 18, 2005
ABSTRACT
Genetic association studies are rapidly becoming the experimental approach of choice to dissect complex traits, including tolerance to drought stress, which is the most common cause of mortality and yield losses in forest trees. Optimization of association mapping requires knowledge of the patterns of nucleotide diversity and linkage disequilibrium and the selection of suitable polymorphisms for genotyping. Moreover, standard neutrality tests applied to DNA sequence variation data can be used to select candidate genes or amino acid sites that are putatively under selection for association mapping. In this article, we study the pattern of polymorphism of 18 candidate genes for drought-stress response in Pinus taeda L., an important tree crop. Data analyses based on a set of 21 putatively neutral nuclear microsatellites did not show population genetic structure or genomewide departures from neutrality. Candidate genes had moderate average nucleotide diversity at silent sites (psil¼0.00853), varying 100-fold
among single genes. The level of within-gene LD was low, with an average pairwiser2of 0.30, decaying
rapidly from0.50 to0.20 at 800 bp. No apparent LD among genes was found. A selective sweep may have occurred at theearly-response-to-drought-3(erd3) gene, although population expansion can also explain our results and evidence for selection was not conclusive. One other gene, ccoaomt-1, a methylating enzyme involved in lignification, showed dimorphism (i.e., two highly divergent haplotype lineages at equal frequency), which is commonly associated with the long-term action of balancing selection. Finally, a set of haplotype-tagging SNPs (htSNPs) was selected. Using htSNPs, a reduction of genotyping effort of 30–40%, while sampling most common allelic variants, can be gained in our ongoing association studies for drought tolerance in pine.
T
HE neutral theory of molecular evolution statesthat nucleotide diversity is governed by the
pop-ulation mutation parameter 4Nem, where mis the
per-generation, per-site mutation rate. Over the past 2 decades, identification of candidate genes under selection in natural populations has relied on the analysis of nu-cleotide diversity patterns within and between species and departures of allele (haplotype) distributions from
neutral expectations (i.e., neutrality tests; see reviews in
Kreitman2000; Ford2002; Rosenbergand Nordborg
2002). Two major patterns emerged from these analyses in a wide range of genes and organisms. One type of loci showed an excess of intermediate-frequency
haplo-types, frequently arranged around two highly divergent
lineages (e.g., Filatovand Charlesworth1999; Tian
et al. 2002), and the other was characterized by an excess
of rare haplotypes (e.g., Olsenet al. 2002; see Potet al.
2005 for pine). These departures of the site-frequency spectrum from the neutral expectation, as long as they were not due to demography or population structure, were associated with balancing selection and with puri-fying selection or selective sweeps caused by positive selection, respectively.
Genetic association between allelic variants and trait differences on a population scale is a powerful, and rel-atively recent, approach to identifying genes or alleles
that contribute to variation in adaptive traits (Longand
Langley 1999; see Neale and Savolainen 2004 for
conifers). Population stratification is the most common
source of systematic bias in association studies (Buckler
and Thornsberry2002; Hirschhornand Daly2005).
Putatively neutral molecular markers, such as nuclear microsatellites, are generally used to detect popula-tion structure and other populapopula-tion and demographic
Sequence data from this article have been deposited with the EMBL/ GenBank Data Libraries (PopSet) under accession nos. AY867503– AY867790 and AY874544–AY874831.
1Present address: Molecular Tree Breeding Services, Centralia, WA
98531.
2Corresponding author:Institute of Forest Genetics, USDA Forest Service,
Department of Plant Sciences, University of California, 1 Shields Ave., Davis, CA 95616. E-mail: [email protected]
processes that might produce false positives in
associa-tion studies (Rosenberg et al. 2002). Optimization of
association mapping requires knowledge of the patterns of nucleotide diversity and linkage disequilibrium for each particular species and candidate gene set. In ad-dition, standard neutrality tests applied to DNA sequen-ces of a single or a few gene(s) can be used in selecting candidate genes or amino acid sites that are putatively under selection for association mapping.
Forest trees play a crucial role in terrestrial ecosystems, offering major ecological benefits in terms of climate control, carbon fixation, and wildlife maintenance. Drought stress is the most common cause of tree mortality and is responsible for severe annual yield
losses in commercial species (up to65% inPinus taeda
L.; Burnsand Honkala1990). Understanding the
phys-iological mechanisms and the genetic basis of drought-stress tolerance has been a long-standing interest for
plant biologists (e.g., Ingramand Bartels 1996; Seki
et al. 2003; see Newton et al. 1991 for forest trees). However, progress on identification of drought-related genes and development of expressional studies in forest
trees are relatively recent (Changet al.1996; Dubosand
Plomion2003; Watkinsonet al.2003). The molecular
basis of dehydration tolerance in trees is extremely complex and a wide variety of expressional candidate genes has been suggested. Increased expression of dehydrins has been found in different conifer trees
during both seed development (Jarviset al.1996) and
drought stress (Richardet al. 2000; Watkinsonet al.
2003). Changet al. (1996), using a subtractive
hybrid-ization approach, identified four cDNA clones with
drought-induced expression inP. taeda:lp2, with a high
homology to S-adenosylmethionine synthetase (sams), an
intermediate in the synthesis of ethylene;lp3, expressed
predominantly in roots and later found to belong to a
small family of ABA-inducible genes (Padmanabhan
et al. 1997); lp4, similar to a type I copper-containing
glycoprotein; andlp5, expressed almost exclusively in
roots and coding for a glycine-rich protein similar to cell wall proteins. Other major expressional candidate genes for drought-stress response identified in trees encode
protein kinases (Dubosand Plomion2003; Duboset al.
2003), cysteine proteases (Tranbargerand Misra1996),
iron storage proteins (Liet al. 1998), antioxidants (Li
et al.1998; Karpinska et al. 2001), and
pathogenesis-related proteins (Dubos and Plomion 2001; Dubos
et al.2003).
Conifers are long-lived, widely distributed organisms that, in general, exhibit high levels of heterozygosity and large effective population sizes. Therefore, it has been suggested that conifers may show high levels of
nucle-otide variation (Dvornyket al.2002). However, the first
results on DNA sequence variation for conifers showed,
at best, moderate estimates of nucleotide diversity (e.g.,
Kado et al.2003; Brown et al.2004; Pot et al. 2005). Average population differentiation was also moderate in
conifers (Kadoet al. 2003; but see Pot et al. 2005 for
korriganandpp1genes), even when extreme phenotypes
were sampled (Garcı´a-Gil et al. 2003). For example,
Garcı´a-Gil et al. (2003) did not find any functional differentiation at the photosensory domains of two phytochrome loci among populations sampled along a latitudinal cline that was associated with marked differ-ences in growth phenology (as shown by common garden experiments). Patterns of nucleotide diversity and/or population differentiation that deviate from the neutral expectation, potentially indicating the action of natural selection, have been described only for a few
genes and tree species½acl5inCryptomeria japonica(L. f.)
D. Don (Kado et al. 2003); f3h1, 4cl1, and mt-like in
Pseudotsuga menziesii (Mirb.) Franco (Krutovsky and
Neale2005); andpp1,korrigan, andCesA3in pines (Pot
et al. 2005). Large effective population sizes in conifers would result in low linkage disequilibrium (LD) due to high recombination rates at the population level. This prediction agrees with empirical data in conifers, where lack of LD among genes and relatively rapid decay of LD within genes (200–1500 bp) have been observed (Brown et al. 2004; Rafalskiand Morgante 2004). However, it is possible but currently unknown if more extensive LD exists in particular tree species or popula-tions that experienced historical bottlenecks in Pleisto-cene glacial refugia, both in Europe and in America.
The standing variation in natural populations is pat-terned as a consequence of the interplay among genetic drift, demography, population structure, and natural selection. In this article, we used a data set of 21 nuclear microsatellites for detecting population structure and demographic processes that might cause spurious associations in association studies and bias neutrality tests, and sequenced all or portions of 18 candidate genes for
drought-stress response inP. taeda, an important tree
crop. Our sample covered the southeastern native range of P. taeda, including Florida, a putative Pleistocene
glacial refugium of this species (Schmidtling et al.
1999; Al-Rabab’ahand Williams2002), which was not
extensively sampled in our previous studies (see Brown
et al.2004). We have used DNA sequences to estimate levels of nucleotide diversity and linkage disequilib-rium, to identify candidate genes under selection (by means of neutrality tests), and to select haplotype-tagging single-nucleotide polymorphisms (htSNPs) for our current genetic association studies.
MATERIALS AND METHODS
S1 at http://www.genetics.org/supplemental/and nine second-generation selections produced by controlled crosses among first-generation selections within the Atlantic Coastal Plain provenance. These trees are currently part of the Forest Biology Research Cooperative (FBRC) Tree Improvement Program(University of Florida, Gainesville, FL). The second-generation trees may introduce a slight bias, due to the inclusion of four pairs of half-sibs and three trees that have first-generation selections as parents (see supplemental Table S1). However, because of the high levels of heterozygosity in this species and meiotic segregation, the bias is considered negligible.
Candidate gene selection: Candidate genes for drought-stress response were selected on the basis of (1) homology of contig assemblies ofP. taedaexpressed sequence tags (ESTs) in public databases (DDBJ/EMBL/GenBank) with drought-stress response genes in model species; (2) homology of sequences from the unigene set (20,500 nonredundant genes) assembled at North Carolina State University on the basis of six xylem EST libraries (accessed through http:// pinetree.ccgb.umn.edu/) with drought-stress response genes in model species; and (3) the overabundance of ESTs in root libraries fromP. taedatrees under drought stress compared to control trees as indicated by ‘‘electronic’’ Northerns using the MAGIC Gene Discovery tool (University of Georgia, http:// fungen.org/Projects/Pine/Pine.htm). Two other genes,ppap12 andlp3-3, were also selected because they showed differential expression under drought treatments as shown by reverse Northerns in P. pinaster (Dubos et al. 2003) and P. taeda
(Padmanabhanet al.1997), respectively.
DNA isolation, amplification, and sequencing: Haploid genomic DNA was extracted from megagametophytes, using the Plant DNeasy kit (QIAGEN, Valencia, CA) after seed germination. PCR primers were designed to amplify a 400-to 1000-bp fragment in nine nuclear loci and previously published primers were used for an additional nine genes (see supplemental Table S2 at http://www.genetics.org/ supplemental/). Primers were designed to amplify full-length genes for lp3-3, dhn-1, and dhn-2. Sequence data were ob-tained directly from PCR products on an ABI 377 automated sequencer, using the BigDye Terminator v. 3.1 cycle sequencing kit (Applied Biosystems, Foster City, CA). All samples were sequenced from both ends. Base calling and assembly of forward and reverse reads were done using phred and phrap programs (Ewing et al. 1998; Gordon et al. 1998; http://
bozeman.mbt.washington.edu/phredphrapconsed.html) un-der a Unix environment. Multiple alleles from a locus were aligned in the multiple-alignment consed extensions (MACE)
program (B. Gilliland and C. Langley, University of California, Davis, CA). All chromatograms were checked visually and a putative sequence variant was accepted only when the phred scores for all sequences exceeded 25 at that site. Resequencing was performed as needed to maintain this quality criterion. Since the DNA samples were haploid, the identification of haplotypes (i.e., alleles) was unambiguous.
Mapping of candidate genes:Six of the 18 candidate genes were mapped previously (Brownet al.2003). Mapping of the
remaining 12 loci was attempted using two reference mapping populations ofP. taeda, theqtlandbasepedigrees (details in Brownet al.2001). Five candidate genes (lp3-1,dhn-1,
rd21A-like,cpk3, andppap12) were mapped using denaturing gradient gels (DGGE) according to Temesgenet al. (2001) and 1 (lp3-3)
was mapped using a template-directed dye-termination in-corporation assay (TDI) with fluorescence polarization (FP) detection (TDI 59–39 primer: TTGCCAGTAGCATACACA TCTG). FP–TDI was done using the AcycloPrime-FP SNP detection kit and a Wallac VICTOR2fluorescence plate reader
(Perkin-Elmer Life and Analytical Sciences, Torrance, CA).
The other 6 candidate genes either were unlinked (sod-chl) or lacked suitable polymorphisms (i.e., parents of the pedigrees did not segregate for any SNP or primers for FP–TDI could not be designed due to the existence of repetitive regions near SNPs:ferritin,erd-3,dhn-2,lp5-like, andug-2_498). A consensus map was obtained together with other markers following Brownet al.(2001).
Population structure and demographic processes: Popula-tion stratificaPopula-tion is the most common systematic bias producing false-positive associations in association studies (Marchiniet al.
2004; Hirschhornand Daly2005). Moreover, the existence
of population genetic structure or demographic processes, such as range expansions or retreats, might produce signa-tures on the allele frequency spectrum similar to those produced by the action of natural selection and mislead the interpretation of standard neutrality tests, such as Tajima’sD. We used 21 highly polymorphic (average of 15 alleles per locus) nuclear microsatellites (nuSSRs), covering mostP. taedalinkage groups, to test for population structure or demographic pro-cesses. The nuSSR data were kindly provided by C. Dana Nelson (Southern Institute of Forest Genetics, U.S. Department of Agriculture) and included 94 trees sampled from roughly the same range as the sequence data presented here (see supple-mental Table S3 at http://www.genetics.org/supplesupple-mental/).
To test for population structure, we first used a model-based clustering algorithm (Structure software; Pritchardet al.2000;
Rosenberget al. 2002), which constructs groups of
popula-tions without any prior geographical information. Models with a putative number of clusters (Kparameter) from one to four, noncorrelated allele frequencies, and both burn-in, to mini-mize the effect of the starting configuration, and run-length periods of 106were run. Second, we computed genetic
differ-entiation estimates (F-statistics, based on a nested ANOVA following Weirand Cockerham1984) among the three
geo-graphical regions included in the sample (Gulf Coast, Northeast, and Southeast). Both a permutation test (10,000 permutations) and a jackknifed estimator over loci were used to test for significance of population genetic structure among regions.
To test for genomewide departures from neutrality, such as those produced by demographic processes, the Ewens– Watterson test of neutrality (Watterson 1978, 1986), with
probabilities calculated on the basis of both homozygosity and Fisher’s exact tests (Ewens–Watterson–Slatkin’s exact test; Slatkin 1994, 1996), was performed using the program
Arlequin v. 2000 (Schneideret al. 2000). The Ewens–Watterson
test enables the detection of deviations from the neutral model as either a deficit or an excess of homozygosity relative to the neutral equilibrium expectation, given the number of alleles found at a locus. It should be noted that homozygosity excess is a typical genomewide signature of population ex-pansion (Payseuret al.2002; Luikartet al. 2003). Once the
test was computed for each of the 21 nuSSR loci, a Mann– Whitney U-test was used to detect whether expected and observed homozygosity values were drawn from the same distribution. The Bonferroni correction for multiple testing was applied when necessary.
Nucleotide variation and neutrality tests: Analyses of se-quence data were performed using DnaSP v. 4.0 (Rozaset al.
2003). Nucleotide diversity was estimated by Watterson’s uw (Watterson 1975) andp, the average number of pairwise
nucleotide differences among sequences in a sample (Neiand
Li1979). Heterogeneity of sequence variation across loci was
assessed using coalescence simulations without recombina-tion. A number of statistical analyses were conducted to identify genes or amino acid sites departing from the standard neutral model of evolution. Tajima’s (1989) D-statistic was
sites, respectively). Tajima’sD-statistic reflects the difference between p and uw. At mutation–drift equilibrium, the ex-pected value of D is close to zero. The Fs-test statistic for
neutrality (Fu 1997), based on the haplotype (gene)
fre-quency distribution conditional on the value ofu(estimated byp), was also calculated. Both Tajima’sD- and Fu’sFs-test
statistics can also reflect demographic changes (Fu1997; Sano
and Tachida2005). To compute tests that required data from
an outgroup, putative orthologs of 14 genes were obtained fromP. pinaster, a European species that might have diverged fromP. taeda120 million years ago (Krupkinet al. 1996). For
8 genes, we used sequences from GenBank (accession nos.: AL751338,lp3-1; BX255067,dhn-1; BX677401,lp5-like; BX252032, sod-chl; BX681838,sams-2; AY641535,pal-1; CR393126,ccoaomt-1; and AJ309112, ppap12) and, for the other six, we used se-quences obtained directly fromP. pinastermegagametophyte DNA using the same primer pairs for sequencing as inP. taeda (genesdhn-2,rd21A-like,pp2c,Aqua-MIP,erd-3, andug-2_498; A. Sotoand M. T. Cervera, unpublished data). Then, we
computed: (1) Fay and Wu’sH-test (Fayand Wu2000), on the
basis of the relative excess of high-frequency-derived alleles expected immediately after a selective sweep; (2) the Hudson– Kreitman–Aguade´ (HKA) test (Hudson et al. 1987), which
tests for decoupling between polymorphism and divergence in a particular region; and (3) the McDonald–Kreitman (MK) test (McDonald and Kreitman 1991), on the basis of the
comparison of synonymous and nonsynonymous substitutions within and between species. HKA tests were done comparing each gene against every other one. Finally, to detect positive selection at single amino acid sites, we estimated the rates of nonsynonymous and synonymous changes at each site in a sequence alignment using likelihood-based methods as im-plemented in the on-line DataMonkey package (Kosakovsky
-Pondand Frost2005a,b). For these analyses, we used both a
conservative single-likelihood ancestor-counting (SLAC) method, related to that of Suzuki–Gojobori (Suzuki and
Gojobori1999), and a fixed-effects likelihood (FEL) method,
which directly estimates nonsynonymous and synonymous substitution rates at each site and is more adequate for data sets with a moderate number of sequences (n ¼ 20–40; Kosakovsky-Pondand Frost2005a).
LD, haplotype diversity, and selection of htSNPs for association mapping: The LD descriptive statistic r2 (Hill
and Robertson1968) was calculated, only on the basis of
in-formative sites (frequency of2
32¼0.063), using Tassel software
(http://www.maizegenetics.net/index.php?page¼bioinformatics/ tassel/index.html). Ther2 statistic summarizes both
recom-bination and mutation history and it is less sensitive to sample size than other common LD statistics such as D9 (Flint
-Garcı´aet al.2003). Statistical significance ofr2was computed
with a one-tailed Fisher’s exact test and applying Bonferroni corrections for multiple testing. The decay of linkage disequi-librium with physical distance was estimated using nonlinear regression of LD between polymorphic sites, as estimated byr2,
and the distance, in base pairs, between sites (Remingtonet al.
2001; Ingvarsson2005). To adjust the nonlinear function, we
used ther2expectation provided by Hilland Weir(1988) for
drift–recombination equilibrium with a low level of mutation and an adjustment for sample sizen,
Eðr2Þ ¼ 101C
ð21CÞð111CÞ
11ð31CÞð12112C1C
2Þ
nð21CÞð111CÞ
;
ð1Þ
whereC is the population recombination parameter. Equa-tion 1 was fitted using the Gauss–Newton algorithm imple-mented in the proc nlin of SAS v. 8.0 statistical package (SAS
Institute, Cary, NC). Haplotypic diversity (He) was computed
following Nei(1987). We identified htSNPs,i.e., those
repre-senting common allelic variants, on line using Haploblock-Finder software (Zhangand Jin2003; http://cgi.uc.edu/cgi-bin/
kzhang/haploBlockFinder.cgi/) and a threshold ofr2¼0.2 to
define LD blocks. Power in association studies (for a fixed sample size) is significantly reduced with low frequency of alleles (Wanget al. 2005). Then, htSNPs were selected
con-sidering minor allele frequencies (MAFs) corresponding only to common (MAF.5%) and frequent (MAF.15%) SNPs. Given the low level of LD found in pine, which resulted in short LD blocks, other approaches to identify htSNPs, such as the identification of LD subgroups within LD blocks (see Takeuchiet al. 2005 for details), did not perform well and are
not shown.
RESULTS
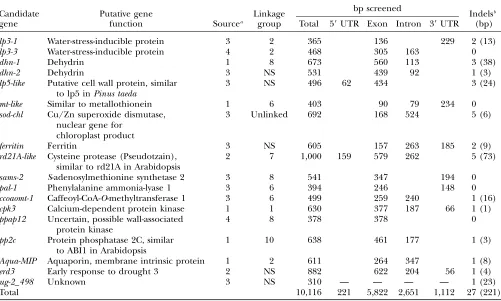
Thirty-two gametes were sequenced for each of 18
candidate gene loci, resulting in324 kb (32310,116
bp) of DNA sequence data (Table 1). Approximately 60% of the sequence data were obtained from coding regions. We found insertion/deletions (indels) in 13
genes, ranging from 1 to 67 bp (average of8 bp). Five
genes (dhn-1, dhn-2, lp5-like, rd21A-like, andpp2c) had
indels within the coding region, including a 30-bp indel in dhn-1. The lengths of indels within coding regions were multiples of 3 bp, so they did not result in a shift of reading frame. Finally, highly variable TA microsatellite
regions were observed in lp3-1 and ug-2_498 DNA
se-quences. Indels and microsatellite regions were excluded in further analyses.
Population structure and demographic processes:No
population structure or apparent demographic pro-cesses, such as range expansion, were found using 21 nuclear microsatellites. The model-based clustering ana-lyses showed a typical pattern of unstructured populations
(Pritchard and Wen 2004): plateaus in the estimate
of the log-likelihood of the data were not reached, the proportion of the sample assigned to each population was
roughly symmetric (forK¼3, for example, 30.3, 41.7, and
28.0% of samples were assigned to each group), and most individuals were given as admixed (see supplemental Figure S1 at http://www.genetics.org/supplemental/). Additional evidence of lack of population structure within the sampling range was provided by genetic differentia-tion estimates among the three geographical regions sam-pled in this study (Gulf Coast, Northeast, and Southeast).
Indeed, genetic differentiation was extremely low (Fst¼
0.0019) and nonsignificant as shown by both a jackknifed estimator over loci and a permutation test. The Ewens– Watterson test, after correcting for multiple testing using Bonferroni, was unable to detect any departure from neutrality, estimates of observed minus expected
homo-zygosity being distributed around zero (i.e., about equal
numbers of loci showing excess or deficit of
homozygos-ity). The Mann–WhitneyU-test could not reject the
(P ¼0.4311), also supporting the lack of genomewide departures from neutrality.
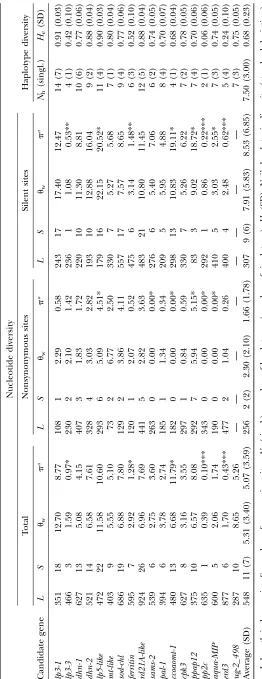
Nucleotide variation and neutrality tests:In total, we
found 196 segregating sites, corresponding to 1 SNP per 50 bp (Table 2 and supplemental Table S4 at http://
www.genetics.org/supplemental/). Two genes (
rd21A-likeand ccoaomt-1) had triallelic variants and the least frequent allele was recoded as missing data for further
analyses. Of the 196 segregating sites, 37 (20%) were
nonsynonymous substitutions. Average nucleotide
diver-sity at silent sites,psil, was 0.00853, fivefold the diversity
found at nonsynonymous sites (pa ¼ 0.00166).
Nu-cleotide variation was slightly higher at synonymous
sites than in noncoding regions (psyn¼ 0.00909 and
pnoncoding¼0.00631; see supplemental Table S4), but
these differences were not statistically significant. Aver-age frequency of the less common nucleotide variant was similar at silent and nonsynonymous sites (17.16 and 13.58%, respectively) and frequency distributions for silent and nonsynonymous sites were not
signifi-cantly different (P ¼ 0.7145, Kolmogorov–Smirnov
test). Coalescence simulations (implemented in DnaSP
v. 4.0) showed lower values ofptotthan the average for
lp3-3, ferritin, pp2c, and erd3 (Table 2). Nucleotide variation, all sites considered, was higher than the
average for only one gene,ccoaomt-1(0.01179).
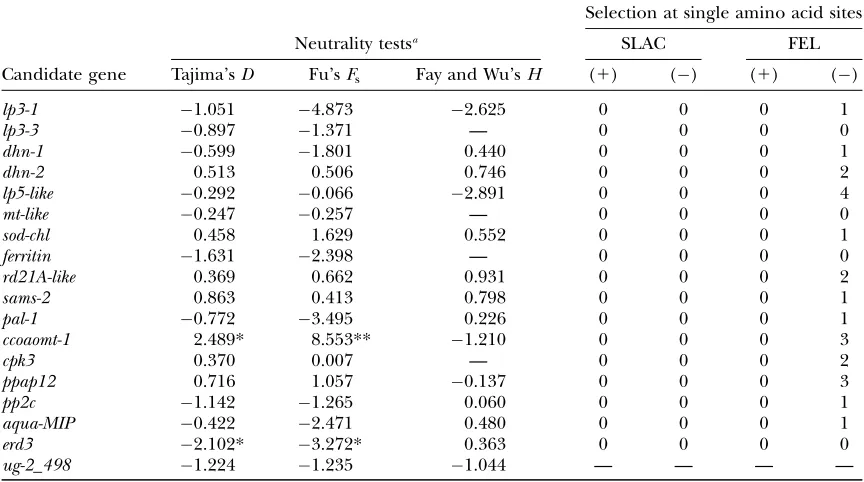
A number of neutrality tests were applied to find evidence of positive selection in our candidate gene set (Table 3) but only a few genes gave any significant result and no positive selection acting at particular amino acid sites was found (as shown by rates of nonsynonymous and synonymous changes at each site from sequence
alignments). Both Tajima’sD- and Fu’sFs-test statistics
were negative and significantly different from zero for
erd3, revealing an excess of rare variants and a greater
number of haplotypes than expected, respectively. This pattern of polymorphism is commonly associated with genetic hitchhiking or a recent increase in population size. The HKA test rejected neutrality only in two
pairwise comparisons (with lp3-1, P , 0.010; and
sod-chl,P,0.098) involving this gene, and MK and Fay and
Wu’sH-tests were not significant. The latter results are
relevant because tests based on comparison between
nucleotide classes (synonymous vs. nonsynonymous),
TABLE 1
Candidate genes for drought tolerance inP. taeda
Candidate gene
Putative gene
function Sourcea
Linkage group
bp screened
Indelsb
(bp) Total 59UTR Exon Intron 39UTR
lp3-1 Water-stress-inducible protein 3 2 365 136 229 2 (13)
lp3-3 Water-stress-inducible protein 4 2 468 305 163 0
dhn-1 Dehydrin 1 8 673 560 113 3 (38)
dhn-2 Dehydrin 3 NS 531 439 92 1 (3)
lp5-like Putative cell wall protein, similar to lp5 inPinus taeda
3 NS 496 62 434 3 (24)
mt-like Similar to metallothionein 1 6 403 90 79 234 0
sod-chl Cu/Zn superoxide dismutase, nuclear gene for
chloroplast product
3 Unlinked 692 168 524 5 (6)
ferritin Ferritin 3 NS 605 157 263 185 2 (9)
rd21A-like Cysteine protease (Pseudotzain), similar to rd21A in Arabidopsis
2 7 1,000 159 579 262 5 (73)
sams-2 S-adenosylmethionine synthetase 2 3 8 541 347 194 0
pal-1 Phenylalanine ammonia-lyase 1 3 6 394 246 148 0
ccoaomt-1 Caffeoyl-CoA-O-methyltransferase 1 3 6 499 259 240 1 (16)
cpk3 Calcium-dependent protein kinase 1 1 630 377 187 66 1 (1)
ppap12 Uncertain, possible wall-associated protein kinase
4 8 378 378 0
pp2c Protein phosphatase 2C, similar to ABI1 in Arabidopsis
1 10 638 461 177 1 (3)
Aqua-MIP Aquaporin, membrane intrinsic protein 1 2 611 264 347 1 (8)
erd3 Early response to drought 3 2 NS 882 622 204 56 1 (4)
ug-2_498 Unknown 3 NS 310 — — — — 1 (23)
Total 10,116 221 5,822 2,651 1,112 27 (221)
Notation of linkage groups follows the reference genetic map of Brownet al.(2001); NS, locus not segregating in the reference
mapping populations; UTR, untranslated region.
a
Candidate gene source: 1, public databases (DDBJ/EMBL/GenBank); 2, North Carolina State University unigene set; 3, ‘‘elec-tronic’’ Northerns using root EST libraries with different drought-stress treatments; 4, differential expression under drought as shown by conifer literature. See further details in the text.
b
such as the MK test, or the excess of derived variants at
high frequency (Fay and Wu’s H-test) are robust to
deviations from the standard neutral model due to
demographic processes. Tajima’s D- and Fu’s Fs-test
statistics atccoaomt-1indicated an excess of variants at
intermediate frequencies and fewer haplotypes than
ex-pected, respectively. Indeed, all haplotypes atccoaomt-1
belong to two clearly differentiated lineages separated by 11 mutational steps with the majority of the variation existing between, not within, lineages (Figure 1a). This skew in the site frequency spectra is consistent with the maintenance of a balanced polymorphism. However, none of the neutrality tests conducted using outgroup se-quences was significant, and evidence of natural selec-tion acting on this gene was unclear.
Finally, the sliding-window analyses revealed
statisti-cally significant values of Tajima’s D in a few regions
within theug-2_498(Tajima’sD¼ 2.0084 at 126–248
bp) andppap12(Tajima’sD¼2.159–2.712 at 226–378
bp) genes.
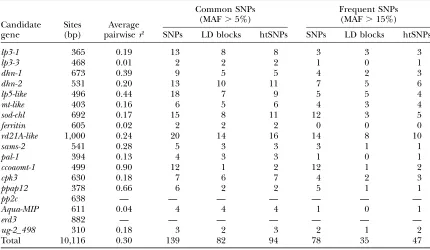
LD, haplotype diversity, and selection of htSNPs for
association mapping: Linkage disequilibrium within
the sequenced gene regions varied, depending on the
candidate gene locus, from very low (e.g., lp3-3,
aqua-MIP,ferritin) to high (e.g.,ppap-12,ccoaomt-1). We did not find any evidence of tight LD among sites from different genes, not even for those that putatively reside on the same chromosome (see, for instance, Figure 2, linkage group 8; similar results in other linkage groups are not
shown). Decay of LD within genes was rapid (Figure 3). A nonlinear fitting of the squared correlation of allele
frequencies (r2) as a function of distance between sites
showed expected values of0.20 at 800 bp. In a sample
of 32 sequences, we found from 2 (pp2c;He¼0.06) to 14
(lp3-1;He¼0.91) haplotypes per candidate gene locus,
with an average of 7.5 (He¼0.68). Selection of htSNPs
based on construction of LD blocks was relatively successful, considering the low level of LD found within
most genes (10 of 16 genes had average pairwise r2#
0.20; Table 4). We found from 1 (ccoaomt-1) to 14 (
rd21A-like) and 0 (lp3-3, aqua-MIP, ferritin, and pal-1) to 8
(rd21A-like) LD blocks for MAFs of 0.05 and 0.15,
respectively. For common SNPs (MAF . 5%), we
identified 94 htSNPs (of 139 available), resulting in a reduction in genotyping effort of 32.27%. The reduc-tion of genotyping effort was increased to 39.74% (47
htSNPs of 78 available) when only frequent (MAF .
15%) SNPs were considered.
DISCUSSION
This study reports nucleotide diversity and LD
esti-mates for 18 drought-tolerance candidate genes in P.
taeda. Several neutrality tests, using or not using out-group sequences, were performed to identify candidate genes that might be under natural selection. Our study provides insights on optimal SNP genotyping strategies for our ongoing association mapping studies in pines, TABLE 3
Neutrality tests and detection of positive (1) or negative () selection at single amino acid sites
Candidate gene
Selection at single amino acid sites
Neutrality testsa SLAC FEL
Tajima’sD Fu’sFs Fay and Wu’sH (1) () (1) ()
lp3-1 1.051 4.873 2.625 0 0 0 1
lp3-3 0.897 1.371 — 0 0 0 0
dhn-1 0.599 1.801 0.440 0 0 0 1
dhn-2 0.513 0.506 0.746 0 0 0 2
lp5-like 0.292 0.066 2.891 0 0 0 4
mt-like 0.247 0.257 — 0 0 0 0
sod-chl 0.458 1.629 0.552 0 0 0 1
ferritin 1.631 2.398 — 0 0 0 0
rd21A-like 0.369 0.662 0.931 0 0 0 2
sams-2 0.863 0.413 0.798 0 0 0 1
pal-1 0.772 3.495 0.226 0 0 0 1
ccoaomt-1 2.489* 8.553** 1.210 0 0 0 3
cpk3 0.370 0.007 — 0 0 0 2
ppap12 0.716 1.057 0.137 0 0 0 3
pp2c 1.142 1.265 0.060 0 0 0 1
aqua-MIP 0.422 2.471 0.480 0 0 0 1
erd3 2.102* 3.272* 0.363 0 0 0 0
ug-2_498 1.224 1.235 1.044 — — — —
Fay and Wu’sH-test was computed using as an outgroup putative ortholog sequences from maritime pine (Pinus pinaster), a European pine species. SLAC, single-likelihood ancestor-counting method; FEL, fixed-effects-likelihood method.
including SNP selection and potential biases due to population structure. Indeed, using putatively neutral
markers (21 nuSSRs) evenly distributed along mostP.
taedalinkage groups, we did not find any evidence of population structure, which confirms previous reports showing absence of population genetic structure within
the eastern Mississippi Valley range ofP. taeda(see, for
instance, Al-Rabab’ah and Williams 2002). Despite
the moderate level of LD and its rapid decay within genes, the use of htSNPs would reduce SNP genotyping
effort by30–40%, 50–100 SNPs being enough to
repre-sent common allelic variants in the sequenced candi-date gene loci.
The average level of variation (psil¼0.00853) found
in candidate genes for drought-stress response in P.
taedawas similar to the one in wood- and disease-related
candidates in this species (see review in Neale and
Savolainen2004). Levels of silent variation inpal-1for
P. taeda(this study) andP. sylvestrisL. (Dvornyk et al.
2002) were also similar (psil0.00490) and at the lower
range of those of the genes studied here. Most standing
Figure 2.—Linkage disequilibrium (as estimated by r2)
plots for five drought-response candidate genes, including three (dhn-1,sams-2, andppap-12) that map in the same link-age group (LG 8; see Brownet al. 2001). The significance of
linkage disequilibrium was estimated using Fisher’s exact test (P) and applying Bonferroni corrections. Only sites with mi-nor allele frequency.0.15 are shown.
Figure3.—Scatter plot of the squared correlation of allele
frequencies (r2) as a function of distance between sites for 18
candidate genes inP. taeda. A nonlinear fitting was done fol-lowing Remington et al. (2001) (see details in the text).
Lower and upper 95% confidence intervals are represented with thin lines. For comparison, the LD-decay curve from Brownet al. (2004) is also shown (dashed line).
Figure1.—Single-nucleotide polymorphisms (SNPs) and haplotype structure forccoaomt-1.(a) Polymorphic sites and
variation in forest trees is normally found within
pop-ulations (see, for instance, Hamricket al. 1992). The
extensive sampling of Florida, which is considered a putative Pleistocene glacial refugium of the species
(Schmidtlinget al.1999; Al-Rabab’ahand Williams
2002), resulted in only slightly higher nucleotide variation estimates than those in previous studies of
the species½average of 0.00604vs.0.00580, based on five
gene fragments from our study,ccoaomt-1,pal-1,sams-2,
ug_2-498, andlp3-1, that we also sequenced in Brown
et al.’s (2004) set of samples, the difference not being
significant (P ¼0.281) as shown by a pairwise signed
rank test (n¼5). Bottlenecks, as those that might have
occurred in forest trees during Pleistocene range shifts, can generate substantial LD due to a reduction in population size with accompanying genetic drift (Flint-Garcı´a et al. 2003; Rafalski and Morgante 2004). Levels of LD in this study were lower than those
found in Brown et al. (2004) (see Figure 3), which
might reflect more stable population dynamics in the putative glacial refugium of Florida. Compared also
with Brown et al.(2004), we found a larger range in
nucleotide diversity in our study, where maximum per
gene silent diversity (0.02052;lp5-like) was 100-fold the
minimum estimate (0.00022; pp2c). The nucleotide
diversity found in pine, compared with that in other plants, was moderate (see supplemental Table S5 at http://www.genetics.org/supplemental/), which, as first
noted by Dvornyk et al. (2002), does not meet
pre-dictions based on their life history or other studies based
on molecular markers, such as allozymes or RAPDs
(Hamricket al.1992; Nybomand Bartish2000). Indeed,
pines are highly outcrossing organisms showing gen-erally large effective population sizes and higher het-erozygosity than other plants (expected hethet-erozygosity
of 0.163–0.193 in P. taeda based on 18 allozymes;
Schmidtlinget al.1999). It is striking, then, that average
nucleotide variation inP. taeda(and other pines; see, for
instance, Pot et al. 2005) was consistently lower than
that in Arabidopsis thaliana, the model selfing species.
Estimates based on divergence time from related species
showed mutation rates in pines (0.5–1.531010/year;
Dvornyk et al.2002; Brown et al.2004) two orders of
magnitude lower than those in angiosperms, including
Arabidopsis (Dvornyket al.2002 and references therein).
A lower overall rate of sequence evolution might explain the increasing evidence of low to moderate nucleotide diversity in pines.
A number of neutrality tests were conducted to identify genes or sites departing from standard neutral patterns. A selective sweep might have occurred at the
early-response-to-drought-3(erd3) gene, which had reduced nucleotide variation, as shown by pairwise HKA tests, and an excess of less frequent variants. This polymor-phism pattern can result from genetic hitchhiking
(Bravermanet al. 1995; see Olsen et al. 2002 for an
example in plants). However, Fay and Wu’s H-test did
not find any excess of derived variants at high frequency
for this gene (Fay and Wu’s H ¼0.363, P ¼ 0.4140),
which is a unique pattern produced by genetic TABLE 4
Average pairwise LD (estimated byr2) and selection of haplotype-tagging SNPs (htSNPs) for common and
frequent SNPs found in 18 candidate gene loci for drought tolerance
Candidate gene
Sites (bp)
Average pairwiser2
Common SNPs (MAF.5%)
Frequent SNPs (MAF.15%)
SNPs LD blocks htSNPs SNPs LD blocks htSNPs
lp3-1 365 0.19 13 8 8 3 3 3
lp3-3 468 0.01 2 2 2 1 0 1
dhn-1 673 0.39 9 5 5 4 2 3
dhn-2 531 0.20 13 10 11 7 5 6
lp5-like 496 0.44 18 7 9 5 5 4
mt-like 403 0.16 6 5 6 4 3 4
sod-chl 692 0.17 15 8 11 12 3 5
ferritin 605 0.02 2 2 2 0 0 0
rd21A-like 1,000 0.24 20 14 16 14 8 10
sams-2 541 0.28 5 3 3 3 1 1
pal-1 394 0.13 4 3 3 1 0 1
ccoaomt-1 499 0.90 12 1 2 12 1 2
cpk3 630 0.18 7 6 7 4 2 3
ppap12 378 0.66 6 2 2 5 1 1
pp2c 638 — — — — — — —
Aqua-MIP 611 0.04 4 4 4 1 0 1
erd3 882 — — — — — — —
ug-2_498 310 0.18 3 2 3 2 1 2
Total 10,116 0.30 139 82 94 78 35 47
hitchhiking (Fay and Wu 2000). The observed site frequency spectrum might also have resulted from population expansion. Despite the lack of evidence of population expansion shown by our nuSSR survey, a relatively recent population expansion for the southern pines (note that pollen morphology among species of
southern pines, includingP. taeda, is indistinguishable)
within the study range is supported by palynological data showing a steady increase of pine presence
begin-ning 7000 years before present (Watts and Hansen
1994). Because the survival ofP. taedaseedlings is strongly
limited by the average annual minimum temperature
(Schmidtling2001), range expansions and retreats in
response to changing climatic conditions are expected in this species. Further evidence of population
expan-sion in P. taeda from the southeastern United States
comes from the skewed Tajima’sDdistribution (70%
of genes giving negative estimates ofD) of the50 genes
currently sequenced in our laboratory (our unpublished
data). A skew of the Tajima’sDdistribution toward
neg-ative values is a typical genomewide signature of
pop-ulation growth (Sanoand Tachida2005 and references
therein).
One other gene,Caffeoyl-CoA-O-methyltransferase(
ccoaomt-1), a methylating enzyme involved in lignification, had
an excess of intermediate variants (significant positive
Tajima’sD), fewer haplotypes than expected (significant
positive Fu’s Fs), and high within-gene LD (average
pairwiser2of 0.90), resulting in a polymorphism pattern
characterized by the existence of two distinctly major
haplotype lineages at similar frequencies (named
di-morphism; see Figure 1a). This gene also showed higher variation than the average in silent sites but lower
variation in nonsynonymous sites (psil of 0.01911 and
null pa vs. averages of 0.00853 and 0.00166,
respec-tively). The two haplotype lineages did not show any geographical pattern, both lineages being present in all
the major biogeographical zones of theP. taeda range
(see Figure 1b). All 13 polymorphic sites found in the sequenced fragment (see Table 1) were silent mutations and, consequently, we were not able to compute the MK test for this gene or identify a replacement polymor-phism causing the singular haplotype structure found in
ccoaomt-1. Pairwise HKA tests, which consider variable mutation rates across the genome, did not show an excess of polymorphism relative to the other loci, used here as reference. In a scenario of no population structure and population expansion, demography and population factors do not provide any satisfactory explanation for dimorphism in this gene. Dimorphism has often been considered as the outcome of the long-term action of balancing selection in different genes
and species ½PgiC in Leavenworthia species (Filatov
and Charlesworth 1999);RPS5andRpm1resistance
genes in Arabidopsis (Stahl et al. 1999; Tian et al.
2002). However, this pattern is also compatible with a
constant-size neutral model with no recombination (see
Aguade´ 2001 for FAH1 andF3H in Arabidopsis) and
evidence of natural selection acting inccoaomt-1remains
inconclusive. Full-length sequencing of this gene,
in-cluding the promoter region, is advisable. Olsenet al.
(2002) found two promoter haplogroups, weakly
asso-ciated with flower developmental traits, in the TFL1
gene of Arabidopsis that appear to be maintained by selection. Further evidence of natural selection for this gene might also come from our ongoing association
studies where900 P. taedaclones will be used to test
ccoaomt-1 haplotype differences in performance for adaptive traits related to growth, drought-stress re-sponse, and resistance to fungal disease.
In conifers, a candidate-gene-based strategy for asso-ciation mapping is favored. Genomewide scans are implausible for conifers because of the number of SNPs needed to cover the large genome and because of the
general lack of intergenic LD (Nealeand Savolainen
2004). Our results are relevant to define SNP genotyp-ing strategies for our ongogenotyp-ing association mappgenotyp-ing of drought-stress tolerance candidate genes in pines. Genes or portions of genes showing departure from the standard neutral model will be given priority, in
particular ccoaomt-1, where a balanced polymorphism
might have caused dimorphism at nearby linked re-gions. In total, we identified 196 polymorphisms,
in-cluding 139 common SNPs (i.e., SNPs with minor allele
frequency.5%) suitable for association mapping, in 18
candidate gene loci for drought-stress response in P.
taeda. Pine genes might be structured in short blocks within which common variants are in strong LD but among which recombination has left little LD. Then, genotyping strategies based on htSNPs would produce only moderate reductions in genotyping effort. De-pending on the minor allele frequency chosen, we found that genotyping of 50–100 SNPs would suffice to represent common allelic variants, resulting in
reductions of genotyping effort of30–40% inP. taeda
association studies.
We thank K. Krutovsky, M. Heuertz, and P. G. Goicoechea for valuable comments and discussions. G. P. Gill, R. J. Kuntz, J. Beal, and J. Manares provided technical assistance in the lab. We thank A. Soto and M. T. Cervera, and P. Garnier-Ge´re´, who provided unpublished sequence data and unpublished nucleotide diversity estimates, re-spectively, forP. pinaster. C. Dana Nelson½Southern Institute of Forest Genetics, U.S. Department of Agriculture (USDA) produced the nuclear microsatellite data. The work of S. C. Gonza´lez-Martı´nez was supported by a Fulbright/MECD scholarship at University of Califor-nia (Davis) and by the ‘‘Ramo´n y Cajal’’ fellowship (RC02-2941). This research was supported by the Allele Discovery for Genes Controlling Economic Traits in Loblolly Pine project funded in the framework of the Initiative for Future Agriculture and Food Systems (USDA).
LITERATURE CITED
Al-Rabab’ah, M., and C. G. Williams, 2002 Population dynamics ofPinus taeda L. based on nuclear microsatellites. For. Ecol. Manage.163:263–271.
Braverman, J. M., R. R. Hudson, N. L. Kaplan, C. H. Langleyand W. Stephan, 1995 The hitchhiking effect on the site frequency spectrum of DNA polymorphisms. Genetics140:783–796. Brown, G. R., E. E. Kadel, III, D. L. Bassoni, K. L. Kiehne,
B. Temesgenet al., 2001 Anchored reference loci in loblolly pine (Pinus taeda L.) for integrating pine genomics. Genetics
159:799–809.
Brown, G. R., D. L. Bassoni, G. P. Gill, J. R. Fontana, N. C. Wheeler et al., 2003 Identification of quantitative trait loci influencing wood property traits in loblolly pine (Pinus taeda
L.). III. QTL verification and candidate gene mapping. Genetics
164:1537–1546.
Brown, G. R., G. P. Gill, R. J. Kuntz, C. H. Langleyand D. B. Neale, 2004 Nucleotide variation and linkage disequilibrium in loblolly pine. Proc. Natl. Acad. Sci. USA 101: 15255– 15260.
Buckler, IV, E. S., and J. M. Thornsberry, 2002 Plant molecular diversity and applications to genomics. Curr. Opin. Plant Biol.
5:107–111.
Burns, R. M., and B. H. Honkala, 1990 Silvics of North America: 1.
Conifers. 2. Hardwoods.Agriculture Handbook 654. U.S. Depart-ment of Agriculture, Forest Service, Washington, DC (http://www. na.fs.fed.us/spfo/pubs/silvics_manual/table_of_contents.htm). Chang, S., J. D. Puryear, M. A. D. L. Dias, E. A. Funkhouser, R. J.
Newtonet al., 1996 Gene expression under water deficit in lob-lolly pine (Pinus taeda): isolation and characterization of cDNA clones. Physiol. Plant.97:139–148.
Dubos, C., and C. Plomion, 2001 Drought differentially affects ex-pression of a PR-10 protein in needles of maritime pine (Pinus pinasterAit.) seedlings. J. Exp. Bot.358:1143–1144.
Dubos, C., and C. Plomion, 2003 Identification of water-deficit re-sponsive genes in maritime pine (Pinus pinasterAit.) roots. Plant Mol. Biol.51:249–262.
Dubos, C., G. Le-Provost, D. Pot, F. Salin, C. Lalane et al., 2003 Identification and characterization of water-stress-respon-sive genes in hydroponically grown maritime pine (Pinus pinaster) seedlings. Tree Physiol.23:169–179.
Dvornyk, V., A. Sirvio¨, M. Mikkonen and O. Savolainen, 2002 Low nucleotide diversity at thepal1locus in the widely dis-tributedPinus sylvestris.Mol. Biol. Evol.19:179–188.
Ewing, B., L. Hillier, M. Wendland P. Green, 1998 Basecalling of automated sequencer traces using phred. I. Accuracy assessment. Genome Res.8:175–185.
Fay, J. C., and C.-I Wu, 2000 Hitchhiking under positive Darwinian selection. Genetics155:1405–1413.
Filatov, D. A., and D. Charlesworth, 1999 DNA polymorphism, haplotype structure and balancing selection in the Leavenwor-thia PgiC locus. Genetics153:1423–1434.
Flint-Garcı´a, S. A., J. M. Thornsberryand E. S. Buckler, IV, 2003 Structure of linkage disequilibrium in plants. Annu. Rev. Plant Biol.54:357–374.
Ford, M. J., 2002 Applications of selective neutrality tests to molec-ular ecology. Mol. Ecol.11:1245–1262.
Fu, Y. X., 1997 Statistical tests of neutrality of mutations against pop-ulation growth, hitchhiking and background selection. Genetics
147:915–925.
Garcı´a-Gil, M. R., M. Mikkonenand O. Savolainen, 2003 Nucleotide diversity at two phytochrome loci along a latitudinal cline inPinus sylvestris.Mol. Ecol.12:1195–1206.
Gordon, D., C. Abajianand P. Green, 1998 Consed: a graphical tool for sequence finishing. Genome Res.8:195–202.
Hamrick, J. L., M. J. Godtand S. L. Sherman-Broyles, 1992 Factors influencing levels of genetic diversity in woody plant species. New For.6:95–124.
Hill, W. G., and A. Robertson, 1968 Linkage disequilibrium in fi-nite populations. Theor. Appl. Genet.38:226–231.
Hill, W. G., and B. S. Weir, 1988 Variances and covariances of squared linkage disequilibria in finite populations. Theor. Popul. Biol.33:54–78.
Hirschhorn, J. N., and M. J. Daly, 2005 Genome-wide association studies for common diseases and complex traits. Nat. Rev. Genet.
6:95–108.
Hudson, R. R., M. Kreitmanand M. Aguade´, 1987 A test of neutral molecular evolution based on nucleotide data. Genetics 116:
153–159.
Ingram, J., and D. Bartels, 1996 The molecular basis of dehydra-tation tolerance in plants. Annu. Rev. Plant Physiol. Plant Mol. Biol.47:377–403.
Ingvarsson, P. K., 2005 Nucleotide polymorphism and linkage dis-equilibrium within and among natural populations of European aspen (Populus tremulaL., Salicaceae). Genetics169:945–953. Jarvis, S. B., M. A. Taylor, M. R. MacLeod and H. V. Davies,
1996 Cloning and characterisation of the cDNA clones of three genes that are differentially expressed during dormancy-break-age in the seeds of Douglas fir (Pseudotsuga menziesii). J. Plant Physiol.147:559–566.
Kado, T., H. Yoshimaru, Y. Tsumuraand H. Tachida, 2003 DNA variation in a conifer, Cryptomeria japonica(Cupressaceaesensu lato). Genetics164:1547–1559.
Karpinska, B., M. Karlsson, H. Schinkel, S. Streller, K. H. Su¨ ss
et al., 2001 A novel superoxide-dismutase with a high isoelectric point in higher plants. Expression, regulation, and protein local-ization. Plant Physiol.126:1668–1677.
Kosakovsky-Pond, S. L., and S. D. W. Frost, 2005a Not so different after all: a comparison of methods for detecting amino acid sites under selection. Mol. Biol. Evol.22:1208–1222.
Kosakovsky-Pond, S. L., and S. D. W. Frost, 2005b Datamonkey: rapid detection of selective pressure on individual sites of codon alignments. Bioinformatics21:2531–2533.
Kreitman, M., 2000 Methods to detect selection in populations with applications to the human. Annu. Rev. Genomics Hum. Genet.1:
539–559.
Krupkin, A. B., A. Listonand S. H. Strauss, 1996 Phylogenetic analysis of the hard pines (Pinus subgenus Pinus, Pinaceae) from chloroplast restriction site analysis. Am. J. Bot.83:489–498. Krutovsky, K. V., and D. B. Neale, 2005 Nucleotide diversity and
linkage disequilibrium in cold hardiness and wood quality re-lated candidate genes in Douglas fir. Genetics171:2029–2041. Li, L., X. H. Zhang, C. P. Joshiand V. L. Chiang, 1998
Com-pression stress responsive exCom-pression of ferritin (accession no AF028072) and peroxidase genes (accession no AF028073) in de-veloping xylem of loblolly pine (Pinus taeda). Plant Physiol.116:
1604.
Long, A. D., and C. H. Langley, 1999 The power of association studies to detect the contribution of candidate genetic loci to var-iation in complex traits. Genome Res.9:720–731.
Luikart, G., P. R. England, D. Tallmon, S. Jordanand P. Taberlet, 2003 The power and promise of population genomics: from genotyping to genome typing. Nat. Rev. Genet.4:981–994. Marchini, J., L. R. Cardon, M. S. Phillips and P. Donnelly,
2004 The effects of human population structure on large ge-netic association studies. Nat. Genet.36:512–517.
McDonald, J. H., and M. Kreitman, 1991 Adaptive protein evolu-tion at theAdhlocus in Drosophila. Nature351:652–654. Neale, D. B., and O. Savolainen, 2004 Association genetics of
com-plex traits in conifers. Trends Plant Sci.9:325–330.
Nei, M., 1987 Molecular Evolutionary Genetics. Columbia University Press, New York.
Nei, M., and W. H. Li, 1979 Mathematical model for studying ge-netic variation in terms of restriction endonucleases. Proc. Natl. Acad. Sci. USA76:5269–5273.
Newton, R. J., E. A. Funkhouser, F. Fongand C. G. Tauer, 1991 Mo-lecular and physiological genetics of drought tolerance in forest species. For. Ecol. Manage.43:225–250.
Nybom, H., and I. V. Bartish, 2000 Effects of life history traits and sampling strategies on genetic diversity estimates obtained with RAPD markers in plants. Perspect. Plant Ecol. Evol. Syst. 3:
93–114.
Olsen, K. M., A. Womack, A. R. Garrett, J. I. Suddithand M. D. Purugganan, 2002 Contrasting evolutionary forces in the
Ara-bidopsis thaliana floral developmental pathway. Genetics 160:
1641–1650.
Padmanabhan, V., M. A. D. L. Diasand R. J. Newton, 1997 Ex-pression analysis of a gene family in loblolly pine (Pinus taeda
patterns of microsatellite variability. Mol. Biol. Evol. 7:1143– 1153.
Pot, D., L. McMillan, C. Echt, G. Le-Provost, P. Garnier-Ge´ re´
et al., 2005 Nucleotide variation in genes involved in wood for-mation in two pine species. New Phytol.167:101–112. Pritchard, J. K., and W. Wen, 2004 Documentation for Structure
Soft-ware Version 2. Department of Human Genetics, University of Chicago, Chicago (http://pritch.bsd.uchicago.edu).
Pritchard, J. K., M. Stephensand P. Donnelly, 2000 Inference of population structure using multilocus genotype data. Genetics
155:945–959.
Rafalski, A., and M. Morgante, 2004 Corn and humans: recombi-nation and linkage disequilibrium in two genomes of similar size. Trends Genet.20:103–111.
Remington, D. L., J. M. Thornsberry, Y. Matsouka, L. M. Wilson, S. R. Whittet al., 2001 Structure of linkage disequilibrium and phenotypic associations in the maize genome. Proc. Natl. Acad. Sci. USA98:11479–11484.
Richard, S., M. J. Morency, C. Drevet, L. Jouaninand A. Se´ guin, 2000 Isolation and characterization of a dehydrin gene from white spruce induced upon wounding, drought and cold stresses. Plant Mol. Biol.43:1–10.
Rosenberg, N. A., and M. Nordborg, 2002 Genealogical trees, co-alescent theory and the analysis of genetic polymorphisms. Nat. Rev. Genet.3:380–390.
Rosenberg, N. A., J. K. Pritchard, J. L. Weber, H. M. Cann, K. K. Kidd et al., 2002 Genetic structure of human populations. Science298:2381–2385.
Rozas, J., J. C. Sa´ nchez-del-Barrio, X. Messeguerand R. Rozas, 2003 DnaSP, DNA polymorphism analyses by the coalescent and other methods. Bioinformatics19:2496–2497.
Sano, A., and H. Tachida, 2005 Gene genealogy of test statistics of neutrality under population growth. Genetics169:1687–1697. Schmidtling, R. C., 2001 Southern Pine Seed Sources. USDA, GTR
SRS-44, Asheville, NC.
Schmidtling, R. C., E. Carrolland T. LaFarge, 1999 Allozyme di-versity of selected and natural loblolly pine populations. Silvae Genet.48:35–45.
Schneider, S., D. Roessliand L. Excoffier, 2000 Arlequin Ver. 2000:
A Software for Population Genetics Data Analysis.Genetics and Biom-etry Laboratory, University of Geneva, Geneva.
Seki, M., A. Kamei, K. Yamaguchi-Shinozaki and K. Shinozaki, 2003 Molecular responses to drought, salinity and frost: common and different paths for plant protection. Curr. Opin. Biotechnol.14:194–199.
Slatkin, M., 1994 An exact test for neutrality based on the Ewens sampling distribution. Genet. Res.64:71–74.
Slatkin, M., 1996 A correction to the exact test based on the Ewens sampling distribution. Genet. Res.68:259–260.
Stahl, M. G., G. Dwyer, R. Mauricio, M. Kreitmanand J. Bergelson, 1999 Dynamics of disease resistance polymorphism at theRpm1
locus of Arabidopsis. Nature400:667–671.
Suzuki, Y., and T. Gojobori, 1999 A method for detecting positive selection at single amino acid sites. Mol. Biol. Evol.16:1315–1328. Tajima, F., 1989 Statistical method for testing the neutral mutation
hypothesis by DNA polymorphism. Genetics123:585–595. Takeuchi, F., K. Yanai, T. Morii, Y. Ishinaga, K. Taniguchi-Yanai
et al., 2005 Linkage disequilibrium grouping of single nucleo-tide polymorphisms (SNPs) reflecting haplotype phylogeny for efficient selection of tag SNPs. Genetics170:291–304. Temesgen, B., G. R. Brown, D. E. Harry, C. S. Kinlaw, M. M. Sewell
et al., 2001 Genetic mapping of expressed sequence tag poly-morphism (ESTP) markers in loblolly pine (Pinus taeda L.). Theor. Appl. Genet.102:664–675.
Tian, D., H. Araki, E. Stahl, J. Bergelson and M. Kreitman, 2002 Signature of balancing selection in Arabidopsis. Proc. Natl. Acad. Sci. USA99:11525–11530.
Tranbarger, T. J., and S. Misra, 1996 Structure and expression of a developmentally regulated cDNA encoding a cysteine protease (pseudotzain) from Douglas-fir. Gene172:221–226.
Wang, W. Y. S., B. J. Barratt, D. G. Clayton and J. A. Todd, 2005 Genome-wide association studies: theoretical and practi-cal concerns. Nat. Rev. Genet.6:109–118.
Watkinson, J. I., A. A. Sioson, C. Vasquez-Robinet, M. Shukla, D. Kumaret al., 2003 Photosynthetic acclimation is reflected in specific patterns of gene expression in drought-stressed loblolly pine. Plant Physiol.133:1702–1716.
Watterson, G. A., 1975 On the number of segregating sites in ge-netical models without recombination. Theor. Popul. Biol. 7:
256–276.
Watterson, G. A., 1978 The homozygosity test of neutrality. Genetics
88:405–417.
Watterson, G. A., 1986 The homozygosity test after a change in population size. Genetics112:899–907.
Watts, W. A., and B. C. S. Hansen, 1994 Pre-Holocene and Holo-cene pollen records of vegetation history from the Florida pen-insula and their climatic implications. Paleogeogr. Paleoclimatol. Paleoecol.109:163–176.
Weir, B. S., and C. C. Cockerham, 1984 Estimating F-statistics for the analysis of population structure. Evolution38:1358–1370. Zhang, K., and L. Jin, 2003 HaploBlockFinder: haplotype block
analyses. Bioinformatics19:1300–1301.