DOI: 10.1534/genetics.104.027706
Analysis of the Estimators of the Average Coefficient of
Dominance of Deleterious Mutations
B. Ferna´ndez,* A. Garcı´a-Dorado
†and A. Caballero*
,1*Departamento de Bioquı´mica, Gene´tica e Inmunologı´a, Facultad de Ciencias, Universidad de Vigo, 36200 Vigo, Spain and†Departamento de Gene´tica, Facultad de Ciencias Biolo´gicas, Universidad Complutense, 28040 Madrid, Spain
Manuscript received February 17, 2004 Accepted for publication July 7, 2004
ABSTRACT
We investigate the sources of bias that affect the most commonly used methods of estimation of the average degree of dominance (h) of deleterious mutations, focusing on estimates from segregating populations. The main emphasis is on the effect of the finite size of the populations, but other sources of bias are also considered. Using diffusion approximations to the distribution of gene frequencies in finite populations as well as stochastic simulations, we assess the behavior of the estimators obtained from pop-ulations at mutation-selection-drift balance under different mutational scenarios and compare averages of hfor newly arisen and segregating mutations. Because of genetic drift, the inferences concerning newly arisen mutations based on the mutation-selection balance theory can have substantial upward bias depending upon the distribution ofh. In addition, estimates usually refer tohweighted by the homozygous deleterious effect in different ways, so that inferences are complicated when these two variables are negatively correlated. Due to both sources of bias, the widely used regression of heterozygous on homozy-gous means underestimates the arithmetic mean of h for segregating mutations, in contrast to their repeatedly assumed equality in the literature. We conclude that none of the estimators from segregating populations provides, under general conditions, a useful tool to ascertain the properties of the degree of dominance, either for segregating or for newly arisen deleterious mutations. Direct estimates of the average hfrom mutation-accumulation experiments are shown to suffer some bias caused by purging selection but, because they do not require assumptions on the causes maintaining segregating variation, they appear to give a more reliable average dominance for newly arisen mutations.
T
HE dominance of genes controlling fitness com- andGarcı´a-DoradoandCaballero(2000) provide a ponents is a key issue for theoretical predictions discussion of the difficulties encountered in the inter-in population and quantitative genetics, as parameters pretation of the estimates of dominance obtained from such as inbreeding depression and genetic variance de- mutation-accumulation experiments. In this article, we pend heavily on the degree of dominance (Crowand extend the discussion to the most extensively usedmeth-Kimura1970;LynchandWalsh1998;Charlesworth ods based on segregating populations.
andHughes1999). However, the dominance of genes A widely used approach is based on the analysis of
chro-is difficult to estimate in terms of both statchro-istical analyschro-is mosomes extracted from natural populations. Estimates and effort required. From mutation-accumulation ex- are available for several fitness components in Drosoph-periments it is possible to estimate some properties of ila (mostly viability, reviewed by Simmons and Crow the dominance of new spontaneous mutations in the 1977 andGarcı´a-Doradoet al.1999) and rely on differ-absence of substantial selection, and this is the most ent measurements of the relationship between the ex-direct measure that can be obtained (see Garcı´a- pression of some fitness trait in homozygous individuals
Doradoet al.2004 for a recent review andPeterset al. and their panmictic crosses. Another widely used method
2003,FryandNuzhdin 2003,Szafraniecet al.2003, is based on the comparison between the genetic load and references therein for estimates from mutations of outbred and inbred populations for the fitness trait, induced by EMS and by transposable-element inser- and estimates are available for a range of species and tions). Indirect estimates of dominance can also be in- traits (seeLynchandWalsh1998, pp. 284–287). These ferred from the genetic structure of segregating popula- two kinds of methods are the main subject of this article. tions assumed to be at the balance between mutation
More sophisticated versions of the second method and directional selection.Garcı´a-Doradoet al.(1999)
have been developed that also incorporate additional population parameters, such as variances and covari-ances of a fitness component for outbred and selfed 1Corresponding author:Departamento de Bioquı´mica, Gene´tica e
In-populations (DengandLynch1996;Denget al.2002). munologı´a, Facultad de Ciencias, Universidad de Vigo, 36200 Vigo,
Spain. E-mail: [email protected] In addition, some methods require previous
edge of the genomic mutation rate (Lynchet al.1995)
hE ⫽
兺
pihi
兺
pi. (2)
or of one of several mutational parameters (Denget al.
2002). Finally, a method is based on the ratio of
esti-Here and henceforth, the sum is over all mutations, mates of additive and dominance variance components
the subscript E denotes segregating [equilibrium (E)]
(ComstockandRobinson1952). None of these
meth-mutations, and the overbar indicates the arithmetic ods are considered in this article, as they have been
mean. Substituting the expected pervasiveness in an infi-used more rarely, may involve the previous inference
nite population (Equation 1) into (2) we obtain the muta-of other mutational parameters, and may require the
tion-selection balance (MSB) prediction of Equation 2, estimation of variance components, generally subject to
larger estimation errors than those for means.
hE⫽
兺
1/si
兺
1/(sihi)⫽h˜N(1/s), (3)
A key assumption for the inferences obtained from segregating populations to be reliable is that no
substan-tial proportion of the standing genetic variability for which is the harmonic mean ofhfor newly arisen muta-fitness, or for the fitness-related trait that is being stud- tions weighted by the inverse of their corresponding ied, should be maintained by mechanisms other than homozygous effects (1/s). From now on, the subscript mutational pressure (e.g., overdominance, soft selection, N refers to newly arisen mutations, the tilde indicates hitchhiking, etc.). Although this is surely not the case the harmonic mean, and the expression in parentheses for many wild populations, the theory provides useful is the weighting factor for the average. From Equations predictions for the mutation-selection balance “null hy- 2 and 3 we note that, in the particular case of constant pothesis.” Furthermore, mutation-selection balance pre- s, the arithmetic mean of segregating deleterious muta-dictions and estimates rely on additional assumptions tions (hE) is the unweighted harmonic mean of newly that, although explicitly stated when the underlying the- arisen ones (h˜N). This was initially stated by Morton ory was developed, are often ignored at the time the et al.(1956) andHiraizumiandCrow(1960) for homo-estimation technique is implemented or applied. zygous lethal mutations. For the case of variables, this In this article, we investigate the sources of bias that is true only for the unlikely case in whichsandhare sta-affect the estimation of the average degree of dominance tistically independent among newly arisen mutations (see of deleterious mutations from segregating populations below). However, it was later misleadingly employed as a at mutation-selection-drift balance, under a range of general result (Mukai 1969; Mukai et al. 1972; Mukai
mutational and dominance models. The main emphasis andYamaguchi1974;Watanabeet al. 1976).
is on the finite size of the populations, a factor that has Several methods have been developed to estimate the not been so far considered. We compare the coefficient properties of the coefficient of dominance for newly of dominance of segregating mutations and newly arisen arisen or segregating deleterious mutations from data ones, along with their corresponding estimates, to clar- on large outbred populations. T. Mukai and co-workers ify their relationship. Finally, we assess the bias incurred obtained many estimates for viability inDrosophila
melano-by selection on the estimates obtained from mutation- gasterby extracting chromosomes from natural popula-accumulation experiments, so as to compare the biases tions and building homozygous and heterozygous (i.e., of direct and indirect methods of estimation. panmictic nonhomozygous) lines. Using the regression of heterozygous viabilities (y) on the sum of the genetic values for the two homozygous ones (x), or vice versa, PREDICTIONS FOR AN INFINITE POPULATION
estimates of the average h can be obtained. Basically, AND ESTIMATION METHODS
using the previous model of mutation-selection balance Assume that the mutational effects on homozygotes in an infinite population, and again disregarding homo-and heterozygotes for a newly arisen mutantiaresiand zygous expression in panmictic crosses (i.e., assuming
sihi, respectively, and thathi, the coefficient of dominance, that deleterious mutations segregate at low
frequen-is large enough that selection against homozygotes can cies), the variances and covariances of homozygous and be ignored in a large random-mating population. The heterozygous viabilities are
expected total number of individuals that carry the
mu-2
x⫽
兺
pis2i ⫽兺
(si/hi),tant before it is eliminated is
2
y ⫽
兺
pis2ih2i ⫽兺
sihi,pi⫽1/(sihi) (1)
x,y⫽
兺
pis2ihi⫽兺
si,(Morton et al. 1956; Li and Nei 1972; Crow 1979,
1993), which we call the “pervasiveness” of the mutant, so that the regression of y on x (b
y.x) is expected to
to avoid confusion between this and the true persis- estimate the arithmetic meanhfor segregating deleteri-tence time of a mutant (seeGarcı´a-Doradoet al.2003). ous mutations weighted bys2,
Thus, the arithmetic mean of the coefficient of
domi-nance for segregating (equilibrium) deleterious muta- b
y.x⫽
兺
pis2ihi
兺
pis2i⫽hE(s2). (4)
TABLE 1 The regression ofyon xcan also be expressed as the
average ofhvalues weighted by the genetic variance if Expressions for the estimates of the average coefficient all individuals were homozygotes (seeMukaiet al.1972; of dominance for segregating mutations and their
Caballero et al. 1997). Substituting Equation 1 into mutation-selection balance (MSB) predictions
for newly arisen mutations (4) gives an MSB prediction as the harmonic mean of
hfor newly arisen mutations weighted bys,
Estimation Averages for Averages for newly method segregating mutations arisen mutations (MSB)
by.x ⫽
兺
si
兺
(si/hi)⫽h˜N(s). (5)
hE⫽
兺
pihi兺
pi兺
1/si兺
1/(sihi)⫽h˜N(1/s) A method proposed by Deng (1998), based on the
relationship between outbred parents and their selfed offspring, is an alternative for outcrossers capable of
by.x hE(s2)⫽
兺
pis2ihi兺
pis2i兺
si兺
(si/hi) ⫽h˜N(s) selfing if homozygous lines cannot be constructed, andthe estimated averagehis identical to Equation 4. Thus, as expected, bothby.x and Deng’s estimates give nearly
1/bx.y hE(s2h)⫽
兺
pis2ih2i兺
pis2ihi兺
(sihi)兺
si⫽hN(s) identical values in cases where lethal mutations are
ex-cluded (Deng 1998). The regression of heterozygous
on homozygous viabilities (by.x) has been interpreted as 1⫺WO
2(1⫺WI)
hE(s)⫽
兺
pisihi兺
pisi兺
1兺
(1/hi) ⫽h˜N the arithmetic mean coefficient of dominance in anequilibrium random-mating population (hE) even if
See text for explanation. there are differential selection coefficients among loci
(e.g., Mukai and Yamaguchi 1974). However, this is
the case only when s and h are not correlated, as by.x
This method, applied to the viabilities of individual ho-gives an averagehweighted bys2(Equation 4).
mozygous chromosomes and their crosses, was originally Similarly, the inverse of the regression ofxony(bx.y)
used byMukai and Yamazaki (1968) to estimate the estimates
averagehfor initially isogenic chromosomes that were allowed to accumulate mutations for a period of time. 1/bx.y ⫽
兺
pis2ih2i
兺
pisi2hi⫽hE(s2h) (6) In a segregating populationW
max is unknown, but for absolute viability an upper bound ofWmax ⫽ 1 can be and, substituting Equation 1 into (6), gives an MSB used to approximate the harmonic mean through what prediction as the arithmetic mean ofhfor newly arisen we denote theratioestimate,
mutations weighted bys,
ratio⫽ 1⫺ WO 2(1⫺ WI)
. (9b)
1/bx.y⫽
兺
(sihi)
兺
si⫽hN(s). (7)
However, this estimate is biased towardh˜N⫽0.5 when-Finally, a simple method of estimation of the domi- ever Wmax ⬍ 1, a highly likely situation implying that nance coefficient involves estimates of the mean of a there are nongenetic causes of mortality. Thus, forh˜N⬍ fitness component for outbred and inbred populations 0.5, this ratio gives an upper bound forh˜N(Lynchand
(Lynch and Walsh 1998, pp. 283–287). Thus, again Walsh1998), which is, in turn, a lower bound for the
assuming that deleterious mutations segregate at low arithmetic mean hN, as the harmonic mean would be frequencies, the mean of an infinite outbred popula- generally lower than the arithmetic mean. This renders tion isWO⫽Wmax ⫺2兺pisihi, and that of a completely the ratio estimate difficult to interpret.
inbred one isWI⫽Wmax⫺兺pisi, assuming there has been To facilitate further discussions, a summary of
Equa-no purging of deleterious mutations over the inbreed- tions 2–9 is shown in Table 1. Each estimation method ing period, whereWmaxis the trait value of a genotype provides an estimate of the average of dominance coef-free of segregating deleterious mutations. Therefore, ficients for segregating populations (subscript E), with different weightings. In addition, each method provides an inference of the average (arithmetic or harmonic and, (Wmax⫺WO)
2(Wmax⫺WI)
⫽
兺
pisihi兺
pisi⫽hE(s) (8)
again, with different weightings) of dominance coefficients for newly arisen mutations (subscript N), under the as-estimates the arithmetic mean h for segregating
sumption of mutation-selection balance (MSB predictions). deleterious mutations weighted bys. Substituting
Equa-tion 1 into (8) gives a MSB predicEqua-tion as the harmonic
mean ofhfor newly arisen mutations, APPLICATIONS TO A FINITE POPULATION
MSB predictions (see Table 1) assume that the perva-(Wmax⫺ WO)
2(Wmax⫺ WI)
⫽
兺
1兺
(1/hi)⫽h˜N. (9a)
against heterozygotes (p⫽1/hs). This assumption is small effects (Wright1934;KacserandBurns1981;
Keightley 1996). This further complicates the
inter-appropriate only forshⰇ1/2Ne, whereNeis the effective
population size (LiandNei1972). For smallershvalues, pretation of the estimates, as they become dependent on the relationship between dominance coefficients and drift and/or selection against homozygotes become
rel-evant factors limiting the actual pervasiveness. Although homozygous effects according to their different weight-ing factors. Under a negative correlation betweensand the pervasiveness predicted at the MSB goes to infinity
assh decreases (Equation 1), its actual value is always h, the MSB prediction forby.xand 1/bx.ywill decrease, as
they correspond to new mutations’ means weighted by below 2Nedue to drift, even for cases where selection
against homozygotes is irrelevant (Garcı´a-Doradoet al. s (see Table 1). In contrast, the MSB prediction ofhE will increase, as it corresponds to the harmonic mean 2003). Thus, for finite populations of reasonable Ne,
estimates of the average coefficient of dominance are of new mutations weighted by 1/s. However, the actual estimates ofby.x, 1/bx.y, andhEin finite populations can potentially biased depending on the distribution of s
andhvalues. be affected by drift in a manner that is difficult to predict from the MSB predictions.
The first source of bias is that the distribution for the homozygous deleterious effect, f(s), may have a large probability density for deleterious effects close to zero
MUTATIONAL MODELS AND (effectively neutral). This occurs, for example, for a
ESTIMATION PROCEDURE gamma distribution of mutational effects with shape
parameter ⱕ1 (i.e., with coefficient of variation CVⱖ Mutational models and parameters:A model of dele-terious mutations was assumed in which the fitnesses 1), so that f(s) goes to infinity fors⫽ 0. In this case,
the number of effectively neutral mutations predicted (viability) of the wild homozygous, the heterozygous, and the mutant homozygous genotypes were 1, 1⫺sh, at the MSB is much larger than its real value in finite
populations. In the context of the estimate of a wide and 1 ⫺ s, respectively. Homozygous effects for new mutations were sampled from a gamma distribution set of mutational parameters, the problem has been
circumvented by arbitrarily discretizing the continuous with shape parameterand mean effects. Values of larger than one were used to avoid nonzero density distribution assumed for s (Deng and Lynch 1996;
Deng1998;Denget al.2002). functions fors⫽0. Two widely different mutation rates per chromosome per generation, ⫽ 0.2 and 0.006, The second source of bias is that, even for deleterious
mutations that are not effectively neutral (s⬎ 1/2N), with corresponding mean deleterious effects of s ⫽
0.02 and 0.2, respectively, were used to cover the range ifhis small enough that selection against homozygotes
becomes relevant, the MSB prediction of the mutational of estimates supported by experimental evidence for chromosome II Drosophila viability (Garcı´a-Dorado
pervasiveness is again biased upward. Therefore, when
such mutations occur with considerable probability, the et al. 1999; Lynch et al. 1999). A graph showing the gamma distributions used is given in Figure 1a. Lethal MSB prediction for the averagehfor segregating
delete-rious mutations is biased downward. To take an extreme mutations were ignored, as the main interest is centered on the average dominance coefficient of nonlethal dele-example, MSB predicts infinite pervasiveness for
com-pletely recessive deleterious mutations whatever the s terious mutations (SimmonsandCrow1977).
The dominance coefficient of mutations ranged be-value. Thus, if the distribution forhgives positive density
for completely recessive mutations [g(h⫽0)⬎0], the tween 0 and 1 (i.e., over- and underdominant mutations were not considered) and was obtained in two ways. To harmonic mean ofhwill be zero for newly arisen
delete-rious mutations, so that MSB will also predict average use a distribution that gives zero density function for values ofh⫽0, we employed a convex beta distribution dominance of zero for segregating ones (Equation 3).
Again, this has been circumvented by arbitrarily discret- in most cases (Figure 1b). As the variance of dominance coefficients empirically observed byMukai(1969) for izing the continuous distribution assumed forh, so that
very smallh values are disregarded (Mukai1969). Be- newly arisen mutations inD. melanogasterwas2
h⫽0.04,
a value of this order was used in the analysis. Dominance cause those smallhvalues may actually occur for
muta-tions with substantial homozygous deleterious effects, coefficients were assigned tonmutations either at ran-dom or with a negative correlation betweensand h val-this procedure induces a bias that may result in
substan-tially flawed predictions, in particular regarding the in- ues. This correlation was established as follows:nvalues ofsandnvalues ofhwere sampled from the correspond-breeding depression.
Finally, it is likely that there is a negative correlation ing distributions, andnpair values (x,y) were sampled from a normal bivariate distribution with a given corre-betweensandh. Mutants affecting viability in
Drosoph-ila clearly show a negative correlation betweensandh lation. For each variable, the ranking (from lower to higher) of thenvalues was determined. In then(x,y)
(GreenbergandCrow1960;SimmonsandCrow1977;
CaballeroandKeightley1994), and loss-of-function pairs, the variable values were replaced by their ranking
to obtain a sample with n pairs of rank orders. For mutations at loci coding for enzymes acting in metabolic
Figure 1.—(a) Distribution [f(s)] of muta-tional effects, s, for a gamma distribution with shape parameterand mean effects⫽0.2. (b) Distribution [g(h)] of dominance coefficients fol-lowing a beta distribution with meanhand vari-ance2
hof dominance coefficients. (c) Joint
dis-tribution of dominance coefficients, h, and mutational effects,s, for the model of dominance ofCaballeroandKeightley(1994). The values ofhare sampled from a uniform distribution be-tween 0 and the corresponding exponential curve. Parameters are: (1)s⫽0.2,h⫽0.4, ⫽ 2; (2) s⫽ 0.2,h⫽0.2, ⫽ 1.01; (3)s⫽ 0.02, h⫽0.4, ⫽2; and (4) s⫽0.02,h⫽0.4, ⫽ 1.01.
x-value was drawn with the 956th y-value, etc. Then, s overall fitness. However, some cases were considered where our interest is on thesandhvalues for a fitness andh values were paired according to this ranking, so
as to reproduce the rank order pairing obtained in the component (viability), but mutants have a pleiotropic effect on other fitness traits. This is supported by results normal bivariate sample.
The second distribution of dominance coefficients suggesting that most deleterious mutations have pleio-tropic effects on all fitness components (see Lynch
was that proposed byCaballeroandKeightley(1994).
Here,h values were taken from a uniform distribution andWalsh1998, p. 345). Thus, we assumed an overall selection coefficient for fitness ofs⬘ ⫽csforcs⬍1, and between 0 and exp(⫺ks), wherekis a constant allowing
the mean dominance coefficient of newly arisen muta- s⬘ ⫽1 otherwise. Values ofs⬘instead ofswere used for all purposes related to the production of the chromosome tions,hN, to be the desired value (Figure 1c). Note that
partially dominant mutations are allowed with this distri- samples, both through diffusion approximation or simu-lation, whereassvalues were used to compute genotypic bution but only for low values ofs. Thus, the model also
implies a negative correlation betweens andh values. viabilities to obtain estimates. Values of c were taken from a uniform distribution between 1 and 3, implying In most cases we assumed that all selection occurred
specific mutations at random or assuming a given posi- Finally,SN⫽ 兺1q⫽⫺1/21/2NNφN(q) and SM⫽ 兺Mj⫽⫺11φM(j) are the
expected total numbers of segregating loci in the popu-tive correlation between s and c. This correlation was
established by the same procedure as that betweensand lation and in the chromosome sample, respectively. For each particular case and mutational model, 10
h (see above). The rationale for a positive correlation
between s and c is that mutations of large effect are sets of 1000 mutations were sampled and their diffusion stationary frequencies (Equations 10–12) were ob-usually found to be deleterious for several fitness
compo-nents (Hiraizumi and Crow 1960; Ferna´ndez and tained. Fixation probabilities to be used in Equation 10 were calculated by numerical integration using
Simp-Lo´ pez-Fanjul 1996). An average value of c ⫽ 2 was
suggested byMukai(1969) andMukaiandYamaguchi son’s rule. For each set of 1000 mutations, the 1000 expected distributions of gene copy numbers in a sam-(1974) for viability inD. melanogaster(see also
Charles-worthandHughes1999). Note that, for large popula- ple ofMchromosomes,φM(j), and the 1000 expected
total numbers of segregating loci in the sample,SM, were
tions at mutation-selection balance, where homozygotes
stored. Chromosomes were then simulated in which are rare, the above procedure is equivalent to assigning
a number of independent loci were segregating. The a coefficientcto the coefficient of dominance (h) rather
number of loci assigned was equal to the averaged SM
than to the homozygous effect (s). This was the rationale
for all sampled mutations in the set. The assignment of used by Mukai (1969) and Mukai and Yamaguchi
particular mutations to each locus was done by sampling (1974) and would imply that each mutation presents
with replacement from the 1000 mutations with a proba-higher dominance for its effect on fitness than for its
bility proportional to their SM value. The number of
effect on viability.
copies of the mutant allele at each locus was sampled
Diffusion approximations:We usedKimura’s (1969)
from a distribution proportional to the corresponding diffusion approximations under the infinite-sites model
φM(j), and the copies were randomly assigned to the
to obtain the equilibrium frequency distribution of a
chromosomes. The results given below refer to samples mutant with a specific selective effect and dominance
ofM⫽ 100 chromosomes from populations with sizes coefficient in a population at mutation-selection-drift
N ⫽ Ne ⫽ 103, 105, and 107. Some analyses were also balance. Letqbe the frequency of the mutant allele at
done with a larger number of chromosomes (M⫽400), a given locus affecting fitness (viability) and assume a
but the results were similar and are not given. Homozy-randomly mating diploid population of N individuals,
gous and heterozygous fitnesses (viabilities) were calcu-with an effective sizeNe. The stationary distribution of
lated for all combinations of chromosomes [M homo-mutant frequencies for 1/2N ⱕ q ⱕ 1 ⫺ 1/2N in a
zygotes and M(M ⫺ 1)/2 heterozygotes], assuming a nonrecurrent mutation model with infinite
indepen-between-locus multiplicative fitness model. The sam-dent loci was given by Kimura(1969) as
pling of M chromosomes was repeated 100 times for each set of 1000 mutations and the estimates were
aver-N(q)⫽
4N[1⫺u(q)]
q(1⫺q)G(q) , (10) aged. The above procedure was followed for each of the 10 sets of 1000 mutations, and mean estimates and where is the haploid mutation rate per generation, standard errors were obtained from these sets.
G(q) ⫽ exp(2Nesq(q ⫹ 2h ⫺ 2hq)), and u(q) ⫽ The different averages for the coefficient of domi-(兰q
0G(x)dx)/(兰10G(x)dx) is the fixation probability of a nance of newly arisen mutations (representing different mutant with initial frequencyq. MSB predictions, see Table 1) and their standard errors The integral of N(q) with respect to qgives the ex- were obtained from 100 replicates of 10,000 mutations
pected number of mutations segregating with frequency each or calculated from the expected distribution ofs
qwithin the integration interval. As only largeNvalues andhvalues.
are considered, for each possible allelic frequency [i.e., Simulations:These were carried out to check the dif-forq⫽1/2N, 2/2N, 3/2N, . . . , (2N⫺1)/2N] we use fusion results. A single random-mating population of
N⫽1000 individuals was set up with no initial genetic
φN(q)⫽(1/2N)N(q) (11)
variation and run for 10Ngenerations before the extrac-tion of chromosomes. This should allow for a balance as a discrete approximation to兰q⫹1/4N
q⫺1/4NN(x)dx,i.e., as an
between mutation-selection and drift to be reached approximation to the expected number of independent
(KeightleyandHill1989). The simulation of genes
loci withisegregating mutant copies and frequencyq⫽
was made by the use of binary masks and bit-step
opera-i/2Nat the mutation-selection-drift balance.
tors. The model and mutational parameters were the Now assume that a random sample of M
chromo-same as in the diffusion approach. Free recombination somes is taken from the population. The expected
num-was allowed among loci. One hundred samples of 100 ber of loci with jcopies in the sample [φM(j)] can be
chromosomes each were taken from the population at calculated using binomial sampling,
the end of the process to obtain estimates in the same way as above. Ten simulations were run to obtain
stan-φM(j)⫽
兺
1⫺1/2N q⫽1/2N
冢
M j
冣
qj(1⫺
q)M⫺jφ
N(q). (12)
Estimation procedure: The expected average coeffi- viabilities of homozygotes (WI) and heterozygotes (WO), (1⫺ WO)/2(1⫺ WI). The above procedure was repli-cient of dominance of segregating mutations (hE) was
cated, and 10 sets of 100 replicates were used to obtain calculated as the overall average ofhvalues weighted by
standard errors of estimates. their expected frequency in the population’s stationary
In a mutation-accumulation experiment without se-frequency distribution. Thus, for each sampled
muta-lection, the regressionby.xestimates the arithmetic mean
tion i, its expected frequency in the population was
h of newly arisen mutations weighted by the squared calculated asqi ⫽兺x1⫺⫽1/21/2NNxφN(x), and the average
domi-homozygous effects (hN(s2)), whereas the ratio estimates nance was taken over all sampled mutations,hE⫽兺qihi/
the arithmetic mean h of newly arisen mutations 兺qi. To normalize multiplicative viabilities, estimates of
weighted by the homozygous effect (hN(s); see Mukai
regression involving heterozygous and homozygous
1969;Garcı´a-DoradoandCaballero2000). chromosomes (by.x andbx.y) used log-scaled values,
pre-viously scaled by the average heterozygous viability.
Esti-mates were obtained for all chromosomes and only for RESULTS quasi-normal (QN) chromosomes, defined as those
Table 2 shows different estimates of the average coef-chromosomes with homozygous viability⬎60% of the
ficient of dominance for a beta distribution ofhvalues average heterozygous viability, as the main interest is
assigned randomly to new mutations. Averages for newly usually on the average dominance coefficient of mildly
arisen mutations, in italics, represent MSB predictions deleterious mutations (SimmonsandCrow1977).
Cal-for the corresponding estimates from segregating popu-culations for the ratio estimate (Equation 9) used the
lations, derived using the mutant’s pervasiveness for mean homozygous (WO) and mean heterozygous (WI)
infinite populations. Because, for this dominance model, values without scaling and considered all types of
chro-sandh values are uncorrelated for newly arisen muta-mosomes.
tions, the weighting by any function ofsdoes not affect
Estimates from mutation-accumulation experiments:
the expected averages of h. Thus, h˜N(1/s), h˜N(s), and h˜N To assess the bias due to selection for estimates from
equal the harmonic mean, andhN(s)equals the arithme-mutation-accumulation experiments, chromosomes were
tic mean. The other results (non-italic type) correspond constructed where deleterious mutations accumulated
to estimates obtained from segregating populations, us-for t ⫽ 20, 100, or 200 generations in lines of N ⫽
ing diffusion approximations or simulations. The
simu-Ne⫽1 or 2 individuals. The procedure followed for the
lation results are generally in good agreement with the construction of the mutation-accumulation
chromo-corresponding diffusion estimates. some lines was the following. For each line, a number
For small populations, the estimates are generally of mutations Poisson distributed with mean 2Nt was
larger than their MSB predictions to a variable extent sampled from mutational distributions corresponding
that depends on the mutational parameters. The overes-to those from Tables 3 and 4. A transition matrix of
timation (up to 100%) is more evident for the case in (2N⫹ 1)⫻(2N⫹1) with elements
the last column, where the average degree of dominance is smaller. The decrease in bias with increasing
popula-aij⫽
冢
2N i
冣
q⬘i(1⫺ q⬘)2N⫺i, 0ⱕ(i,j)ⱕ2N,
tion numbers is apparent in most cases, showing little or no bias forN ⫽107(but see below). Assandhare where q⬘ ⫽ q ⫺ {sq(1 ⫺ q)[q⫹ h(1 ⫺ 2q)]}/{1 ⫺ 2q independent for newly arisen mutations, this bias should
(1⫺ q)sh⫺ sq2}, withq⫽ j/2N, was used to calculate
be ascribed to MSB predicting an excessive perva-the fixation probability of a given mutation in a line of siveness (Equation 1) for mutations with very smallh sizeN ⫽ Ne. Mutants were included into the chromo- values, as it ignores drift as well as selection against some line with that probability. Note that this procedure homozygotes in finite populations. For example, for a considers selection against segregating deleterious mu- mutation with s ⫽ 0.001 and h ⫽ 0.1, the expected tations at a zygote phase but ignores any segregating pervasiveness in an infinite population is 1/sh⫽10,000 polymorphism at the studied generation. A case was copies, whereas the true pervasiveness in finite popula-also run were all mutations got fixed,i.e., implying no tions would be 3108, 8821, and 9965 for populations selection. One hundred chromosome lines were con- with 103, 105, and 107 individuals. The corresponding structed in this way, and the homozygous and heterozy- pervasiveness for a mutation withs⫽0.01 andh⫽0.01 gous viabilities were calculated assuming multiplicative would be 879, 5193, and 9759, respectively. This shows between-locus gene action. The above procedure simu- that, in finite populations, the largers, the lower the lates selection within lines, but not selection between pervasiveness, as increasing s favors purging selection lines. To simulate line extinction as well, 0, 5, or 10% against homozygotes.
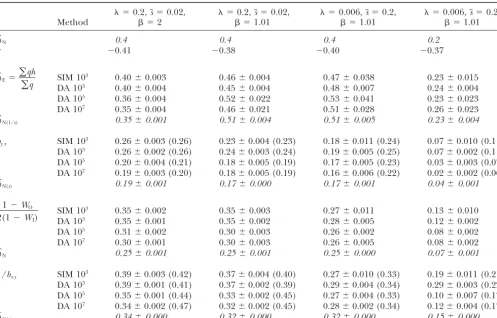
TABLE 2
Estimates of the average coefficient of dominance (⫾standard error) for a model wherehNfollows a beta distribution
with meanhN⫽0.4 or 0.2, and variance2h⫽0.04 or 0.02, respectively, and values are uncorrelated withs
⫽0.2,s⫽0.02, ⫽0.2,s⫽0.02, ⫽0.006,s⫽0.2, ⫽0.006,s⫽0.2,
Method  ⫽2  ⫽1.01  ⫽1.01  ⫽1.01
hN 0.4 0.4 0.4 0.2
hE⫽
兺
qh兺
q SIM 103 0.32⫾0.003 0.34⫾0.002 0.31⫾0.024 0.14⫾0.013
DA 103 0.32⫾0.004 0.35⫾0.003 0.32⫾0.007 0.15⫾0.004
DA 105 0.27⫾0.004 0.31⫾0.014 0.26⫾0.011 0.13⫾0.013
DA 107 0.25⫾0.004 0.30⫾0.022 0.30⫾0.022 0.09⫾0.006
h˜N(1/s) 0.25 0.25 0.25 0.07
by.x SIM 103 0.32⫾0.004 (0.32) 0.31⫾0.001 (0.31) 0.23⫾0.022 (0.25) 0.10⫾0.005 (0.11)
DA 103 0.31⫾0.003 (0.31) 0.31⫾0.004 (0.31) 0.24⫾0.003 (0.26) 0.10⫾0.004 (0.12) DA 105 0.26⫾0.003 (0.26) 0.25⫾0.007 (0.26) 0.21⫾0.007 (0.23) 0.06⫾0.003 (0.08) DA 107 0.25⫾0.005 (0.25) 0.25⫾0.006 (0.25) 0.21⫾0.004 (0.22) 0.06⫾0.002 (0.07)
h˜N(s) 0.25 0.25 0.25 0.07
1⫺WO 2(1⫺WI)
SIM 103 0.36⫾0.002 0.36⫾0.001 0.27⫾0.015 0.13⫾0.006
DA 103 0.35⫾0.001 0.36⫾0.001 0.28⫾0.003 0.13⫾0.002
DA 105 0.31⫾0.001 0.31⫾0.001 0.25⫾0.004 0.09⫾0.002
DA 107 0.30⫾0.003 0.30⫾0.004 0.25⫾0.004 0.07⫾0.001
h˜N 0.25 0.25 0.25 0.07
1/bx.y SIM 103 0.43⫾0.002 (0.44) 0.43⫾0.004 (0.44) 0.33⫾0.013 (0.36) 0.21⫾0.009 (0.25)
DA 103 0.43⫾0.001 (0.44) 0.43⫾0.002 (0.44) 0.34⫾0.003 (0.36) 0.21⫾0.003 (0.24) DA 105 0.40⫾0.002 (0.47) 0.40⫾0.003 (0.47) 0.32⫾0.004 (0.35) 0.15⫾0.003 (0.18) DA 107 0.40⫾0.002 (0.52) 0.40⫾0.004 (0.51) 0.32⫾0.003 (0.35) 0.15⫾0.002 (0.18)
hN(s) 0.40 0.40 0.40 0.20
DA 10n, diffusion approximation for a population of sizeN⫽10n; SIM 103, simulation results for a population of sizeN⫽ 103; MSB predictions (in italics) are analytically derived expectations., haploid mutation rate per chromosome and generation; s, mean homozygous mutational effect;, shape parameter for the gamma distribution of mutational effects. Values in parentheses correspond to estimates from quasi-normal chromosomes.
when the multiplicative effect of many deleterious muta- scaling effects discussed above when large deleterious effects are expressed (columns 3 and 4). Furthermore, tions causes a high depression associated with
inbreed-ing (i.e., Table 2, columns 1 and 2, where Ne ⫽ 107). computing 1/bx.y for quasi-normal chromosomes (the
usual procedure) gives too high estimates, particularly This bias is avoided using log-transformed viabilities
(re-sults not shown). In fact, the regression estimates (by.x for higher population sizes. This is equivalent to
truncat-ing the dependent variable (xin this case), so that we no and 1/bx.y) do not show this bias as they are estimated
from log-transformed data. However, this transforma- longer have randomly sampled values of the dependent variable for each considered value of the independent tion, in turn, causes some downward bias (up toⵑ25%)
in the cases in columns 3 and 4, where deleterious effects one (y in this case). When doing so, xis reduced in
the same proportion asxy, but in a greater proportion
are large. This bias disappears when estimates are
ob-tained in the real scale (results not shown). Note that, thany, leading to a reduction of the regressionby.x ⫽
xy/y and, therefore, to an increase of the 1/bx.y
esti-in the cases esti-in columns 3 and 4, esti-individuals rarely carry
more than one deleterious mutation, so that the advan- mate.
Table 3 gives estimates when the coefficient of domi-tage of log-transformation in linearizing multiplicative
effects is overcome by the disadvantage of distorting nance of new mutations is beta distributed andsandh
are negatively correlated (r ⬇ ⫺0.4). Again, estimates large effects.
The estimates of 1/bx.y behave well for cases where are generally above their MSB predictions for small
pop-ulation sizes and the difference tends to disappear with most genetic variance is due to segregating deleterious
mutations with small effect (Table 2, columns 1 and 2), increasing ones. Furthermore, h˜N(1/s)is larger thanh˜N, as weighting by 1/sincreases the weight for largehdue giving the arithmetic mean of dominance for newly
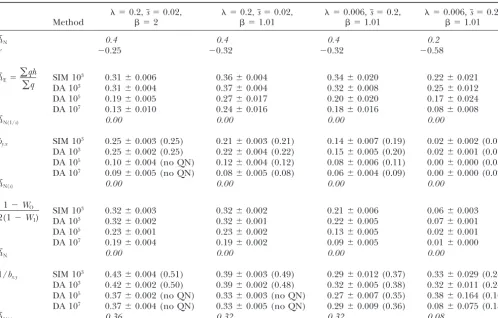
log-TABLE 3
Estimates of the average coefficient of dominance (⫾standard error) for a model wherehNfollowd a beta distribution
with meanhN⫽0.4 or 0.2 and variance2h⫽0.04 or 0.02, respectively, and has a correlation withsvalues ofr⬇⫺0.4 ⫽0.2,s⫽0.02, ⫽0.2,s⫽0.02, ⫽0.006,s⫽0.2, ⫽0.006,s⫽0.2,
Method  ⫽2  ⫽1.01  ⫽1.01  ⫽1.01
hN 0.4 0.4 0.4 0.2
r ⫺0.41 ⫺0.38 ⫺0.40 ⫺0.37
hE⫽
兺
qh兺
q SIM 103 0.40⫾0.003 0.46⫾0.004 0.47⫾0.038 0.23⫾0.015
DA 103 0.40⫾0.004 0.45⫾0.004 0.48⫾0.007 0.24⫾0.004
DA 105 0.36⫾0.004 0.52⫾0.022 0.53⫾0.041 0.23⫾0.023
DA 107 0.35⫾0.004 0.46⫾0.021 0.51⫾0.028 0.26⫾0.023
h˜N(1/s) 0.35⫾0.001 0.51⫾0.004 0.51⫾0.005 0.23⫾0.004
by.x SIM 103 0.26⫾0.003 (0.26) 0.23⫾0.004 (0.23) 0.18⫾0.011 (0.24) 0.07⫾0.010 (0.11)
DA 103 0.26⫾0.002 (0.26) 0.24⫾0.003 (0.24) 0.19⫾0.005 (0.25) 0.07⫾0.002 (0.11) DA 105 0.20⫾0.004 (0.21) 0.18⫾0.005 (0.19) 0.17⫾0.005 (0.23) 0.03⫾0.003 (0.07) DA 107 0.19⫾0.003 (0.20) 0.18⫾0.005 (0.19) 0.16⫾0.006 (0.22) 0.02⫾0.002 (0.06)
h˜N(s) 0.19⫾0.001 0.17⫾0.000 0.17⫾0.001 0.04⫾0.001
1⫺WO
2(1⫺WI) SIM 10
3 0.35⫾0.002 0.35⫾0.003 0.27⫾0.011 0.13⫾0.010
DA 103 0.35⫾0.001 0.35⫾0.002 0.28⫾0.005 0.12⫾0.002
DA 105 0.31⫾0.002 0.30⫾0.003 0.26⫾0.002 0.08⫾0.002
DA 107 0.30⫾0.001 0.30⫾0.003 0.26⫾0.005 0.08⫾0.002
h˜N 0.25⫾0.001 0.25⫾0.001 0.25⫾0.000 0.07⫾0.001
1/bx.y SIM 103 0.39⫾0.003 (0.42) 0.37⫾0.004 (0.40) 0.27⫾0.010 (0.33) 0.19⫾0.011 (0.21)
DA 103 0.39⫾0.001 (0.41) 0.37⫾0.002 (0.39) 0.29⫾0.004 (0.34) 0.29⫾0.003 (0.22) DA 105 0.35⫾0.001 (0.44) 0.33⫾0.002 (0.45) 0.27⫾0.004 (0.33) 0.10⫾0.007 (0.17) DA 107 0.34⫾0.002 (0.47) 0.32⫾0.002 (0.45) 0.28⫾0.002 (0.34) 0.12⫾0.004 (0.17)
hN(s) 0.34⫾0.000 0.32⫾0.000 0.32⫾0.000 0.15⫾0.000
Parameters and definitions are as in Table 2. MSB predictions (in italics) were calculated from 1,000,000 sampled mutations, using the expressions in Table 1.
tions (by.x and 1/bx.y) decrease with a negativer, as more deleterious effects (right side). The bottom shows the
average selection coefficient for mutations of different weight is given to mutations of low h. Finally, h˜N and
the corresponding ratio estimate are not affected by a classes of h, comparing again newly arisen mutations (lines) and segregating ones (bars). The elimination of negativer, as they apply to unweightedhfor newly arisen
mutations. Unfortunately, only bounds can usually be mutations implies that, for each h class, the average s
for segregating mutations is lower than that for new computed for the ratio estimate (upper bounds if the
trueh˜N ⬍ 0.5), as the expected fitness of a genotype ones.
Table 4 gives estimates obtained when the coefficient carrying no deleterious mutations is unknown. Biases
similar to those shown in Table 2 due to the multiplica- of dominance of new mutations h is uniformly distrib-uted between 0 and a value exponentially decreasing tive effects and log-scaling are also seen in Table 3.
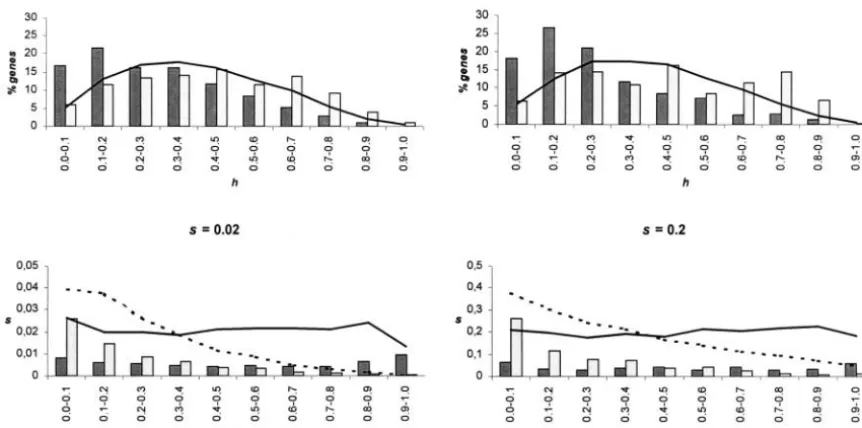
Figure 2 shows some parameters for the mutational with s (see Figure 1c). Because values of h ⫽ 0 are possible for any givens, MSB predictions involving the models in columns 2 and 3 of Tables 2 (r ⫽0) and 3
(r ⫽ ⫺0.4). The top shows the percentage of newly inverse ofh(harmonic means) are null. However, since drift reduces the pervasiveness of mutations withh⬇0 arisen mutations with differenthvalues (line) and the
corresponding percentages for segregating mutations below its MSB prediction, estimates from segregating populations are not too different from those obtained (bars). If there is no correlation betweensandh(darkly
shaded bars) segregating recessive mutations are rela- for the previous model with similar r(Table 3) unless the population size is very large. For this model, cases tively more frequent than newly arisen ones, whereas the
opposite occurs for dominant mutations. For a negative with a large rate of deleterious mutations (columns 1 and 2) produce equilibrium populations where almost correlation betweensandh (r⫽ ⫺0.4, lightly shaded
bars), the effect is reversed, as more dominant muta- all chromosomes have severely impaired viability when homozygous, so that there are virtually no chromosomes tions are associated with lower deleterious effects. These
Figure2.—Mutational parameters for newly arisen and segregating mutations for a model of dominance coefficients following a beta distribution with mean valuehN⫽0.4 and variance2
h⫽0.04. Left, mutational model for ⫽0.2,s⫽0.02, ⫽1.01.
Right, mutational model for ⫽0.006,s⫽ 0.2, ⫽1.01. Top, percentage of newly arisen (line) and segregating mutations (bars) for different classes ofh. Bottom, average coefficient of selection of newly arisen (lines) and segregating mutations (bars) for different classes ofh. Darkly shaded bars and solid lines, no correlation betweensandh(r⫽0); lightly shaded bars and dashed lines,r⫽ ⫺0.4. Results for newly arisen and segregating mutations are based on draws of 1,000,000 and 1000 mutations, respectively.
with empirical observations, implying that such large is smaller for QN chromosomes, which, by definition, exclude all chromosomes with low homozygous viability. rates of mildly deleterious mutations are incompatible
with the model of dominance used in Table 4. However, Table 5 shows estimates of the average coefficient of dominance assuming that mutations affecting the trait selection through pleiotropic effects on other fitness
components can cause an additional reduction in the of interest have an overall negative pleiotropic effect on global fitness. This is incorporated as a total mutational deleterious frequency and a corresponding increase in
the frequency of QN chromosomes (see below). fitness effects⬘ ⫽cs, wherecis a random variable with uniform distribution between 1 and 3, either uncorre-The behavior of 1/bx.y is similar to that reported in
Tables 2 and 3, except for the extremely large estimates lated tosvalues or with a positive correlation of 0.5 for the normal bivariate used to establish the correlation. (a 400% upward bias) obtained in the last column of
Table 4 forNe⫽103and 105. We found that, in addition A comparison can be made between these estimates and the corresponding ones in Tables 3 and 4 (which would to the overestimation caused by finite population size,
in this case there is an additional overestimation due correspond toc⫽1). Ifsandhare uncorrelated, there is also no correlation betweencandhvalues and, there-to an increase in the genetic variance of outcrossed
individuals (2
y) following theN⫽100 bottleneck corre- fore, estimates of the averagehare not expected to be
affected by pleiotropy. In contrast, when s and c are sponding to the analyzed samples. This increase in2
y
after bottlenecking is expected in situations when a correlated, there is also a negative correlation between
h andc implying a lower frequency of mutations with large proportion of the genetic variance is due to
domi-nance deviations (Robertson 1952), as is the case for lowh. Thus, estimates of the averagehare expected to increase. This is observed in Table 5, but only by a the parameters in column 4 (see also Tables 4 and 5
inGarcı´a-Dorado2003). The reason is the increased negligible amount, indicating that for moderate
correla-tion between the effects for different fitness compo-expression of recessive deleterious mutations due to the
increased homozygosity caused by sampling. This bias nents, the impact of pleiotropy on the estimation ofh
is very small. However, the increased efficiency of selec-increases up to 30% with an additional bottleneck
caused by resampling 100 chromosomes from the origi- tion causes higher frequencies of QN chromosomes, which is of particular interest under the model in Table nal 100-chromosome sample (results not shown),
equiv-alent to one generation of maintenance in the labora- 4. Thus, under this model the proportion of QN chro-mosomes is 60 and 46% forr(s,c)⫽0 and 0.5, respec-tory before the chromosome analysis. This warns against
inadvertent overestimation due to the original sampling tively (Table 5B).
TABLE 4
Estimates of the average coefficient of dominance (⫾standard error) for a model wherehfollows a uniform distribution between 0 and exp(⫺ks), with meanhN⫽0.4 or 0.2
⫽0.2,s⫽0.02, ⫽0.2,s⫽0.02, ⫽0.006,s⫽0.2, ⫽0.006,s⫽0.2,
Method  ⫽2  ⫽1.01  ⫽1.01  ⫽1.01
hN 0.4 0.4 0.4 0.2
r ⫺0.25 ⫺0.32 ⫺0.32 ⫺0.58
hE⫽
兺
qh兺
q SIM 103 0.31⫾0.006 0.36⫾0.004 0.34⫾0.020 0.22⫾0.021
DA 103 0.31⫾0.004 0.37⫾0.004 0.32⫾0.008 0.25⫾0.012
DA 105 0.19⫾0.005 0.27⫾0.017 0.20⫾0.020 0.17⫾0.024
DA 107 0.13⫾0.010 0.24⫾0.016 0.18⫾0.016 0.08⫾0.008
h˜N(1/s) 0.00 0.00 0.00 0.00
by.x SIM 103 0.25⫾0.003 (0.25) 0.21⫾0.003 (0.21) 0.14⫾0.007 (0.19) 0.02⫾0.002 (0.07)
DA 103 0.25⫾0.002 (0.25) 0.22⫾0.004 (0.22) 0.15⫾0.005 (0.20) 0.02⫾0.001 (0.07) DA 105 0.10⫾0.004 (no QN) 0.12⫾0.004 (0.12) 0.08⫾0.006 (0.11) 0.00⫾0.000 (0.03) DA 107 0.09⫾0.005 (no QN) 0.08⫾0.005 (0.08) 0.06⫾0.004 (0.09) 0.00⫾0.000 (0.02)
h˜N(s) 0.00 0.00 0.00 0.00
1⫺WO
2(1⫺WI) SIM 10
3 0.32⫾0.003 0.32⫾0.002 0.21⫾0.006 0.06⫾0.003
DA 103 0.32⫾0.002 0.32⫾0.001 0.22⫾0.005 0.07⫾0.001
DA 105 0.23⫾0.001 0.23⫾0.002 0.13⫾0.005 0.02⫾0.001
DA 107 0.19⫾0.004 0.19⫾0.002 0.09⫾0.005 0.01⫾0.000
h˜N 0.00 0.00 0.00 0.00
1/bx.y SIM 103 0.43⫾0.004 (0.51) 0.39⫾0.003 (0.49) 0.29⫾0.012 (0.37) 0.33⫾0.029 (0.24)
DA 103 0.42⫾0.002 (0.50) 0.39⫾0.002 (0.48) 0.32⫾0.005 (0.38) 0.32⫾0.011 (0.24) DA 105 0.37⫾0.002 (no QN) 0.33⫾0.003 (no QN) 0.27⫾0.007 (0.35) 0.38⫾0.164 (0.16) DA 107 0.37⫾0.004 (no QN) 0.33⫾0.005 (no QN) 0.29⫾0.009 (0.36) 0.08⫾0.075 (0.18)
hN(s) 0.36 0.32 0.32 0.08
The variance ofhis2
h⫽0.06–0.07. The correlation betweensandh(r) is given in the table. Parameters and definitions are
as in Table 2.
cient of dominance from mutation-accumulation exper- tive size of the segregating population is very large (Neⱖ 105). The ratio estimate has expected valueh
N(s), so that
iments. The regression of heterozygous on homozygous
chromosomes,by.x, and the ratio of mean viabilities are it can be directly compared to the 1/bx.yestimate from
segregating populations, which behaves in a more er-given for chromosomes assumed to have accumulated
mutations for 100 generations (results for 20 and 200 ratic way due to opposing biases. generations were similar and are not shown). Because
rates and effects of mutations are estimated in
mutation-DISCUSSION accumulation experiments, we can decide, depending
on the latter, what scale should be used for estimating We have investigated the sources of bias that affect the most commonly used methods of estimation of the the average coefficient of dominance. Thus, we used a
log scale for models of large mutation rate (columns 1 average degree of dominance of deleterious mutations from segregating populations. We first discuss two and 2) and a real scale for models of low mutation rate
and large deleterious effects (columns 3 and 4). The sources of bias that affect all the estimators considered: the finite population size and its effect for different mutation lines were assumed to have one individual
(such as in hermaphroditic or selfing species) or two distributions ofh and the scaling problems related to between-locus multiplicative fitness. Then, we consider individuals (such as in full-sib lines). For a mutational
model of low homozygous effect (columns 1 and 2) each of the estimators and their more relevant specific sources of bias, such as the likely negative correlation there is almost no bias due to selection. However, for
mutational models of large average effect (columns 3 between selective and dominance coefficients, the bot-tlenecks that occur during the initial sample of chromo-and 4), purging selection induces an overestimation of
the predictions. Nevertheless, the relative bias caused somes, or the use of QN chromosomes instead of all chromosomes.
(i.e., the ratio “bias/theoretical prediction for the
effec-TABLE 5
Estimates of the average coefficient of dominance (⫾standard error) for a model of mutations with pleiotropic effects on fitness
⫽0.2,s⫽0.02,hN⫽0.4 ⫽0.006,s⫽0.2,hN⫽0.2
r(s,c) 0.0 0.5 0.0 0.5
A.
hE⫽
兺
qh兺
q 0.51⫾0.022 0.54⫾0.024 0.21⫾0.012 0.25⫾0.018by.x 0.17⫾0.003 (0.18) 0.19⫾0.006 (0.19) 0.03⫾0.002 (0.07) 0.03⫾0.002 (0.07)
1⫺WO 2(1⫺WI)
0.28⫾0.002 0.31⫾0.003 0.08⫾0.001 0.09⫾0.002
1/bx.y 0.32⫾0.002 (0.33) 0.34⫾0.003 (0.34) 0.13⫾0.008 (0.15) 0.12⫾0.005 (0.16)
B.
hE⫽
兺
qh兺
q 0.28⫾0.031 0.29⫾0.021 0.12⫾0.006 0.16⫾0.015by.x 0.11⫾0.004 (0.12) 0.11⫾0.003 (0.12) 0.00⫾0.000 (0.03) 0.00⫾0.000 (0.03)
1⫺WO 2(1⫺WI)
0.19⫾0.003 0.19⫾0.003 0.02⫾0.001 0.02⫾0.000
1/bx.y 0.34⫾0.004 (0.88) 0.35⫾0.002 (0.81) 0.11⫾0.099 (0.15) 0.22⫾0.174 (0.16)
The coefficient of selection for fitness is cs, wherec is uniformly distributed between 1 and 3, and the intended correlation betweensandcisr(s,c). Results are from diffusion approximation for a population of sizeN⫽105. (A) Model wherehfollows a beta distribution (r⬇⫺0.4;2
h⫽0.04 and 0.02 forhN⫽0.4 and
0.2, respectively). (B) Model wherehfollows a uniform distribution between 0 and exp(⫺ks) (2
h⫽0.06;r⬇ ⫺0.32 and⫺0.58 forhN⫽0.4 and 0.2, respectively). ⫽1.01. Parameters and definitions are as in Table 2.
on the finite size of populations, a key factor that has hfor new mutations. Thus, segregating recessive delete-rious mutations (h ⫽ 0) would have infinite perva-not been considered before. On the basis of MSB
predic-tions, estimators from segregating infinite populations siveness in infinite populations but are lost by drift or purged by selection against homozygotes in small ones. would provide inferences on the average coefficient of
dominance of newly arisen mutations (h) weighted in In general, large empirical estimates of the average coef-ficient of dominance from natural populations could different ways by their selection coefficients (s; see Table
1). Our results show that, in finite segregating popula- be explained, to some extent, by the population having small long-term effective population size instead of by tions, the expected values for those estimators may be
substantially above the MSB predictions, so that they gene action for new mutations being close to additive.
The importance of the distribution of h:The bias of infer-provide overestimated inferences of dominance for
newly arisen mutations. The reason is that, for mutants ences on newly arisen mutations due to finite popula-tion size depends heavily on the distribupopula-tion of domi-with low sh values, the MSB prediction of the
perva-siveness (1/sh; Garcı´a-Dorado et al. 2003) is larger nance values. We have used two completely different distributions of h values. One, a beta distribution, has than the actual pervasiveness in finite populations. In
other words, the number of copies in the population the practical advantage of having a density of zero for values ofh⫽0, which is useful to check the fit between for mutants with low shis expected to be much lower
in a finite population than in an infinite one. Even estimates and MSB predictions based on the harmonic mean of h. The variance of h values assumed for this for models excluding completely recessive gene action
(Tables 2 and 3), the relative overestimation whenNe⫽ distribution was around the empirical estimate obtained
byMukai(1969) (2
h⫽0.044⫾ 0.014), and
intermedi-103 can be up to 75% of the MSB prediction for the
regression estimates. Although the bias for those models ate negative correlations between s and h values were introduced (r ⬇ ⫺0.4). In a second distribution, first is small when Ne ⱖ 105, it can be substantial for any
population size when the distribution of h allows for proposed by Caballero and Keightley (1994), and supported by some experimental evidence, the ex-effectively recessive deleterious mutations (see Table 4),
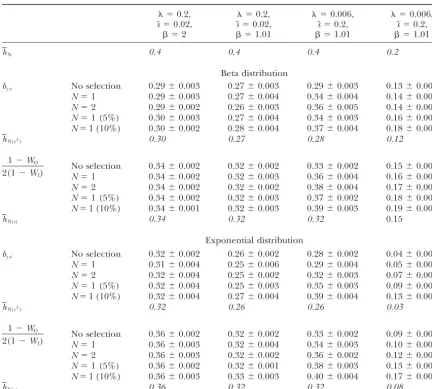
TABLE 6
Estimates of the average coefficient of dominance (⫾standard error) from a mutation-accumulation experiment of 100 generations using lines of sizeN⫽Ne
⫽0.2, ⫽0.2, ⫽0.006, ⫽0.006,
s⫽0.02, s⫽0.02, s⫽0.2, s⫽0.2,
 ⫽2  ⫽1.01  ⫽1.01  ⫽1.01
hN 0.4 0.4 0.4 0.2
Beta distribution
by.x No selection 0.29⫾0.003 0.27⫾0.003 0.29⫾0.003 0.13⫾0.003
N⫽1 0.29⫾0.003 0.27⫾0.004 0.34⫾0.004 0.14⫾0.002
N⫽2 0.29⫾0.002 0.26⫾0.003 0.36⫾0.005 0.14⫾0.002
N⫽1 (5%) 0.30⫾0.003 0.27⫾0.004 0.34⫾0.003 0.16⫾0.002 N⫽1 (10%) 0.30⫾0.002 0.28⫾0.004 0.37⫾0.004 0.18⫾0.002
hN(s2) 0.30 0.27 0.28 0.12
1⫺WO 2(1⫺WI)
No selection 0.34⫾0.002 0.32⫾0.002 0.33⫾0.002 0.15⫾0.002
N⫽1 0.34⫾0.002 0.32⫾0.003 0.36⫾0.004 0.16⫾0.001
N⫽2 0.34⫾0.002 0.32⫾0.002 0.38⫾0.004 0.17⫾0.002
N⫽1 (5%) 0.34⫾0.002 0.32⫾0.003 0.37⫾0.002 0.18⫾0.002 N⫽1 (10%) 0.34⫾0.001 0.32⫾0.003 0.39⫾0.003 0.19⫾0.002
hN(s) 0.34 0.32 0.32 0.15
Exponential distribution
by.x No selection 0.32⫾0.002 0.26⫾0.002 0.28⫾0.002 0.04⫾0.001
N⫽1 0.31⫾0.004 0.25⫾0.006 0.29⫾0.004 0.05⫾0.000
N⫽2 0.32⫾0.004 0.25⫾0.002 0.32⫾0.003 0.07⫾0.001
N⫽1 (5%) 0.32⫾0.004 0.25⫾0.003 0.35⫾0.003 0.09⫾0.001 N⫽1 (10%) 0.32⫾0.004 0.27⫾0.004 0.39⫾0.004 0.13⫾0.003
hN(s2) 0.32 0.26 0.26 0.03
1⫺WO 2(1⫺WI)
No selection 0.36⫾0.002 0.32⫾0.002 0.33⫾0.002 0.09⫾0.000
N⫽1 0.36⫾0.003 0.32⫾0.004 0.34⫾0.003 0.10⫾0.001
N⫽2 0.36⫾0.003 0.32⫾0.002 0.36⫾0.002 0.12⫾0.002
N⫽1 (5%) 0.36⫾0.002 0.32⫾0.001 0.38⫾0.003 0.13⫾0.002 N⫽1 (10%) 0.36⫾0.003 0.33⫾0.003 0.40⫾0.004 0.17⫾0.003
hN(s) 0.36 0.32 0.32 0.08
The distribution ofhfollows a beta distribution with correlationr⫽ ⫺0.4 betweensandhor a uniform distribution between 0 and exp(⫺ks). Selection is assumed to occur only within lines or both within and between lines, with 5 or 10% truncation of the lowest viability lines. Estimates for ⫽0.2 use log-scale data whereas those for ⫽0.006 use real-scale data. Parameters and definitions are as in Table 2.
see Table 4], but with a substantial dispersion ofhvalues. where the h values were given by h ⫽ 1⁄2exp(⫺ks), so thath was almost completely determined bysand the This distribution represents a situation where
deleteri-ous mutations of any effect can occasionally be com- correlation between s and h was close to ⫺1. Using this dominance model, Deng (1998) investigated the pletely recessive and illustrates how in those situations
strict MSB predictions involving the harmonic mean predictive value of the regressionby.xand an alternative
analogous method proposed by him (see above). He will never apply. This model seems to be incompatible
with high rates of even mildly deleterious mutations showed that these methods give underestimations of
hN, even in the absence of overdominance. He did not (Table 4, columns 1 and 2), as the accumulation of
recessive ones renders QN chromosomes highly improb- compare, however, the estimators with their MSB pre-dictions. If this were done, the predictions would have able. However, the inclusion of pleiotropic effects on
other fitness traits reduces the accumulation of such been seen to be fairly accurate for two reasons. First, the distribution ofhused by Deng allows for little variance of mutations producing a sufficient frequency of QN
chro-mosomes. h(2
h⫽ 0.003–0.017 under his mutational models), so
that the harmonic mean ofhfor newly arisen mutations A relatively similar distribution was used byDengand