GENETICS | INVESTIGATION
The Evolution of Sel
fi
ng Is Accompanied by
Reduced Ef
fi
cacy of Selection and Purging
of Deleterious Mutations
Ramesh Arunkumar,*,1Rob W. Ness,†Stephen I. Wright,* and Spencer C. H. Barrett*
*Department of Ecology and Evolutionary Biology, University of Toronto, Toronto, Ontario, Canada, M5S 3B2, and†Institute of Evolutionary Biology, University of Edinburgh, Ashworth Laboratories, EH9 3FL Edinburgh, Scotland
ABSTRACTThe transition from outcrossing to selfing is predicted to reduce the genome-wide efficacy of selection because of the lower
effective population size (Ne) that accompanies this change in mating system. However, strongly recessive deleterious mutations exposed in the homozygous backgrounds of selfers should be under strong purifying selection. Here, we examine estimates of the distribution of fitness effects (DFE) and changes in the magnitude of effective selection coefficients (Nes) acting on mutations during the transition from outcrossing to selfing. Using forward simulations, we investigated the ability of a DFE inference approach to detect the joint influence of mating system and the dominance of deleterious mutations on selection efficacy. We investigated predictions from our simulations in the annual plantEichhornia paniculata, in which selfing has evolved from outcrossing on multiple occasions. We used range-wide sampling to generate population genomic datasets and identified nonsynonymous and synonymous polymorphisms segregating in outcrossing and selfing populations. We found that the transition to selfing was accompanied by a change in the DFE, with a larger fraction of effectively neutral sites (Nes,1), a result consistent with the effects of reducedNein selfers. Moreover, an increased proportion of sites in selfers were under strong purifying selection (Nes.100), and simulations suggest that this is due to the exposure of recessive deleterious mutations. We conclude that the transition to selfing has been accompanied by the genome-wide influences of reducedNeand strong purifying selection against deleterious recessive mutations, an example of purging at the molecular level.
KEYWORDSmating system; selection efficacy;Eichhornia paniculata; effective population size; dominance
M
ATING system transitions provide important opportu-nities to investigate the influence of genetic drift and natural selection on plant genomes. The evolution of predominant self-fertilization (selfing) from cross-fertilization (outcrossing) is recognized as the most frequent evolutionary transition involving the reproductive systems of flowering plants (Stebbins 1957). Although selfing may be favored in the short term, due to the transmission advantage of selfing variants and ability of individuals to set seed in pollen-limited conditions, selfing species represent only 10–15% of angio-sperms and predominant selfing is often viewed as an evolu-tionary dead end (reviewed in Igic and Busch 2013; Wrightet al. 2013; Barrett et al. 2014). The ephemeral nature of
selfing lineages may be primarily due to the accumulation of
deleterious mutations (Charlesworthet al.1993a). Also, a re-duced rate of fixation of beneficial mutations can limit the ability of selfing populations to adapt to changing environ-ments (Glémin and Ronfort 2013). Nevertheless, empirical sup-port for selfing as an evolutionary dead end is mixed (reviewed in Takebayashi and Morrell 2001; Igic and Busch 2013). Char-acterizing the frequency of mutations and selection pressures acting on them in selfing populations should provide insight into why some populations persist while others go extinct.
Theoretical models predict the efficacy of selection should be lower in genomes of selfing compared to outcrossing populations, because all else being equal, the effective pop-ulation size (Ne) is reduced in selfers (Charlesworth et al.
1993b; Charlesworth and Wright 2001; Wright et al.2008). In selfers,Neis reduced owing to restricted recombination but also by demographic factors because single individuals have the ability to found colonies resulting in population bottlenecks (Baker 1955; Lloyd 1980; Charlesworth and Wright 2001; Pannell and Fields 2014). With a genome-wide reduction in the Ne of selfers, genetic drift will become more prevalent, reducing genetic variation and limiting the efficacy of selection. Copyright © 2015 by the Genetics Society of America
doi: 10.1534/genetics.114.172809
Manuscript received November 15, 2014; accepted for publication December 24, 2014; published Early Online December 30, 2014.
Supporting information is available online athttp://www.genetics.org/lookup/suppl/ doi:10.1534/genetics.114.172809/-/DC1.
1Corresponding author: 25 Willcocks St., Toronto, ON, Canada, M5S 3B2.
E-mail: [email protected]
Moreover, greater linkage among weakly selected sites under opposing selective forces may interfere with selection efficiency (McVean and Charlesworth 2000; Comeronet al.2008). Thus, both demographic and genetic processes in selfing populations can interact to reduce the efficacy of natural selection.
Early investigations of the genomic consequences of tran-sitions from outcrossing to selfing based on divergence among related outcrossing and selfing species provided limited support for theoretical predictions of a reduced efficacy of selection in selfing populations [e.g.,Arabidopsis(Wrightet al.2002),
Mimulus (Sweigart and Willis 2003), Caenorhabditis (Cutter
et al. 2006), and Triticeae (Haudryet al.2008; Escobar et al.
2010)]. More recentfindings of elevated levels of deleterious polymorphisms or a greater frequency of unpreferred codons in selfingArabidopsis(Caoet al.2011; Qiuet al.2011),Eichhornia
(Nesset al. 2012),Capsella(Qiuet al. 2011; Brandvainet al.
2013; Slotteet al.2013),Collinsia(Hazzouriet al.2013), and
Neurospora(Giotiet al.2013) are consistent with the hypothe-sis of relaxed selection in selfing populations.
The efficacy of selection in selfing populations will also be affected by how strongly recessive mutations are masked by heterozygosity. A negative relation between the dominance of mutations and their deleterious effects has been hy-pothesized (Simmons and Crow 1977; Crow and Simmons 1983). Since deleterious mutations are on average partially recessive (h 0.2–0.25; Agrawal and Whitlock 2011; Manna et al.2011), the more homozygous backgrounds of selfing populations offer fewer chances for the masking of mutations, and this should result in more effective selection against deleterious mutations (Pollak 1987; Caballero and Hill 1992; Charlesworth 1992; Glémin 2007). Indeed, theory pre-dicts that strongly deleterious, highly recessive mutations are more likely to be purged by selection after recurrent inbreeding (Hedrick 1994; Wanget al.1999), even though both strongly and mildly deleterious mutations contribute to inbreeding de-pression (Charlesworth and Charlesworth 1999; Wang et al.
1999; Charlesworth and Willis 2009). If a large proportion of deleterious mutations are strongly recessive, selfing populations could persist if deleterious mutation load is purged (Barrett and Charlesworth 1991; Glémin and Ronfort 2013). Purging has been documented across mammals, insects, mollusks, and plants, based on assays offitness traits (Crnokrak and Barrett 2002). More recently, Szövényiet al.(2014) using divergence-based metrics found genomic evidence for stronger selective pressures acting on a moss species with haploid-dominant life cycle undergoing intragametophytic selfing. However, they found no evidence for the role of reducedNe.
One reason for the weak empirical support for theoretical expectations on changes in selection efficacy could be that the effects of reducedNeand increased homozygosity coun-teract one another in selfers. A reduction inNeis expected to lower selection efficacy, whereas increased homozygosity should make selection more efficient by exposing recessive mutations. Glémin (2007) predicted that relaxed selection should be detected under a range of mutation and popula-tion size parameters in spite of the countervailing effect of
homozygosity. Moreover, he found that divergence-based measures of selection were more likely to reveal differences compared to those based on polymorphism data. However, recently derived selfing lineages, which may be most com-mon, are unlikely to have had sufficient time to accumulate many substitutions.
An approach for investigating the counteracting effects of reduced Ne and increased homozygosity is to characterize the underlying distribution of fitness effects of mutations using polymorphism data. In particular, the method of Keightley and Eyre-Walker (2007), jointly estimates selec-tive and demographic parameters to infer the distribution of
fitness effects (hereafter DFE) of new nonsynonymous muta-tions. This method allows a single population size change making it more robust to violations of assumptions due to demographic history and summarizes the effective strength of selection (Nes) acting on new nonsynonymous mutations. In selfing populations with reducedNe, we expect a shift in the DFE such that there are a higher proportion of effectively neu-tral mutations (Nes ,1). More efficient purging of recessive deleterious mutations may shift the DFE in the opposite direc-tion, resulting in a higher fraction of strongly deleterious muta-tions. However, the DFE approach assumes all mutations are codominant (h= 0.5). It is therefore unclear if this approach is capable of uncovering the joint effects of the dominance of mutations and genetic drift on patterns of selection.
We had two main objectives in this study. Thefirst was to determine the extent to which the DFE inference approach may be useful for characterizing changes in selection efficacy following the transition from outcrossing to selfing, under a range of dominance parameters. To do this, we used forward population genetic simulations exploring how the estimated DFE shifts when the rate of selfing in a population increases. Our second objective was to investigate empirical support for theoretical predictions on the genomic conse-quences of the transition to selfing in the diploid aquatic
flowering plantEichhornia paniculata(Pontederiaceae) using the DFE inference approach.
Eichhornia paniculata populations possess a wide range
of mating systems ranging from outcrossing to predominant selfing (Barrett and Husband 1990). This variation is associated with the evolutionary breakdown of tristyly, a floral polymor-phism in which outbreeding populations are composed of three
floral morphs maintained by negative frequency-dependent mating. All tristylous populations occur in the arid caatinga region of Northeast Brazil, where the species occurs in ephem-eral ponds and ditches. Stochastic forces associated with small population size have destabilized tristyly on multiple occasions resulting in the spread andfixation of selfing variants (Barrett
et al.1989; Husband and Barrett 1992, 1993). Thisfixation of these variants has accompanied transitions in morph structure from stylar trimorphism through dimorphism to monomor-phism. Independent transitions to selfing associated with long-distance dispersal have given rise to selfing populations in the Caribbean and Central America (Barrett et al. 2009). Mid-styled selfing variants occur commonly on Jamaica and
Cuba, whereas long-styled selfing variants are restricted to a few small isolated populations in Nicaragua and Mexico. Roughly 60% of the variation in outcrossing rates inE. paniculata
can be explained by the morph structure of populations and the frequency of selfing variants (Barrett and Husband 1990). Because trimorphic populations are predominantly out-crossing and monomorphic populations exhibit high rates of selfing, we use morph structure as a proxy for outcross-ing rate in our study. Studies of allozyme variation and nucleotide diversity indicate that monomorphic popula-tions of E. paniculata have low levels of heterozygosity (Glover and Barrett 1987; Barrett and Husband 1990; Husband and Barrett 1993; Ness et al.2010), consistent with high selfing and/or colonization bottlenecks associ-ated with long-distance dispersal. Purging of genetic load has been documented in E. paniculata based on a study on fitness traits (Barrett and Charlesworth 1991), but as yet there is no molecular genetic evidence for this phenomenon.
Our investigations address the following questions: (1) Is the DFE inference approach of Keightley and Eyre-Walker (2007) able to separate the contrasting genomic signals of reduced selection efficacy and stronger purifying selection against recessive mutations accompanying the transition to selfing? (2) Is there empirical support for these con-trasting genomic signals based on the transition to selfing
in E. paniculata? Ourfindings demonstrate that the DFE
approach provides a valuable tool for investigating the genomic consequences of selfing, and that inE. paniculata
transitions to selfing are accompanied by genome-wide influences of reducedNeand the purging of recessive del-eterious mutations.
Materials and Methods
Genome structure and content of simulated datasets
Using forward simulations, we investigated how patterns of selection change following the shift to selfing. We conducted forward simulations using the software SLiM (Messer 2013), which implements a Wright–Fisher model with selection and nonoverlapping generations. We started with a completely outcrossing population (t= 1) composed of 1000 individuals (census size, N) with 100-Mbp genomes and constant genome-wide mutation (m= 731029per site per generation)
and recombination (r= 531028per site per generation)
rates. Genomes were composed of alternating 800 bp of non-coding (NC) and 200 bp of non-coding (C) DNA. All NC sites and 25% of C sites were neutral. The remaining 75% of sites in coding regions had selection coefficients drawn from a gamma distribution with shape parameter (b) of 0.3 andNsof 0.5, 5, 15, 25, 35, 45, 55, 65, 75, 85, or 95. The proportion of sites with a givenNsis shown inSupporting Information,Figure S1. We assumed there were no beneficial mutations. To iso-late the effect of the dominance of mutations, we usedfixed
hof 0.2, 0.5, or 0.8 across the entire genome.
Varying outcrossing rate, N, or r
We conducted three sets of simulations varying the outcrossing rate (t),N, orrparameters one at a time. In thefirst, we ran simulations for 10Ngenerations and then introduced a split leading to a second population. The population resulting from the split had the same Nas the ancestral outcrossing popula-tion (t= 1) but we decreasedtto 0.02, effectively simulating a shift to selfing. From this set of simulations we estimated the realizedNefor selfing population by calculating the reduction in synonymous diversity. We ran a second set of simulations in which the population resulting from the split had the sameN
as the realizedNeof selfers from thefirst set of simulations, but with the outcrossing rate unchanged (t= 1). From thefirst set of simulations, we also calculated the effective recombination rate (re) of the selfing population using the equation re =
routcrosser3(12Fis), whereFisis the coefficient of inbreeding (Nordborg 2000). As we were unable to change r midway during the simulations, we ran a third set of simulations where the ancestral outcrossing population had the sameras thereof selfers from thefirst set of simulations. For this set of tions, we did not create a population split. We ran all simula-tions for another 6Ngenerations to allow populations to reach equilibrium, as expected under coalescent predictions. During this period, we randomly sampled eight individuals from each population at each 1Ninterval, and calculated the number of nonsynonymous and synonymous mutations that had accumu-lated independently. We use these values to generate folded allele frequency spectra (hereafter AFS). We estimated the DFEs for all simulated datasets using the approach of Keightley and Eyre-Walker (2007), as described in the section below. For eachNescategory in the DFE, we generated confidence inter-vals (C.I.s) based on 120 independent runs. We performed two-sample t-tests to compare the DFEs of simulated outcrossing and selfing populations using R (R Development Core Team 2011). We also reported the expected DFE for the outcrossing population represented as a gamma distribution using the b andNsparameters. As a distribution ofNswas used, we calcu-lated the DFE for eachNsvalue and scaled the individual DFEs by their proportional contribution to the genome (Figure S1). To generate the expected DFE for the selfing population under an additive model, we first scaled the Ns parameter by the observed reduction in synonymous diversity accompanying the shift to selfing but leavingbunchanged. Further, we mul-tiplied Nsby 1.96 to account for the homozygosity of selfing genomes (1 +Fis, see Caballero and Hill 1992).
Jointly varying h and Ns
We ran separate simulations to assess the joint impact of the dominance level of mutations and strength of purifying selection acting on them. In these additional simulations, we assumedh= 0.2 andNs= 95 for 31.5% of the sites in the C region to simulate strongly recessive deleterious sites. The remaining 43.5% of the sites in the C region had h = 0.5 andNsranging from 0.5 to 85 to simulate partially codominant weakly and strongly deleterious sites. After simulating a split
to a predominant selfing population (t= 0.02), we calculated the average fitness and number of neutral and deleterious mutations that accumulated in eight randomly sampled indi-viduals. As SLiM outputs haploid chromosomes, we randomly paired two genomes to construct a diploid individual. For a given site in each of these individuals, the fitness effect of nonsynonymous mutations that were present once was 1 2hs. If the same mutation occurred in both chromosome copies, itsfitness effect was 12sas they would be homozy-gous. Thefitness of an individual was the multiplicative prod-uct of thefitness effect of all mutations in their genome. Note, because highly selfing populations are mostly homozygous, this procedure does not simulate the true genotypic compo-sition of the population, but allows for a more direct compar-ison with outcrossers of fitness and deleterious mutation accumulation. We estimated the DFEs for the simulated data-sets using the approach of Keightley and Eyre-Walker (2007), as described in the section below. We generated C.I.s based on 120 independent runs of simulations and performed a two-way analysis of variance with mating system and time as factors using R (R Development Core Team 2011).
Estimating selective and demographic parameters
We inferred the DFE for each dataset using the source code version of the DFE-asoftware available from Peter Keightley’s website (http://lanner.cap.ed.ac.uk/~eang33/est-dfe-files.tar. gz). To ensure our parameter estimates from this maximum likelihood method reached global optima, we randomized the starting values for mean selection against deleterious mutations (NeE(s)),b, andt2parameters and ran the program 10 times. From the output estimates across the runs, we chose the param-eters that resulted in the highest maximum likelihood. We re-port the prore-portion of mutations falling into a givenNesrange of the DFE (,1, 1–10, 10–100, and.100).
Sampling of Eichhornia paniculata populations
We sampled open-pollinated seeds from 20 populations of
E. paniculataacross the species range, including 10 outcrossing (tristylous) and 10 selfing populations (Table S1). All out-crossing populations were from Northeast Brazil. Nesset al.
(2010) found that the outcrossing populations from this region clustered in the same genetic structure group. We studied a subsample of the genotypes used by Ness et al. (2010). The selfing populations originated from Cuba (n= 3), Jamaica (n= 5), Mexico (n= 1), and Nicaragua (n= 1). We grew plants under uniform glasshouse conditions at the University of Toronto. To maximize our sampling effort, we selected one individual per population following the scattered sampling ap-proach (Wakeley and Lessard 2003; Städleret al.2009), which assumes that alleles coalesce faster within compared to be-tween demes, thus maximizing the number of unique alleles represented.
Nucleic acid extraction and sequencing
We extracted both RNA and DNA from floral buds of
E. paniculata. We chosefloral buds as they contain both
game-tophytic and sporophytic genes increasing our sampling breadth. We extracted RNA using the Spectrum Plant Total RNA kit (Sigma-Aldrich). The extracted RNA samples were used to make Illumina TruSeq RNA libraries that were se-quenced using the 100-bp paired end protocol on Illumina HiSequation 2000 at the McGill University and Génome Québec Innovation Centre. The samples were sequenced across two lanes with 10 samples multiplexed in each lane, with out-crossing and selfing samples evenly distributed across the lanes. We further extracted genomic DNA from thefloral buds of the Mexican sample using a modified variant of the CTAB extraction protocol (Doyle and Doyle 1987, 1990; Edwards
et al. 1991) treating the lysed cells with ribonuclease A to
remove contaminant RNA. An Illumina TruSeq DNA library was prepared from this sample and sequenced on a separate lane on the Illumina HiSequation 2000. After sequencing, we removed reads of,50 bp and reads with.10% of“N”bases using a custom Perl script, retaining92% of the original data. The raw sequence data are available under accession no. SRP049636 at the Sequence Read Archive (http://www.ncbi. nlm.nih.gov/sra), and the associated BioProject accession no. is PRJNA266681 (http://www.ncbi.nlm.nih.gov/bioproject/).
Assembly and identification of coding regions
Although Nesset al.(2011) generated a transcriptome ref-erence forE. paniculata, we conducted an independent as-sembly as the greater number of genotypes, longer reads, and new assembly software facilitated more accurate con-struction of contigs. Nevertheless, we followed a similar ap-proach as in Nesset al.(2011). We chose selfing genotypes to generate the consensus assembly under the expectation that their more homozygous genomes would limit the problem caused by alleles that appear heterozygous but actually belong to paralogous loci. We generated ade novoassembly from the Jamaican transcriptome samples using the programs Velvet 1.2.08 (Zerbino and Birney 2008) and Oases 0.2.08 (Schulz
et al.2012). We found the best parameters for the assembly
using VelvetOptimser 2.2.4 (Zerbino 2010) that indicated that k-mers with a length of 75–85 were optimal. The assembled reference transcriptome had a total size of 65.53 Mbp with an
N50 of 2.2 kb (Figure S2). For the contigs in the assembled reference, we predicted the location of coding regions through BLAST searches to known proteins in plant databases and re-moved contigs without any matches. We did this using a com-bination of tBLASTx (Altschul et al. 1990) to Viridiplantae database and GeneWise 2.4.1 (Birneyet al.2004). After iden-tifying coding regions in assembled contigs, we trimmed bases before start and after stop codons using custom Perl scripts retaining 29,336 loci at the end of this step.
Read mapping
After generating the reference assembly, we mapped all reads
from E. paniculata transcriptome samples and the genomic
DNA sample to the assembly. First, we mapped short reads with Burrows-Wheeler Aligner (BWA, v0.6.2-r126) using de-fault parameters (Li and Durbin 2009). Further, we used the
BWA “sampe”command to combine the paired end read mapping results together and Samtools“view”command (Samtools v0.1.18 r982:295; Li et al.2009) to convert the mapping results into a binary alignment format (BAM format). After thefirst round of read mapping, we used Stampy 1.0.20 software with default parameters (Lunter and Goodson 2011) to map more divergent reads, as well as to identify insertions and deletions (indels). Approximately 92% offiltered reads for each sample mapped successfully. Next, we processed the read mapping output into a format required for variant calling soft-ware using four programs (SamFormatConverter, ReorderSam, AddOrReplaceReadGroups, and BuildBamIndex) that were part of the Picard tools package 1.100 using default settings (http:// picard.sourceforge.net). The processed BAMfiles are available under accession no. SRP049636 at the Sequence Read Archive (http://www.ncbi.nlm.nih.gov/sra).
Variant calling andfiltering
After read mapping, we identified single nucleotide poly-morphisms (SNPs) segregating amongE. paniculata tran-scriptome samples using a set of programs from the Genome Analysis Toolkit (GATK) v2.7-4-g6f46d11 (Depristo
et al. 2011). We first used RealignerTargetCreator and
IndelRealigner with default parameters and identified and realigned sequences within3 kb of an indel where errone-ous mismatches were more likely to have occurred. Further, we ran UnifiedGenotyper with the BadCigar read filter to call invariants sites, SNPs, and indels from all samples. For a given variant, we allowed for a maximum of six alternate alleles to be genotyped. We performed a number offiltering steps to minimize spurious SNP calls. From the Unifi edGeno-typer output, we only retained sites for which Phred scaled quality score (QUAL) was.60 and depth in each individual sequenced was .20. We only retained a SNP if the Phred scaled genotype quality (GQ) for all samples was .60. We also excluded 5 bp on either side of an indel where spurious SNP calls are likely to be made. For the SNPs identified in the outcrossing genotypes, we performed a test for Hardy–Weinberg equilibrium (Wigginton et al.2005) as implemented in VCFtools (v0.1.11) (Daneceket al.2011). We validated SNP calls by comparisons to a range-wide polymorphism dataset forE. paniculatagenerated by Barrettet al.(2009) and Ness
et al.(2010). These studies extensively sampled 225E.
pan-iculataindividuals from 25 populations across Brazil, the Ca-ribbean, and Central America. We performed a custom BLAST search comparing the 10 EST-derived nuclear loci investi-gated by these authors to our reference using the make-blastdb and blastn programs, part of the NCBI BLAST+ toolkit, version 2.2.26 (Camachoet al.2009). Seven nuclear loci matched contigs in our dataset that we had removed during the filtering stages. We aligned the remaining three nuclear loci and sequences for the best matching contig in our study using MUSCLE (Edgar 2004) as implemented in MEGA6 (Tamuraet al.2013) excluding sites with gaps. Only the alignment between EP0314 and the best matching locus from our study (Locus_13533) identified polymorphic sites
segregating in both sets of sequences and the region-specific polymorphisms segregating in our samples matched those identified in the previous studies (Table S2).
Filtering paralogous sequences
If duplicated regions were assembled into a single contig, differences between paralogs might erroneously be called as a polymorphic difference at a single site. To address this we
first removed loci containing sites heterozygous in all 10 selfing genotypes identified with the aid of VCFtools (v0.1.11) (Daneceket al.2011). Such variants are unlikely to be real, given the largely homozygous backgrounds of selfing populations and the occurrence of at least two in-dependent transitions to selfing (Barrett et al. 2009). Sec-ond, we mapped genomic reads from a selfing genotype from Mexico to the transcriptome reference. We used the Samtools“depth command”(Samtools v0.1.18 r982:295; Li
et al. 2009) tofind depth per site and used a custom Perl
script to calculate the mean across a given contig. We re-moved loci with,153or.603genomic coverage (Figure S3) based on the assumption that coverage should be even across the entire genome.
Removing shared variant sites
To focus on contemporary selection pressures, we used only sites that were unique to each lineage in comparisons of selection efficacy between outcrossing and selfing popula-tions. We used a custom Perl script to convert the
Uni-fiedGenotyper VCF output into a FASTA format. Next, we identified polymorphic sites that were shared between outcrossing and selfing populations using a custom Perl script. We substituted bases at those sites in our FASTA
files to“N”using a script fromhttp://raven.iab.alaska.edu/ ~ntakebay/teaching/programming/perl-scripts/perl-scripts. html(selectSites.pl). We retained a total of 16,416 transcripts at the end of the filtering stages. Note that our simulations used a similar approach, as only lineage-specific mutations were analyzed while inferring the DFE.
Comparing outcrossing and selfing populations of Eichhornia paniculata
We first processed the output from the SNP filtering steps and generated the necessary variables so we could compare the efficacy of selection in outcrossing and selfing popula-tions. Because selfers are more highly homozygous than outcrossers, they have effectively half the number of chromosomes. Therefore, we generated a haploid copy of the diploid chromosome for each individual and randomly chose one of the bases at a given heterozygous site using a custom Perl script. As we only had two samples from Central America, we were unable to characterize the AFS and therefore we did not include the Central American populations in most comparisons. To keep the number of chromosomes analyzed the same while performing compar-isons, 8 of the 10 outcrossing genotypes from Brazil were randomly selected.
Estimating the strength of selection acting on mutations in Eichhornia paniculata populations
We used the Polymorphorama script (Andolfatto 2007; Haddrillet al.2008) to generate locus-specific nonsynony-mous and synonynonsynony-mous folded AFS and number of invariant sites for the outcrossing and selfing populations. This pro-gram includes twofold degenerate sites while calculating the AFS. Twofold degenerate sites might inflate the number of nonsynonymous compared to synonymous polymorphisms resulting in biased conclusions on estimates of selection. How-ever, Williamson et al. (2014) reported that DFE inferences were unaffected by the use of such twofold sites. We generated 200 bootstrap replicateE. paniculatadatasets, after resampling randomly across the loci using R (R Development Core Team 2011), and generated the sums and means for each dataset. We inferred the DFE for each replicate dataset as described earlier in this section. For the resulting Nescategories in the DFE, we generated mean values and 95% C.I.s across the 200 bootstrap replicates. To generate the C.I.s, we excluded the top and bottom 2.5% of bootstrap replicates and used the smallest and largest values from the remainder to represent the lower and upper limits of the C.I., respectively. We deter-mined whether the Nes categories from the DFE differed between outcrossing and selfing populations using the random-ization test following Keightley and Eyre-Walker (2007). A dif-ference in oneNescategory of the DFE will not be independent of differences in the others. Finally, we used the bandNeE(s) parameters estimated by the DFE-asoftware to plot the cumu-lative proportion of nonsynonymous mutations. This allowed us to have more confidence in our inferences from the DFE, even if mutations of extremely large deleterious effect (Nes ..100) were absent in the samples analyzed.
Results
Inferring the DFE of simulated outcrossing and selfing populations
Fixed dominance coefficients across the genome: Using
forward simulations, we investigated changes in selection efficacy in outcrossing and selfing populations after a split from a common outcrossing ancestor. After 6Ngenerations, there was75% reduction in synonymous diversity following the shift to selfing. As the level of dominance across the entire genome was increased from 0.2 to 0.8, the DFE of outcrossing populations shifted such that a larger fraction of sites was inferred to be under stronger levels of selection (Figure 1). The DFE of outcrossers under h= 0.5 matched the expect-ations based on the given Nsand bparameters. Consistent with expectations, there was a deficit of sites in theNes.100 category of the DFE of the outcrossing population underh= 0.2, when compared to the level expected under an additive model. In contrast, the DFE for selfing populations remained largely the same as the level of dominance increased. Under all three dominance levels, there was an excess of sites under stronger levels of selection than expected due to the Ne
re-duction and increased homozygosity accompanying the shift to selfing. Underh= 0.2,pn/pswas smaller in selfers
com-pared to outcrossers (Table S3), a significantly larger fraction of sites was in the Nes .100 category, and a significantly smaller fraction of sites was in theNes10–100 categories of the estimated DFE of selfers (Figure 1,Table S4), consistent with the effects of purging. In contrast, underh= 0.8, selfers had a larger pn/ps(Table S3) and a significantly larger and
smaller fraction of sites in theNes,1 andNes10–100 cate-gories, respectively (Figure 1,Table S4). These results indicate that with increasingly recessive mutations there is power to detect a purging effect in selfing populations, whereas with increasing dominance there is evidence for a greater proportion of effectively neutral mutations compared with outcrossing populations.
Nonequilibrium demographic factors: The difference
be-tween the expected and estimated proportion of strongly selected sites in selfing populations may reflect a failure to fully control for nonequilibrium demographic factors caused by the transition to selfing and the effects of Hill–Robertson interference. Under all dominance levels, the synonymous AFS for outcrossing and selfing populations were skewed to-ward rare variants, compared to expectations under neutral equilibrium (Figure S4, A and B). However, such a skew was not observed in the outcrossing population when we included mutations that were shared between both populations (Figure S4C). The skew was likely due to the use of unique mutations to estimate selection pressures, which will be rare, given their recent origin. In contrast, selfers still showed a skewed AFS even when all mutations were included (Figure S4D). The inclusion of shared mutations did not affect infer-ences about the effect of the dominance of mutations on selection efficacy (Figure S5). However, there was a larger difference between the observed and expected number of mutations in the Nes . 100 category under h = 0.5 and h = 0.8. Additionally, as the simulated genomes had a much larger fraction of noncoding compared to coding regions (Figure S1), our analysis may be biased by the fact that a large proportion of neutral sites would have been far from selected sites. Using synonymous mutations occurring only within coding regions did not affect the observed differ-ences between the DFEs of outcrossing and selfing popula-tions (Figure S6), although the estimated C.I.s were larger.
Reduced Neand stronger background selection:To
disen-tangle how reducedNeandreinteract with the dominance of mutations, we varied these parameters one at a time, simu-lating outcrossing populations with equivalent reductions in effective size and recombination to our simulated selfing pop-ulation. There was an increase in the fraction of sites in the lower Nes categories of the observed DFE under N = 250, equivalent to the realized neutralNeof the previously simu-lated selfing population, when compared toN= 1000 (Figure 2). The observed DFEs for N = 250 under all dominance levels harbored a greater fraction of sites in the larger Nes
categories when compared to the expected levels. However, simulating this reduction in Ne did not show the purging signal we observed in selfing populations; there was no evi-dence for a significant increase in the proportion of strongly selected mutations in simulations with recessive mutations (compare Figure 2C with Figure 1). The DFE of the outcross-ing population withr= 1.9631029per site per generation,
equivalent to the realized re of previously simulated selfing populations, had a larger fraction of mutations in smallerNes
categories when compared to the DFE of the outcrossing pop-ulation withr= 531028per site per generation underh=
0.5 and under h= 0.8 (Figure 1 andFigure S7). However, this change was not as large as the level expected due to the
Nereduction accompanying the shift to selfing. As with the simulations of outcrossing populations subjected to reduced
Ne, we found no evidence of the purging signal of a larger fraction of strongly deleterious mutations compared with the ancestral outcrosser, again showing that this signal is specific to the transition to selfing. Thus, these simulations indicate that the signal of increased proportions of strongly selected sites is a unique effect of the transition to selfing and driven by the purging effect of increased homozygosity.
Mixed dominance coefficients across genome:When both
dominance and selection coefficients were jointly varied, selfers accumulated more nonsynonymous mutations com-pared to outcrossers, even though both accumulated the same number of synonymous mutations (Figure 3A). There was a greater decline in the fitness of selfers compared to outcrossers over 6Ngenerations (Figure 3B). We further in-vestigated how such mutation accumulation influenced the selection efficacy for outcrossing and selfing populations. Mean pn for simulated outcrossers and selfers was 1.983
1025and 3.6431026, respectively; meanp
sfor simulated
outcrossers and selfers was 4.94 31025and 8.5331026,
respectively. After the split from the common outcrossing an-cestor, the estimated DFE of the selfing population shifted such that a significantly larger fraction of sites were in the
Nes,1 category at 1Nand 3Ngenerations (Figure 4,Table S5). Also, there was a significantly larger fraction of sites in the Nes.100 category of the selfing population during the
first 4Ngenerations. The interaction between mating system and time was a significant factor influencing the proportion of mutations in theNes,1 andNes.100 categories. Moreover, the number of sites in eachNescategory of the DFEfluctuated over generations. When there were both weakly selected ad-ditive sites and strongly selected recessive sites in the simu-lated genome, the DFE approach inferred the occurrence of more very weak and very strong deleterious mutations in
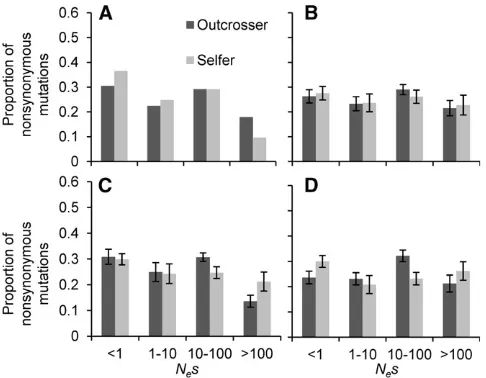
Figure 2 Distribution of fitness effects (DFE) of new nonsynonymous mutations for simulated outcrossing populations of two census sizes (N) under variousfixed dominance coefficients (h= 0.2, 0.5, or 0.8). Shown are (A) the expected DFEs, (B)h= 0.5, (C) h= 0.2, and (D)h= 0.8. Simulations illustrate the change in DFE for both populations after 6N
generations after the split of a population ofN= 250 from the common ancestral population ofN= 1000. The coding regions were under various selection coefficients (Ns= 0.5–95) all sampled from a gamma distribu-tion with shape parameter (b) of 0.3. We generated the expected DFEs for the populations represented as a gamma distribution using theband
Nsparameters. We generated the observed DFEs by randomly sampling and generating allele frequency spectra using eight genomes from pop-ulations of 1000 in size. Shown are the mean proportions of sites for each
Nescategory and their respective confidence intervals based on 120 sim-ulations.
Figure 1 Distribution of fitness effects (DFE) of new nonsynonymous mutations for simulated outcrossing (t= 1.00) and selfing (t = 0.02) populations under various fixed dominance coefficients (h= 0.2, 0.5 or 0.8).Nesis the product ofNeand the selection coefficient (s). Shown are (A) the expected DFEs, (B)h= 0.5, (C)h= 0.2, and (D)h= 0.8. Simulations illustrate the change in DFE for both populations after 6Ngenerations after a split from the common outcrossing ancestor. The coding regions were under various selection coefficients (Ns= 0.5–95) all sampled from a gamma distribution with shape parameter (b) of 0.3. We generated the expected DFE for the outcrossing population represented as a gamma distribution using thebandNsparameters. We generated the expected DFE for the selfing population by scaling theNsparameter by the observed 75% re-duction in synonymous diversity in selfers and multiplying it by 1.96 to account for effective dominance levels of mutations in selfing genomes while leavingbunchanged. We generated the observed DFEs by randomly sampling and generating allele frequency spectra using eight genomes from populations of 1000 in size. Shown are the mean proportions of sites for eachNescategory and their respective confidence intervals based on 120 simulations.
selfers, although such effects varied with the time since the transition to selfing. Thus, with a model with varying domi-nance coefficients, it is possible to detect signals of both re-laxed purifying selection and purging, although the rere-laxed selection signal is less prevalent, despite an observed decline infitness in selfing populations.
Inferring the DFE of outcrossing and selfing populations of Eichhornia paniculata
Selection and demographic parameters: Of the 16,416
loci, 4485 were polymorphic in outcrossers and 1586 were polymorphic in selfers, after excluding variants shared between outcrossing and selfing populations. Polymorphic loci in outcrossers and selfers had between 1–40 and 1–20 segregating sites, respectively, with the distribution of poly-morphisms per locus right skewed (Figure S8). Meanpnfor
outcrossers and selfers was 4.93 31024and 8.9931025,
respectively; meanpsfor outcrossers and selfers was 3.093
1023 and 5.62 3 1024, respectively. We identified 20,388
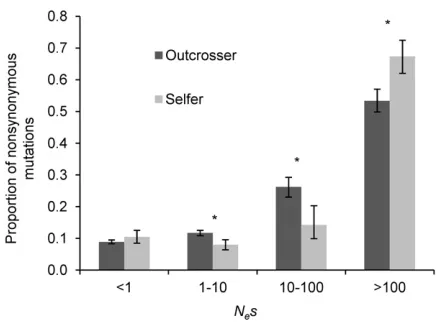
nonsynonymous and 32,384 synonymous polymorphisms in outcrossers and 3613 nonsynonymous and 5730 synonymous polymorphisms in selfers (Table S6). There was an excess of rare nonsynonymous compared to synonymous polymor-phisms in both outcrossing and selfing populations (Figure 5). Selfers had a slight deficit of rare synonymous polymor-phisms compared to outcrossers. Randomization tests, as implemented in Keightley and Eyre-Walker (2007), indicated there were significantly fewer sites in theNes: 1–10 and 10– 100 categories and a significantly greater proportion of sites in theNes.100 in selfers compared to outcrossers (Figure 6). Although we did not detect a significant difference for the
Nes,1 category at the 5% level, there was a general trend for a larger number of mutations in this category for selfing populations. Our plots of the cumulative proportion of non-synonymous mutations indicate that selfers had a marginally larger fraction of mutations withNes,3 (Figure S9).
Datafiltering:As inferring the DFE is dependent on the AFS
being compared, we investigated how different quality cut-offs andfiltering affected the patterns observed. A single site quality cut-off for both invariant and variant sites could disproportionally exclude invariant sites. However, in our case, reducing the quality cut-off for both sites did not affect the DFE inference for outcrossing and selfing populations (Figure S10). We also excluded an additional 245 loci that contained at least one site heterozygous in two or more self-ers, a more stringentfilter for potential paralogs (Table S7). Removing such loci from the comparisons did not alter our inferences (Figure S11). Less than 3% of polymorphic sites across outcrossing genotypes departed from Hardy–Weinberg equilibrium at the 5% level and these sites were localized to 73 loci. Again, removal of these loci did not affect our infer-ences on differinfer-ences between outcrossing and selfing geno-types (Figure S12). Finally, we investigated how the relative proportions of nonsynonymous and synonymous polymor-phisms per loci influenced our results. As the distribution of
pn/pswas right skewed (Figure S13), we excluded 135 loci
that hadpn/ps.1 in either outcrossers or selfers and repeated
the DFE analyses. Although we still observed an excess of sites in the Nes . 100 category in selfers, there was substantial overlap in the proportion of sites in theNes,1 category be-tween outcrossers and selfers (Figure S14andTable S8).
Pooling independent shifts to selfing: We investigated
whether pooling additional samples from an independent transition to selfing influenced the AFS and the inferred DFE. As the inclusion of the two additional samples from Central America resulted in a total of 10 selfing samples, we repeated the analyses using all 10 outcrossing genotypes to keep the number of chromosomes compared the same. With the inclusion of the additional selfing genotypes, we still observed an excess of rare nonsynonymous compared to synonymous polymorphisms in both outcrossing and selfing populations (Figure S15). In the synonymous AFS, selfing populations had a deficit of singletons and an excess of doubletons compared to outcrossing populations. Moreover, we found that using the randomization tests, the underlying DFE and all discrete Nescategories (Figure S16) were sig-nificantly different between outcrossing and selfing popula-tions at the 0.5% level.
Figure 3 The type and effects of mutations accumulated by four simu-lated outcrossing (black) and four simusimu-lated selfing (gray) individuals over 6Ngenerations after a split from a common outcrossing ancestor when both dominance and selection coefficients were jointly varied. We randomly sampled eight haploid genomes from populations of 1000 in size. The genomes were randomly paired to create four diploid individuals. Shown are (A) the number of nonsynonymous and synonymous mutations that accumulated in the genomes and (B) mean and 95% confidence intervals for thefitness of individuals.
Discussion
Our forward population-genetic simulations demonstrate that reduced Ne and increased purging, accompanying the transition to selfing, can be detected by estimating the un-derlying distribution of deleterious mutational effects. Our simulations show that this is not expected under a single dominance coefficient for nonsynonymous mutations, but can be explained if there is a mixture of strongly selected recessive mutations that experience effective purging in selfing populations, and more weakly selected additive mutations subject to relaxed selection. Our empirical study
ofE. paniculatarevealed a small increase in the proportion
of effectively neutral nonsynonymous mutations and a sig-nificant increase in the proportion of strongly selected sites in selfing compared to outcrossing populations. The spread in the distribution of selective coefficients observed in both the simulated and empirical datasets is consistent with the effects of both purging and a reduced efficacy of selection in selfing populations.
Consequences of reduced Nein selfing populations
Our simulations revealed an increased number of sites that were under weaker purifying selection following the tran-sition to selfing as a result of reduced Ne and re. Further, relaxed selection was driven largely by partially dominant rather than recessive mutations. The observed pattern is con-sistent with theoretical predictions that selection should be less efficient in selfers (reviewed in Charlesworth and Wright 2001). In both the simulated and empirical results, the esti-mated magnitude of relaxed selection appears to be small (Figure 4 and Figure 6), and there may be several reasons for this. First, it is possible that even a large reduction inNe
does not substantially alter the DFE in selfing populations if a significant proportion of mutations are strongly selected (Nes..1). Second, the relatively recent evolutionary transi-tion to selfing inE. paniculata(see Nesset al.2010) may not have allowed for sufficient time for the effects of reducedNeto be detected at genome-wide scales. However, our simulations examining the shift to selfing over 6Ngenerations did notfind a very large reduction in theNes,1 category of the DFE and patterns of relaxed selection disappeared after 3Ngenerations. Although reduced Ne may only moderately reduce genome-wide selection efficacy, our simulation results imply that such subtle shifts may be associated with early and cumulative declines infitness in selfing populations (Figure 3).
The smaller than expected reduction in the efficacy of selection following the shift to selfing in the forward simulations might suggest that the DFE inference approach underestimates the effects of reduced Ne. If the method underestimated the magnitude of relaxed selection, it could explain why the ob-served shift in the empirical data toward effectively neutral sites in the DFE of selfers was relatively weak. An alternate possibility
Figure 4 Distribution offitness effects (DFE) of new nonsynonymous mutations for simulated outcrossing (t= 1.00) and selfing (t= 0.02) populations when both dominance and selection coefficients were jointly varied. Within the coding region of the genome in the simu-lations, 31.5% of sites hadh= 0.2 andNs= 95, 43.5% of the sites hadh= 0.5 andNsranging from 0.5 to 85, and the remaining had
h= 0.5 andNs= 0. Simulations illustrate the change in DFE for both populations over 6Ngenerations after a split from the common out-crossing ancestor. We generated DFEs by randomly sampling and generating allele frequency spectra using eight genomes from pop-ulation sizes of 1000. Nesis the product of Ne and the selection coefficient (s). Shown are the mean proportions of sites for each
Nes category and their respective confidence intervals based on 120 simulations.
Figure 5 Folded nonsynonymous and synonymous allele frequency spec-tra for outcrossing and selfing populations ofEichhornia paniculata. Hap-loid chromosomes from one individual from each of eight outcrossing populations from Northeast Brazil and eight selfing populations from the Caribbean were used to generate the frequency spectra. Eight out-crossing individuals from the 10 that were sequenced were randomly selected to keep the number of chromosomes sampled the same while performing the comparison.
is that even genome-wide polymorphism datasets have limited power to detect relaxed selection (and see Glémin 2007), par-ticularly when there are multiple and contrasting forces acting on the genome. Consistent with this suggestion, the difference betweenpn/psin simulated outcrossers and selfers under an
additive model incorporating mixed dominance and selection coefficients was small. Even so, the empirical pattern of re-laxed selection became less apparent when we excluded loci with pn/ps . 1, indicating they might be contributing to
genome-wide patterns.
Our empirical results demonstrate demographic effects associated with the colonization history of selfing populations ofE. paniculata. Pooling genotypes from independent shifts to selfing had a significant influence on the AFS, as indicated by the excess of doubletons in selfers. The Central American genotypes werefixed for alternate alleles compared to sam-ples from the Caribbean, probably explaining this result.
Eich-hornia paniculata occurs in ephemeral aquatic habitats and
populations experience striking annual variation in size, in-cluding frequent local extinctions (Barrett and Husband 1997; Husband and Barrett 1998). Recent studies suggest that nonsynonymous mutations reach equilibrium faster than synonymous mutations after bottlenecks; therefore compari-sons of the two could generate spurious signals of relaxed selection (Penningset al.2014; Simonset al.2014). Because
E. paniculataonly colonized the Caribbean 125,000 years
ago (Ness et al.2010), populations from that region might not have had sufficient time to recover from founding events. If thefit of demographic models for selfing populations was less accurate compared to outcrossing populations, our signal of relaxed selection could, in part, reflect this effect. However,
we found that even when the synonymous spectra did not meet neutral expectations, the inference of the DFE was sim-ilar to the case when the spectra did match such expectations. Although the demographic correction implemented in the DFE inference approach should account for distortions of the AFS away from equilibrium, it is unclear if the marginal trend of relaxed selection in the empirical data, which was significant when samples from separate origins were pooled, was influenced by violations of neutral expectations. Our sim-ulations gave us qualitatively similar differences in the DFE to the empirical data and provided evidence for afitness decline and the accumulation of deleterious mutations in selfing pop-ulations (Figure 3). These results suggest that the weak trend observed in our empirical results reflects a true signal of the reduced efficacy of selection in selfing populations.
Exposure of recessive deleterious mutations
We observed a large proportion of strongly deleterious sites in the DFEs obtained from both simulated and empirical data. By using forward simulations, we found the DFE approach was able to infer the effect of varying dominance levels of muta-tions on patterns of selection. As deleterious mutamuta-tions became more dominant, the effective strength of selection acting against them in outcrossing populations increased. In contrast, the dominance level of mutations had little effect in selfing populations, where the largely homozygous background of genotypes exposes the deleterious effects of recessive and dominant mutations. Further, our simulations indicated the DFE approach was able to identify how both partially dominant and strongly recessive deleterious mutations shape selection efficacy experienced by selfers and outcrossers. Linkage between neutral, weakly, and strongly deleterious mutations, under variable dominance coefficients, may have complicated attempts to disentangle their individual effects on the DFE but did not lead to any directional biases. Overall, our simulation results indicated the empirical patterns of increased accumulation of effectively neutral and strongly deleterious mutations occur across a wide range of selection and domi-nance coefficients, after transitions to selfing. Previous experi-mental studies in E. paniculata, involving multigenerational
fitness comparisons of phenotypic traits following selfing and outcrossing, were unable to detect significant inbreeding de-pression in selfing populations from the Caribbean and the authors proposed that this was largely a result of purging of genetic load (Barrett and Charlesworth 1991). Our findings are consistent with this earlier study in providing molecular evidence to support the purging hypothesis.
A key question is whether the observed excess of strongly deleterious mutations in selfing populations was, in part, due to the methods used to infer selection efficacy. The approach of Keightley and Eyre-Walker (2007) is known to imprecisely infer the DFE when the distribution is multimodal (Kousathanas and Keightley 2013) and overestimates the strength of pu-rifying selection in the face of linked selection (Messer and Petrov 2013). Also, the DFE estimation approach infers the proportion of mutations that are strongly deleterious
Figure 6 Distribution of fitness effects (DFE) of new nonsynonymous mutations for outcrossing and selfingEichhornia paniculata.Nesis the product ofNeand the selection coefficient (s). Eight Caribbean selfing and eight outcrossing individuals were used to generate the DFEs. Eight outcrossing samples from the 10 that were sequenced were randomly selected to keep the number of chromosomes sampled the same while performing the comparisons. Error bars on top of eachNescategory are 95% confidence intervals from 200 bootstrap replicates generated by resampling over loci. We used a randomization test (see Keightley and Eyre-Walker 2007) to compare outcrossing and selfing populations and to assess significance at 0.5% level (indicated by*).
(Nes .100) from the bparameter, even if no such muta-tions segregate in samples. However, plotting the DFE as a continuous distribution indicated there was a greater spread of selection coefficients in selfers. Furthermore, the magnitude of the shift toward effectively neutral sites in simulated selfing populations was lower than expected due to reduced Ne, or the level experienced by simulated outcrossing population with a census size equivalent to the realizedNeof the selfers. Both of these results suggest that countervailing homozygosity effects stifle a unidirectional change in the DFE. Therefore, the observed patterns are consistent with an effect of both purging and reduced effi -cacy of selection in selfing populations, even if estimates of the magnitude of the effect may be imprecise.
At this stage we are unable to assess if an assumption of the DFE inference approach, namely that all sites experi-enced independent selection pressures, was violated in our study. It seems probable that this assumption would be violated in selfing populations, with many neutral sites linked to deleterious ones. In this case, the DFE approach might over-estimate the proportion of deleterious sites. However, over short distances in the genome our bootstrapping by locus approach addresses some of the uncertainty due to linkage blocks, as some bootstrap replicates may not contain all of the genes within a given block. Furthermore, our simulations suggest the patterns we observed are expected under a model that incorporates both strongly recessive deleterious mutations and slightly deleterious, more additive mutations, consistent with a role for purging of harmful recessive alleles and an accumulation of weakly deleterious mutations.
Finally, we have not considered the effects of beneficial mutations in interpreting the results of our study. Recessive beneficial mutations may also be exposed in selfing populations leading to selective sweeps. As beneficial mutations are ex-pected to befixed rapidly after they appear in selfing popula-tions, they are unlikely to have been segregating in the small number of E. paniculata samples used in our study. Linkage between recessive beneficial and deleterious mutations should increase the time taken for sweeps to occur (Hartfield and Glémin 2014). Hence, future studies estimating the rate of adaptation in selfing populations should consider the influence of strongly deleterious mutations, as our results indicate that they can influence genome-wide patterns of selection.
Acknowledgments
We thank Wei Wang for providing many of the Perl scripts used in this study and Khaled M. Hazzouri, Young Wha Lee, and Epitawalage Niroshini for providing their modified DNA extraction protocol, and Aneil F. Agrawal for helpful discussion. This research was funded by Discovery grants from the Natural Sciences and Engineering Research Council of Canada (NSERC) to S.C.H.B. and S.I.W. R.A. was supported by student fellowships from a Ministry of Training, Colleges and Universities Ontario graduate scholarship (OGS), Univer-sity of Toronto, and NSERC.
Literature Cited
Agrawal, A. F., and M. C. Whitlock, 2011 Inferences about the distribution of dominance drawn from yeast gene knockout data. Genetics 187: 553–566.
Altschul, S. F., W. Gish, M. Miller, E. W. Myers, and D. J. Lipman, 1990 Basic local alignment search tool. J. Mol. Biol. 215: 403– 410.
Andolfatto, P., 2007 Hitchhiking effects of recurrent beneficial amino acid substitutions in the Drosophila melanogaster ge-nome. Genome Res. 17: 1755–1762.
Baker, H. G., 1955 Self-compatibility and establishment after
‘long-distance’dispersal. Evolution 9: 347–349.
Barrett, S. C. H., and B. C. Husband, 1990 Variation in outcross-ing rate inEichhornia paniculata: the role of demographic and reproductive factors. Plant Species Biol. 5: 41–56.
Barrett, S. C. H., and D. Charlesworth, 1991 Effect of a change in the level of inbreeding on the genetic load. Nature 352: 522– 524.
Barrett, S. C. H., and B. C. Husband, 1997 Ecology and genetics of ephemeral plant populations:Eichhornia paniculata (Ponteder-iaceae) in N.E. Brazil. J. Hered. 88: 277–284.
Barrett, S. C. H., M. T. Morgan, and B. C. Husband, 1989 The dissolution of a complex genetic polymorphism: the evolution of self-fertilization in tristylousEichhornia paniculata (Pontederia-ceae). Evolution 43: 1398–1416.
Barrett, S. C. H., R. W. Ness, and M. Vallejo-Marín, 2009 Evolutionary pathways to self-fertilization in a tristylous plant species. New Phy-tol. 183: 546–556.
Barrett, S. C. H., R. Arunkumar, and S. I. Wright, 2014 The de-mography and population genomics of evolutionary transi-tions to self-fertilization in plants. Phil. Trans. R. Soc. B. 369: 20130344.
Birney, E., M. Clamp, and R. Durbin, 2004 GeneWise and
Ge-nomewise. Genome Res. 14: 988–995.
Brandvain, Y., T. Slotte, K. M. Hazzouri, S. I. Wright, and G. Coop, 2013 Genomic identification of founding haplotypes reveals the history of the selfing speciesCapsella rubella. PLoS Genet. 9: e1003754.
Caballero, A., and W. G. Hill, 1992 Effects of partial inbreeding on
fixation rates and variation of mutant genes. Genetics 131: 493– 507.
Camacho, C., G. Coulouris, V. Avagyan, N. Ma, J. Papadopoulos et al., 2009 BLAST+: architecture and applications. BMC Bio-informatics 10: 421.
Cao, J., K. Schneeberger, S. Ossowski, T. Günther, S. Benderet al., 2011 Whole-genome sequencing of multipleArabidopsis thali-anapopulations. Nat. Genet. 43: 956–963.
Charlesworth, B., 1992 Evolutionary rates in partially self-fertilizing species. Am. Nat. 140: 126–148.
Charlesworth, B., and D. Charlesworth, 1999 The genetic basis of inbreeding depression. Genet. Res. 74: 329–340.
Charlesworth, D., and S. I. Wright, 2001 Breeding systems and genome evolution. Curr. Opin. Genet. Dev. 11: 685–690. Charlesworth, D., and J. H. Willis, 2009 The genetics of
inbreed-ing depression. Nat. Rev. Genet. 10: 783–796.
Charlesworth, D., M. T. Morgan, and B. Charlesworth, 1993a Mutation accumulation in finite outbreeding and inbreeding populations. Genet. Res. 61: 39–56.
Charlesworth, B., M. T. Morgan, and D. Charlesworth, 1993b The effects of deleterious mutations on neutral molecular variation. Genetics 134: 1289–1303.
Comeron, J. M., A. Williford, and R. M. Kliman, 2008 The Hill-Robertson effect: evolutionary consequences of weak selection and linkage infinite populations. Heredity 100: 19–31.
Crow, J. F., and M. J. Simmons, 1983 The mutation load in
Drosophila, pp. 1–35 inThe Genetics and Biology of Drosophila,
edited by H. L. C. M. Ashburner, and J. N. Thomson. Academic Press, London.
Cutter, A. D., J. D. Wasmuth, and M. L. Blaxter, 2006 The evolu-tion of biased codon and amino acid usage in nematode ge-nomes. Mol. Biol. Evol. 23: 2303–2315.
Crnokrak, P., and S. C. H. Barrett, 2002 Purging the genetic load: a review of the experimental evidence. Evolution 56: 2347– 2358.
Danecek, P., A. Auton, G. Abecasis, C. A. Albers, E. Bankset al., 2011 The variant call format and VCFtools. Bioinformatics 27: 2156–2158.
DePristo, M., E. Banks, R. Poplin, K. V. Garimella, J. R. Maguire et al., 2011 A framework for variation discovery and genotyp-ing usgenotyp-ing next-generation DNA sequencgenotyp-ing data. Nat. Genet. 43: 491–498.
Doyle, J. J., and J. L. Doyle, 1987 A rapid DNA isolation procedure for small quantities of fresh leaf tissue. Phytochem. Bull. 19: 11–15. Doyle, J. J., and J. L. Doyle, 1990 Isolation of plant DNA from
fresh tissue. Focus 12: 13–15.
Edgar, R. C., 2004 MUSCLE: multiple sequence alignment with
high accuracy and high throughput. Nucleic Acids Res. 32: 1792–1797.
Edwards, K., C. Johnstone, and C. Thompson, 1991 A simple and rapid method for the preparation of genomic plant DNA for PCR analysis. Nucleic Acids Res. 19: 1349.
Escobar, J. S., A. Cenci, J. Bolognini, A. Haudry, S. Laurentet al., 2010 An integrative test of the dead-end hypothesis of selfing evolution in Triticeae (Poaceae). Evolution 64: 2855–2872. Gioti, A., J. E. Stajich, and H. Johannesson, 2013 Neurosporaand
the dead-end hypothesis: genomic consequences of selfing in the model genus. Evolution 67: 3600–3616.
Glémin, S., 2007 Mating systems and the efficacy of selection at the molecular level. Genetics 177: 905–916.
Glémin, S., and J. Ronfort, 2013 Adaptation and maladaptation in selfing and outcrossing species: new mutationsvs.standing var-iation. Evolution 67: 225–240.
Glover, D. E., and S. C. H. Barrett, 1987 Genetic variation in continental and island populations ofEichhornia paniculata (Pontederiaceae). Heredity 59: 7–17.
Haddrill, P. R., D. Bachtrog, and P. Andolfatto, 2008 Positive and negative selection on noncoding DNA in Drosophila simulans. Mol. Biol. Evol. 25: 1825–1834.
Hartfield, M., and S. Glémin, 2014 Hitchhiking of deleterious al-leles and the cost of adaptation in partially selfing species. Ge-netics 196: 281–293.
Haudry, A., A. Cenci, C. Guilhaumon, E. Paux, S. Poirier et al., 2008 Mating system and recombination affect molecular evo-lution in four Triticeae species. Genet. Res. 90: 97–109. Hazzouri, K. M., J. S. Escobar, R. W. Ness, L. Killian Newman, A. M.
Randleet al., 2013 Comparative population genomics in Col-linsiasister species reveals evidence for reduced effective pop-ulation size, relaxed selection, and evolution of biased gene conversion with an ongoing mating system shift. Evolution 67: 1263–1278.
Hedrick, P. W., 1994 Purging inbreeding depression and the prob-ability of extinction: full-sib mating. Heredity 73: 363–372. Husband, B. C., and S. C. H. Barrett, 1992 Effective population
size and genetic drift in tristylousEichhornia paniculata (Ponte-deriaceae). Evolution 46: 1875–1890.
Husband, B. C., and S. C. H. Barrett, 1993 Multiple origins of self-fertilization in tristylous Eichhornia paniculata (Pontederia-ceae): inferences from style morph and isozyme variation. J. Evol. Biol. 6: 591–608.
Husband, B. C., and S. C. H. Barrett, 1998 Spatial and temporal variation in population size ofEichhornia paniculatain ephem-eral habitats: implications for metapopulation dynamics. J. Ecol. 86: 1021–1031.
Igic, B., and J. W. Busch, 2013 Is self-fertilization an evolutionary dead end? New Phytol. 198: 386–397.
Keightley, P. D., and A. Eyre-Walker, 2007 Joint inference of the distribution offitness effects of deleterious mutations and pop-ulation demography based on nucleotide polymorphism fre-quencies. Genetics 177: 2251–2261.
Kousathanas, A., and P. D. Keightley, 2013 A comparison of mod-els to infer the distribution offitness effects of new mutations. Genetics 193: 1197–1208.
Lloyd, D. G., 1980 Demographic factors and mating patterns in angiosperms, pp. 67–88 inDemography and evolution in plant populations, edited by O. T. Solbrig Blackwell, Oxford. Li, H., and R. Durbin, 2009 Fast and accurate short read
align-ment with Burrows-Wheeler Transform. Bioinformatics 25: 1754–1760.
Li, H., B. Handsaker, A. Wysoker, T. Fennell, J. Ruanet al., 2009 The sequence alignment/map format and SAMtools. Bioinformatics 25: 2078–2079.
Lunter, G., and M. Goodson, 2011 Stampy: A statistical algorithm for sensitive and fast mapping of Illumina sequence reads. Ge-nome Res. 21: 936–939.
McVean, G. A. T., and B. Charlesworth, 2000 The effects of Hill-Robertson interference between weakly selected mutations on patterns of molecular evolution and variation. Genetics 155: 929–944.
Messer, P. W., 2013 SLiM: Simulating evolution with selection and linkage. Genetics 194: 1037–1039.
Messer, P. W., and D. A. Petrov, 2013 Frequent adaptation and the McDonald–Kreitman test. Proc. Natl. Acad. Sci. USA 110: 8615– 8620.
Manna, F., G. Martin, and T. Lenormand, 2011 Fitness
land-scapes: an alternative theory for the dominance of mutation. Genetics 189: 923–937.
Ness, R. W., S. I. Wright, and S. C. H. Barrett, 2010 Mating-system variation, demographic history and patterns of nucleotide diversity in the tristylous plantEichhornia paniculata. Genetics 184: 381–392. Ness, R. W., M. Siol, and S. C. H. Barrett, 2011 De novosequence assembly and characterization of the floral transcriptome in cross-and self-fertilizing plants. BMC Genomics 12: 298. Ness, R. W., M. Siol, and S. C. H. Barrett, 2012 Genomic
conse-quences of transitions from cross- to self-fertilization on the efficacy of selection in three independently derived selfing plants. BMC Genomics 13: 611.
Nordborg, M., 2000 Linkage disequilibrium, gene trees and selfing: an ancestral recombination graph with partial self-fertilization. Genetics 154: 923–929.
Pannell, J. R., and P. D. Fields, 2014 Evolution in subdivided plant populations: concepts, recent advances and future direc-tions. New Phytol. 201: 417–432.
Pennings, P. S., S. Kryazhimskiy, and J. Wakeley, 2014 Loss and recovery of genetic diversity in adapting populations of HIV. PLoS Genet. 10: e1004000.
Pollak, E., 1987 On the theory of partially inbreedingfinite pop-ulations. I. Partial selfing. Genetics 117: 353–360.
Qiu, S., K. Zeng, T. Slotte, S. I. Wright, and D. Charlesworth, 2011 Reduced efficacy of natural selection on codon usage bias in selfing Arabidopsis andCapsellaspecies. Genome Biol. Evol. 3: 868–880.
R Development Core Team, 2011 R: A language and environment
for statistical computing, R Foundation for Statistical Computing, Vienna.
Schulz, M. H., D. R. Zerbino, M. Vingron, and E. Birney, 2012 Oases: Robust de novo RNA-seq assembly across the dynamic range of expression levels. Bioinformatics 28: 1086–1092.
Simons, Y. B., M. C. Turchin, J. K. Pritchard, and G. Sella, 2014 The deleterious mutation load is insensitive to recent population his-tory. Nat. Genet. 46: 220–224.
Simmons, M. J., and J. F. Crow, 1977 Mutations effectingfitness inDrosophilapopulations. Annu. Rev. Genet. 11: 49–78. Slotte, T., K. M. Hazzouri, J. A. Ågren, D. Koenig, F. Maumuset al.,
2013 TheCapsella rubellagenome and the genomic consequen-ces of rapid mating system evolution. Nat. Genet. 45: 831–835. Städler, T., B. Haubold, C. Merino, W. Stephan, and P. Pfaffelhuber,
2009 The impact of sampling schemes on the site frequency spectrum in nonequilibrium subdivided populations. Genetics 182: 205–216.
Stebbins, G. L., 1957 Self fertilization and population variability in the higher plants. Am. Nat. 91: 337–354.
Sweigart, A. L., and J. H. Willis, 2003 Patterns of nucleotide di-versity in two species ofMimulusare affected by mating system and asymmetric introgression. Evolution 57: 2490–2506. Szövényi, P., N. Devos, D. J. Weston, X. Yang, Z. Hock et al.,
2014 Efficient purging of deleterious mutations in plants with haploid selfing. Genome Biol. Evol. 6: 1238–1252.
Takebayashi, N., and P. L. Morrell, 2001 Is self-fertilization an evolutionary dead end? Revisiting an old hypothesis with ge-netic theories and a macroevolutionary approach. Am. J. Bot. 88: 1143–1150.
Tamura, K., G. Stecher, D. Peterson, A. Filipski, and S. Kumar, 2013 MEGA6: Molecular Evolutionary Genetics Analysis ver-sion 6.0. Mol. Biol. Evol. 30: 2725–2729.
Wakeley, J., and S. Lessard, 2003 Theory of the effects of popu-lation structure and sampling on patterns of linkage disequilib-rium applied to genomic data from humans. Genetics 164: 1043–1053.
Wang, J., W. G. Hill, D. Charlesworth, and B. Charlesworth, 1999 Dynamics of inbreeding depression due to deleterious mutations in small populations: mutation parameters and in-breeding rate. Genet. Res. 74: 165–178.
Wigginton, J. E., D. J. Cutler, and G. R. Abecasis, 2005 A note on exact tests of Hardy-Weinberg equilibrium. Am. J. Hum. Genet. 76: 887–893.
Williamson, R. J., E. B. Josephs, A. E. Platts, K. M. Hazzouri, A. Haudry et al., 2014 Evidence for widespread positive and negative selection in coding and conserved noncoding regions ofCapsella grandiflora. PLoS Genet. 10: e1004622.
Wright, S. I., B. Lauga, and D. Charlesworth, 2002 Rates and patterns of molecular evolution in inbred and outbred Arabidop-sis. Mol. Biol. Evol. 19: 1407–1420.
Wright, S. I., R. W. Ness, J. P. Foxe, and S. C. H. Barrett, 2008 Genomic consequences of outcrossing and selfing in plants. Int. J. Plant Sci. 169: 105–118.
Wright, S. I., S. Kalisz, and T. Slotte, 2013 Evolutionary conse-quences of self-fertilization in plants. Proc. R. Soc. B 280: 20130133.
Zerbino, D. R., and E. Birney, 2008 Velvet: algorithms for de novo short read assembly using de bruijn graphs. Genome Res. 18: 821–829.
Zerbino, D. R., 2010 Using the velvetde novoassembler for short-read sequencing technologies. Curr. Protoc. Bioinformatics 31: 11.5.1–11.5.12.
Communicating editor: L. C. Moyle
GENETICS
Supporting Information http://www.genetics.org/lookup/suppl/doi:10.1534/genetics.114.172809/-/DC1
The Evolution of Sel
fi
ng Is Accompanied by
Reduced Ef
fi
cacy of Selection and Purging
of Deleterious Mutations
Ramesh Arunkumar, Rob W. Ness, Stephen I. Wright, and Spencer C. H. Barrett
2 SI R. Arunkumar et al.
Figure S1 Genome structure implemented in the simulations. Each genome was 100 Mbp comprised of alternating 800 bp noncoding (NC) and 200 bp coding (C) regions. All sites in NC and 25% of sites in C were neutral with h=0.5 and the remaining 75% of C were under varying selection coefficients.
R. Arunkumar et al. 3 SI
Figure S2 Length distribution of all contigs from the de novo assembly of six Jamaican genotypes of Eichhornia paniculata using Velvet‐Oases. The summary statistics for the assembly are shown in the table within the figure. The N50 value shows that 50% of
all bases in the assembled reference are in contigs of size corresponding to this value or larger.
4 SI R. Arunkumar et al.
Figure S3 Coverage distribution of genomic reads from one selfing Mexican genotype of Eichhornia paniculata mapped to the de novo transcriptome reference.
R. Arunkumar et al. 5 SI