DOI: 10.1534/genetics.105.047209
Identification of Quantitative Trait Loci Across Recombinant Inbred Lines
and Testcross Populations for Traits of Agronomic Importance in Rice
Aiqing You,* Xinggui Lu,
†Huajun Jin,* Xiang Ren,* Kai Liu,
†Guocai Yang,
†Haiyuan Yang,* Lili Zhu* and Guangcun He*
,1*The Key Laboratory for Developmental Biology, College of Life Sciences, Wuhan University, Wuhan 430072, China and
†Hybrid Rice Research Center, Hubei Academy of Agricultural Sciences, Wuhan 430064, China
Manuscript received June 24, 2005 Accepted for publication November 11, 2005
ABSTRACT
This study was conducted to determine whether quantitative trait loci (QTL) controlling traits of agro-nomic importance detected in recombinant inbred lines (RILs) are also expressed in testcross (TC) hybrids of rice. A genetic map was constructed using an RIL population derived from a cross between B5 and Minghui 63, a parent of the most widely grown hybrid rice cultivar in China. Four TC hybrid populations were produced by crossing the RILs with three maintaining lines for the widely used cytoplasmic male-sterile (CMS) lines and the genic male-sterile line Peiai64s. The mean values of the RILs for the seven traits in-vestigated were significantly correlated to those of the F1hybrids in the four TC populations. Twenty-seven main-effect QTL were identified in the RILs. Of these, the QTL that had the strongest effect on each of the seven traits in the RILs was detected in two or more of the TC populations, and six other QTL were detected in one TC population. Epistatic analysis revealed that the effect of epistatic QTL was relatively weak and cross combination specific. Searching publicly available QTL data in rice revealed the positional convergence of the QTL with the strongest effect in a wide range of populations and under different environments. Since the main-effect QTL is expressed across different testers, and in different genetic backgrounds and environ-ments, it is a valuable target for gene manipulation and for further application in rice breeding. When a restorer line that expresses main-effect QTL is bred, it could be used in a number of cross combinations.
H
ETEROSIS has been very successfully exploited in diverse plants and animals. In agriculture, hybrid varieties contribute strongly worldwide to the produc-tion of many crop species, including the most impor-tant food crops, such as maize and rice (Stuber1994; Yuan1998; Khush2001). Hybrid rice has a yield advan-tage of15–20% over the best commercial rice varie-ties. The area planted to hybrid rice in China accounts for.50% of the total rice area of the country at pres-ent. The cultivation of hybrid rice has started on a large scale in many Asian countries.Several hypotheses have been proposed to explain the genetic basis of heterosis. The dominance hypoth-esis (Bruce1910) proposes that dominant factors from either parent mask deleterious recessive mutations from the other parent in the heterozygous F1population. In
contrast, the overdominance hypothesis (Shull1908) holds that heterozygosity at single loci confers proper-ties that are superior to either homozygote. The two hypotheses have been verified with molecular biology experiments (Stuber et al.1992; Xiao et al.1995). A third hypothesis suggests that heterosis may arise from epistasis between alleles at different loci (Yuet al.1997;
Goodnight1999). More recently, further results have suggested that epistasis is the primary genetic basis of heterosis. It is suggested that separate efforts should be taken for breeding high-yielding inbred and hybrid cultivars in rice (Liet al.2001; Luoet al.2001).
In hybrid rice breeding programs in China, the breeders have made intense efforts to improve the traits of inbred lines and have obtained a number of elite lines, for example, Minghui 63, a restorer line of the most popular hybrid rice variety Shanyou 63, and 9311, a restorer line of the first super hybrid rice. The character-istics of the parental lines have a profound effect on those of the F1offspring. Once an elite restorer line or
male-sterile line has been developed, it is used to breed a series of hybrid varieties with strong heterosis that can be applied in rice production. The fact that the superior parental lines favorably enhance the performance of hybrid rice derived from many combinations in practice suggests that some common quantitative trait loci (QTL) may affect the performance of both the parental lines and the hybrids. Therefore, the detection of QTL controlling traits of the inbred lines and that of their hybrids is needed to understand the underlying genetic basis of the hybrid performance and to facilitate marker-aided breeding of hybrid rice.
The development of molecular markers in quantita-tive genetics greatly facilitates the study of quantitaquantita-tively
1Corresponding author: College of Life Sciences, Wuhan University,
Wuchang, Wuhan 430072, China. E-mail: [email protected]
inherited complex traits related to F1heterosis and has
made it possible to dissect the polygenes associated with such traits into individual Mendelian factors (Paterson
et al. 1988; Stuber et al. 1992). Molecular linkage ge-netic maps and QTL mapping techniques have been used to investigate the relationships between inbred lines and their hybrids and to identify QTL controlling agro-nomic traits and crop yields. Stuberet al. (1992) mapped QTL contributing to grain yield in two maize backcross (BC) populations derived from crosses between the F3
progeny from a B733 Mo17 cross and their parental lines. The BC to B73 showed at least six QTL and the BC to Mo17 showed at least eight QTL for grain yield, and three of the QTL were detected in both of these BC pop-ulations. Xiaoet al. (1995) investigated QTL controlling grain yield components in two rice BCF1populations
be-tween 198 F7recombinant inbred lines (RILs) and their
parents. In all, 37 QTL were detected in the two pop-ulations: 27 QTL were detected in only one BCF1
pop-ulation and the other 10 were detected in two BCF1
populations. Liet al.(2001) constructed five related rice mapping populations, including one RIL, two BC pop-ulations, and two testcross (TC) poppop-ulations, which they analyzed in an attempt to detect QTL and found no correlation between the F1populations and their maternal
RILs in terms of biomass yield and grain yield. Using data from the same experiment, Luoet al.(2001) found no cor-relations between the F1populations and their maternal
RILs for the grain yield components PP (panicles per plant) and GP (grains per panicles). However, there was a significant correlation for GW (1000-grain weight). In cur-rent hybrid rice breeding, the male-sterile lines are crossed with elite restorer lines that are unrelated in pedigree, rather than backcrossed. The genetic relationships between the parental lines and F1hybrids remain to be elucidated.
In the study reported in this article, we introduced an experimental design that produced TC populations by mating the RILs with maintaining lines for currently popular improved male-sterile lines with different types of cytoplasmic male sterilities and a genic male-sterile line, which are unrelated by pedigree to the RILs. The RILs were derived from a cross between Minghui 63, a parent of the most widely grown hybrid variety, Shanyou 63, and B5, a breeding line with superior resistance developed at Wuhan University. The RILs and their corresponding TC hybrids were evaluated for seven traits of agronomic importance. The objectives of this study were to detect and evaluate the QTL controlling the agronomic traits in RILs and the performance of TC hybrids and to understand the genetic relationship between the inbred lines and their F1 hybrids of
im-proved modern rice.
MATERIALS AND METHODS
Plant materials: Five related mapping populations were used in this study. One was an RIL population composed of
187 F8 lines derived by single-seed descent from a cross between Minghui 63 and B5 (Minghui 63/B5). Minghui 63 is a restorer line for many hybrid rice varieties. Three maintaining lines (Zhenshan 97B, II-32B, and YuetaiB) were selected to cross with the RILs because they have the same genomic composition as the corresponding cytoplasmic male-sterile (CMS) lines that are currently in common use. These lines are the maintaining lines for Zhenshan 97A, II-32A, and YuetaiA, which have WA-, IA-, and HL-type cytoplasmic male sterility, respectively. The other selected line was Peiai64s, a photo-thermo-sensitive genic male-sterile (PTGMS) line in which sterility is controlled by recessive nucleic genes. Four TC populations were developed, consisting of 160 Zhenshan 97B F1hybrids (Zhenshan97B/RILs, TCP1), 181 II-32B F1hybrids (II-32B/RILs, TCP2), 187 YuetaiB F1hybrids (YuetaiB/RILs, TCP3), and 187 Peiai64s F1hybrids (Peiai64s/RILs, TCP4).
Phenotypic evaluation:The 902 F1TC lines and 187 F8RILs were laid out in a field in a randomized complete block design with two replications (plots) for phenotypic evaluation in the summer of 2002 at the experimental farm of the Hubei Academy of Agricultural Sciences (Wuhan, China). Each plot consisted of three rows, each with 10 hills. Seedlings, 30 days old, of all experimental materials were transplanted in the field with a spacing of 16.7 cm between plants within each row and 26.7 cm between the rows. The middle six plants in the central row of each plot were sampled for analysis. The seven quantitative traits investigated were: heading date (HD; in days), plant height (PH; in centimeters), panicles per plant (PPP), spikelets per panicle (SPP), grains per panicle (GPP), GW (in grams), and grain yield per plant (GYPP; in grams). For SPP, GPP, and GYPP, all panicles in a plant were counted. Means over replications, for each trait and for each popula-tion, were used for QTL and other analyses.
Molecular markers and linkage maps: Preparation of genomic DNA from the parents and RILs followed the CTAB method as described by Murrayand Thompson(1980). Two types of markers, RFLPs and SSRs, were used to survey DNA polymorphisms in the RILs. RFLP analyses, including re-striction digestion, Southern blotting, and hybridization, were essentially as described by Huanget al. (2001). Six restriction enzymes (Apa,BamHI,HindIII,EcoRI,EcoRV, andDraI) were used for surveying RFLPs. The RFLP probes were kindly provided by the Japanese Rice Genome Research Project and S. D. Tanksley and S. McCouch, Cornell University. In addition, 300 primer pairs from published data were used to survey SSR polymorphisms between the parents. The analysis, including PCR reactions and detection, essentially followed the methods of Wuand Tanksley (1993). The DNA markers that detected polymorphisms between the parents were used to assay the entire population of 187 RILs. Molecular marker linkage maps were constructed using MAP-MAKER/EXP version 3.0 (Lincolnet al. 1992).
all QTL was estimated by fitting a multiple regression model into the QTLMapper program.
RESULTS
Molecular marker linkage map:A molecular marker
linkage map was constructed on the basis of the RILs of Minghui 63/B5 with 187 lines that served as the base population for generating the four TC populations em-ployed in this study. A total of 244 molecular markers, including 190 RFLP and 54 SSR loci, were mapped on 12 linkage groups, covering 1478 cM according to the Kosambi function with an average interval of 6.1 cM between adjacent markers. The markers distributed rel-atively evenly among the chromosomes, and marker orders on the maps were in good agreement with those on previously published maps (Causse et al. 1994; Harushima et al. 1998). Genotype segregation ratios of Minhui 63 and B5 followed the expected Mendelian ratio of 1:1 for most of the markers, except 12 markers (RM233, R2724, Y0193, R569, Y143D, S1520, R1679, RM242, R562, S1559B, R1506, and R2672) displayed distorted segregation ratios. This map is suitable for QTL analysis.
The performance of the populations: The means,
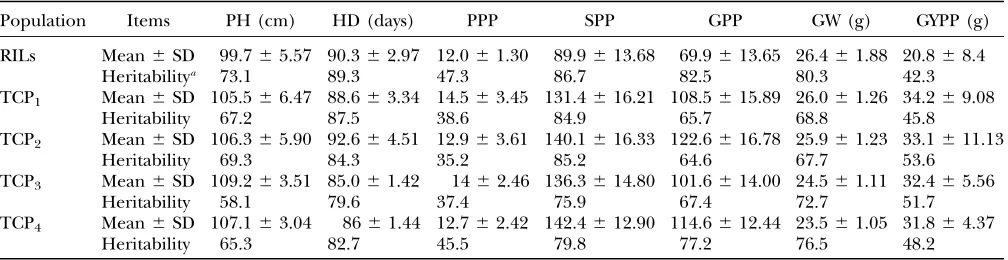
SDs, and heritability of seven quantitative traits mea-sured in the RILs and the four TC progenies are listed in Table 1. The measurements of seven traits varied widely in the RILs and the four TC progenies. The values for all of the traits were approximately normally distributed (data not shown), indicating the feasibility of QTL mapping for all these traits in the RILs and the four TC populations. The mean values showed that the grain yield and its components, except for GW, of the TC populations were higher than the corresponding values of the RIL population. The TC plants were also taller than the RIL plants. The heritability was high for PH,
HD, SPP, GPP, and GW and low for PPP and GYPP in the RIL and the four F1populations.
Relationships between the trait values of RILs and F1
populations: Table 2 shows the phenotypic correlation
coefficients between the values of individual F1hybrids
and the values of their paternal RILs for the seven traits investigated. For all traits evaluated, there was a signif-icant correlation between the means of the RILs and their F1performance in four TC populations, and the
performance of TC hybrids was related to that of the RILs. The correlation coefficients were high for PH, HD, and GW; intermediate for PPP, SPP, and GPP; and low for GYPP. The presence of significant correlation between RILs and F1’s for the investigated seven traits
differs from the findings of Luo et al.(2001), possibly because of differences in the experimental materials and design between the two studies.
The contributions of six component traits to GYPP:
The partialR2of six component traits to the total
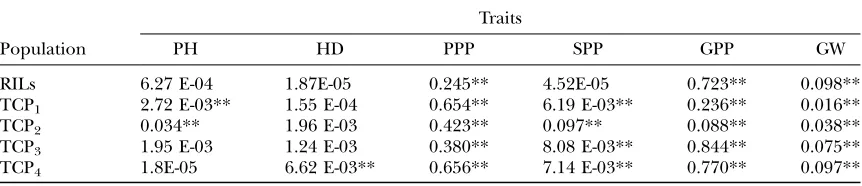
vari-ances of grain yield per plant in the five populations are listed in Table 3. Regression analyses indicated that the three main yield traits PPP, GPP, and GW had high con-tributions (partialR2) to the total variances of GYPP and
that the contributions of the other traits were very low in the five populations. The partialR2in the testcross
pop-ulations (TCPs) TCP1, TCP2, TCP3, and TCP4were 65.4,
42.3, 38.0, and 65.6% for PPP; 23.6, 8.8, 84.4, and 77.0% for GPP; and 1.6, 3.8, 7.5, and 9.7% for GW, respectively. For the RILs, the partialR2was 24.5, 72.3, and 9.8% for
PPP, GPP, and GW. For the three traits, the observed levels of the partial R2 were higher for PPP and GPP
than for GW.
Main-effect QTL across RILs and TC progeny: A
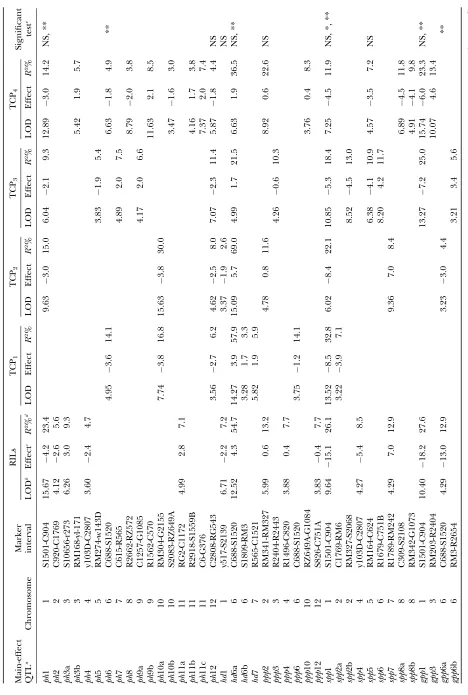
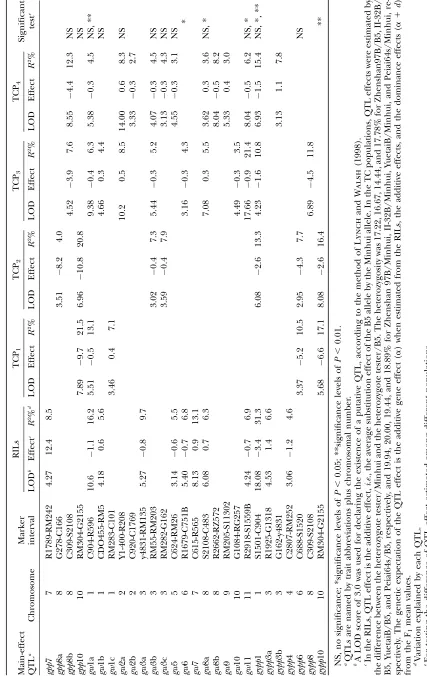
total of 67 main-effect QTL affecting the seven traits in the RILs and the four TC populations were identified (Table 4, Figure 1). Seventeen main-effect QTL, dis-persed among all 12 chromosomes, were mapped for
TABLE 1
Summary statistics for the seven quantitative traits measured in RILs and four TC populations
Population Items PH (cm) HD (days) PPP SPP GPP GW (g) GYPP (g)
RILs Mean6SD 99.765.57 90.362.97 12.061.30 89.9613.68 69.9613.65 26.461.88 20.868.4
Heritabilitya 73.1 89.3 47.3 86.7 82.5 80.3 42.3
TCP1 Mean6SD 105.566.47 88.663.34 14.563.45 131.4616.21 108.5615.89 26.061.26 34.269.08
Heritability 67.2 87.5 38.6 84.9 65.7 68.8 45.8
TCP2 Mean6SD 106.365.90 92.664.51 12.963.61 140.1616.33 122.6616.78 25.961.23 33.1611.13
Heritability 69.3 84.3 35.2 85.2 64.6 67.7 53.6
TCP3 Mean6SD 109.263.51 85.061.42 1462.46 136.3614.80 101.6614.00 24.561.11 32.465.56
Heritability 58.1 79.6 37.4 75.9 67.4 72.7 51.7
TCP4 Mean6SD 107.163.04 8661.44 12.762.42 142.4612.90 114.6612.44 23.561.05 31.864.37
Heritability 65.3 82.7 45.5 79.8 77.2 76.5 48.2
PH, HD, PPP, SPP, GPP, GW, and GYPP indicate plant height, heading date, panicles per plant, spikelets per panicle, grains per panicle, 1000-grain weight, and grain yield per plant, respectively.
TCP1, TCP2, TCP3, and TCP4indicate the TC populations comprising the F1offspring of Zhenshan 97B3RILs, II-32B3RILs, YuetaiB3RILs, and Peiai64s3RILs, respectively.
aHeritability was broad-sense Heritability (h2
PH, which explained 50.1, 37.1, 53.0, 40.2, and 55.7% of the variance of this trait in the RILs, TCP1, TCP2, TCP3,
and TCP4, respectively. Five of these main-effect QTL
were detected in the RILs. The main-effect QTL ph1, which is bordered by markers S1501-C904 on chromo-some 1 and had the strongest effect in the RILs, was detected in three TC populations (TCP2, TCP3, and
TCP4). The other 5 main-effect QTL detected in the
RILs were not detected in any TC populations. In all, 12 main-effect QTL were detected in TC populations but not in RILs: ph12b (C2808-RG543) was detected in all four TC populations,ph6 (C688-S1520) and ph10a (RM304-G2155) were detected in two TC populations [(TCP1and TCP4) and (TCP1and TCP2,) respectively],
while each of the other 9 main-effect QTL was detected in only one TC population. For the common main-effect QTL, for example,ph1, which was detected in the RILs and three TC progenies, the direction of the parental (B5) contribution was the same. However, the magni-tude ofph1’s effect was not consistent across the RILs and the three TC progenies (4.2, 3.0, 2.1, and 3.0 in the RILs, TCP2, TCP3, and TCP4, respectively; see Table 4);
the difference in main effect was significant between RILs and TCP3, and not among other populations. The
same tendencies were observed for the other common main-effect QTL.
Only four main-effect QTL were detected for HD, accounting for 61.9, 67.1, 71.6, 21.5, and 36.5%
of the total variance of the trait in the RILs, TCP1, TCP2,
TCP3, and TCP4, respectively. Two main-effect QTL
were detected in the RILs.Hd6a, which is bordered by markers C688-S1520 on chromosome 6 and has the largest effect in the RILs, was also identified in four TC populations. This allele contributed a considerable portion to the total heading date variation in the TCPs (47.9% on average, ranging from 21.5 to 69.0%). Another main-effect QTL detected in RILs, hd1, was also identified in TCP2. The other two main-effect
QTL (hd6b and hd7) were identified in only one TC population. For the common main-effect QTL (hd6a), detected across the RILs and four TC progenies, the source of parental contribution was the same (Minghui 63).
Six main-effect QTL affecting the number of PPP were revealed, explaining 28.6, 14.1, 11.6, 10.3, and 30.9% of the total variance of this trait in the RILs, TCP1,
TCP2, TCP3, and TCP4, respectively. Three of these
main-effect QTL were detected in the RILs. The QTL
ppp2, which is bordered by markers RM341-RM327 on chromosome 2 and has the largest effect in the RILs, was detected in three TC populations (TCP2, TCP3, and
TCP4). The other two main-effect QTL (ppp4 and
ppp12) found in the RILs were not detected in any TC populations. Four main-effect QTL (ppp3,ppp6a,ppp6b, andppp10) were identified in TC populations, but not in the RILs. The direction of parental contribution and
TABLE 2
Phenotypic correlation (r) coefficients for traits of agronomic importance between the mean trait values of RILs and F1performance
Population
Traits
PH HD PPP SPP GPP KGW GYPP
TCP1 0.412** 0.761** 0.468** 0.468** 0.430** 0.594** 0.222*
TCP2 0.465** 0.851** 0.671** 0.671** 0.685** 0.680** 0.321**
TCP3 0.604** 0.576** 0.350** 0.350** 0.495** 0.725** 0.234*
TCP4 0.610** 0.765** 0.285** 0.285** 0.453** 0.750** 0.356**
* Significance levels ofP,0.05; **significance levels ofP,0.01.
TABLE 3
The partialR2of six traits to the total variances of grain yield per plant in the five populations
Population
Traits
PH HD PPP SPP GPP GW
RILs 6.27 E-04 1.87E-05 0.245** 4.52E-05 0.723** 0.098**
TCP1 2.72 E-03** 1.55 E-04 0.654** 6.19 E-03** 0.236** 0.016**
TCP2 0.034** 1.96 E-03 0.423** 0.097** 0.088** 0.038**
TCP3 1.95 E-03 1.24 E-03 0.380** 8.08 E-03** 0.844** 0.075**
TCP4 1.8E-05 6.62 E-03** 0.656** 7.14 E-03** 0.770** 0.097**
the magnitude of the effect for the common QTL on the number of panicles per plant displayed the same trends as those affecting PH and HD.
We identified nine main-effect QTL affecting SPP, which explained 47.5, 39.9, 30.5, 54.0, and 40.7%, respectively, of the total variance of this trait in the five related populations. Three of these QTL were detected in the RILs. The QTLspp1, which is flanked by markers S1501-C904 on chromosome 1 and has the largest effect in the RILs, was also detected in four TC populations. Main-effect QTL spp7 was identified in only one TC population (TCP2) andspp4 was not identified in any
TC populations. Six main-effect QTL were revealed in TC populations, but not in RILs. Of these,spp5 (RM164-C624) was identified in two TC populations (TCP3and
TCP4), and each of the other five was detected in only
one of the four TC populations.
Eight main-effect QTL related to the number of GPP were found, which explained 49.0, 21.5, 29.2, 38.2, and 49.0% of the total variance of this trait in the five related populations, respectively. Three main-effect QTL were detected in the RILs:gpp1 (which is flanked by markers S1501-C904 on chromosome 1 and has the largest effect in RILs) was detected in two TC populations (TCP3and
TCP4); the QTL gpp6a (C688-S1520) was identified in
one TC population (TCP2); andgpp7 (R1789-RM242)
was not detected in any TC populations. Five main-effect QTL were revealed in TC populations, but not in RILs:
gpp8b andgpp10 were identified in two of the four TC populations [(TCP3and TCP4) and (TCP1and TCP2)],
respectively, while each of the other three was detected in only one of the four TC populations.
As many as 16 main-effect QTL affecting GW were detected, which explained 70.1, 20.2, 15.2, 59.1, and 48.4% of the total variance of this trait in the five related populations, respectively. Eight main-effect QTL were detected in the RILs: gw1a, which mapped between markers C904 and R596 on chromosome 1, had the largest effect in RILs and was also detected in three TC populations (TCP1, TCP3, and TCP4); gw8a andgw11
were also identified in TCP3and TCP4;gw1b,gw5, and
gw6 were each identified in just one TC population. Two main-effect QTL (gw3a and gw7) detected in the RILs were not identified in any TC populations. Eight main-effect QTL were found in TC populations but not in the RILs. Of these,gw3b was detected in three TC popula-tions, and bothgw2a andgw3c were detected in two TC populations. The other 5 main-effect QTL were each detected in only one of the four TC populations.
Seven main-effect QTL affecting GYPP were identi-fied, which explained 42.5, 27.6, 37.4, 22.6, and 23.2% of the total variance of this trait in the five populations, respectively. Three of these main-effect QTL were detected in the RIL population;gypp1, which is located between S1501 and C904 on chromosome 1 and has the largest effect in RILs, was also detected in three TC pop-ulations, while the other two (gypp3a and gypp4) were
not identified in any TC populations. Four main-effect QTL that were not detected in the RIL population were found in TC populations: gypp6 and gypp10 were both identified in two TC populations, while each of the other two (gypp3b andgypp8) were found in only one TC population.
Epistatic QTL detected in the RILs and TC
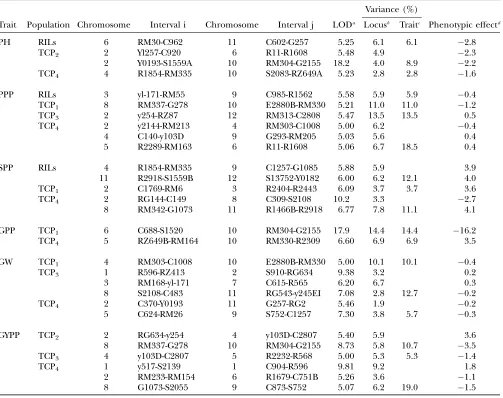
proge-nies:Table 5 shows 29 digenic epistatic QTL pairs
iden-tified in the RIL and four TC populations. No common digenic epistatic QTL pairs were detected in the RILs and all of the TC populations, and no epistatic QTL were identified for HD in the five populations.
For plant height, four pairs of epistatic QTL (one in both the RILs and TCP4, two in TCP2) were identified,
which explained 6.1, 8.9, and 2.8% of the total variation of this trait in the RILs and the two TC F1populations,
respectively. For panicles per plant, six pairs of epistatic QTL (one in each of the RILs, TCP1, and TCP3, and
three in TCP4) were detected, explaining 5.9, 11.0, 13.5,
and 18.5% of the total variation of this trait in the RILs and three TC populations, respectively. For spikelets per panicle, five pairs of epistatic QTL (one in TCP1, two in
both the RILs and TCP4) were found, accounting for
12.1, 3.7, and 11.1% of the total variation of this trait in the RILs and two TC F1hybrids, respectively. Only two
pairs of epistatic QTL (one in both TCP1 and TCP4)
were revealed for grain number per panicle, explaining 14.4 and 6.9% of total phenotypic variation in two TC F1
hybrids, respectively. For 1000-grain weight, six pairs of epistatic QTL (one in TCP1, two in TCP4, three in TCP3)
were detected, which explained 10.1, 12.7, and 5.7% of total phenotypic variation in three TC F1hybrids,
respec-tively. For grain yield per plant, six pairs of epistatic QTL (one in TCP3, two in TCP2, and three in TCP4) were
identified, explaining 10.7, 5.3, and 19.0% of total phe-notypic variation in the three TC F1populations,
respec-tively. In summary, only a small number of epistatic QTL were detected and the degrees of variation that they explained were relatively small compared to the main-effect QTL.
DISCUSSION
Selection of TC populations and improved modern
rice as experiment materials: It is essential to use
ap-propriate experimental designs and materials for QTL mapping, and strenuous efforts have been made to construct experimental populations for detecting and analyzing QTL in the last decade. Plant populations with various genetic structures have been developed for the purpose, mainly consisting of F2/F3, BC, double
F
igure
1.—Genomic
locations
of
main-effect
QTL
for
the
seven
investigated
traits
of
agronomic
importance
in
the
Minghui63/B5
RILs
and
four
testcross
F1
F
igure
1.—
alleles segregate at each polymorphic locus. In rare cases, TC progenies and immortalized F2populations
have been used (Li et al. 2001; Hua et al. 2002). In studies seeking common QTL in inbred lines and their hybrid progenies, backcross populations are usually em-ployed. In the study reported in this article, we intro-duced a variant of design III (Comstockand Robison 1948), which produced four TC progenies by mating three maintaining lines for different types of cytoplasmic male sterility and one PTGMS line with the RILs. With such populations, we could compare the QTL across the RILs and the four TC populations with a set of common male parents (RILs). Our design was expected to increase the scope to identify QTL, and even multiple alleles at
QTL loci, because of the inclusion of four testers as parents of the mapping populations. This was particu-larly true since the four testers were genetically divergent and unrelated in pedigree to the RILs. As shown by the data presented here, we were able to detect a total of 67 main-effect QTL (or 9.6 QTL/trait) and 29 epistatic QTL pairs (or 4.1 pair/trait) in the populations.
Another feature of this experiment is the selection of improved modern rice lines as the testers for TCs and the parents for the RILs. Minghui63, a parental variety of the RILs, is a restorer line of the most popular hybrid rice variety, Shanyou 63. The total planting area of Shanyou63 has exceeded 67 million hectares (ha) in China and other Asian countries. Minghui63 is also a restorer line
TABLE 5
Epistaic QTL affecting traits of agronomic importance detected in RILs and TC progenies
Trait Population Chromosome Interval i Chromosome Interval j LODa
Variance (%)
Phenotypic effectd
Locusb Traitc
PH RILs 6 RM30-C962 11 C602-G257 5.25 6.1 6.1 2.8
TCP2 2 Yl257-C920 6 R11-R1608 5.48 4.9 2.3
2 Y0193-S1559A 10 RM304-G2155 18.2 4.0 8.9 2.2
TCP4 4 R1854-RM335 10 S2083-RZ649A 5.23 2.8 2.8 1.6
PPP RILs 3 yl-171-RM55 9 C985-R1562 5.58 5.9 5.9 0.4
TCP1 8 RM337-G278 10 E2880B-RM330 5.21 11.0 11.0 1.2
TCP3 2 y254-RZ87 12 RM313-C2808 5.47 13.5 13.5 0.5
TCP4 2 y2144-RM213 4 RM303-C1008 5.00 6.2 0.4
4 C140-y103D 9 G293-RM205 5.03 5.6 0.4
5 R2289-RM163 6 R11-R1608 5.06 6.7 18.5 0.4
SPP RILs 4 R1854-RM335 9 C1257-G1085 5.88 5.9 3.9
11 R2918-S1559B 12 S13752-Y0182 6.00 6.2 12.1 4.0
TCP1 2 C1769-RM6 3 R2404-R2443 6.09 3.7 3.7 3.6
TCP4 2 RG144-C149 8 C309-S2108 10.2 3.3 2.7
8 RM342-G1073 11 R1466B-R2918 6.77 7.8 11.1 4.1
GPP TCP1 6 C688-S1520 10 RM304-G2155 17.9 14.4 14.4 16.2
TCP4 5 RZ649B-RM164 10 RM330-R2309 6.60 6.9 6.9 3.5
GW TCP1 4 RM303-C1008 10 E2880B-RM330 5.00 10.1 10.1 0.4
TCP3 1 R596-RZ413 2 S910-RG634 9.38 3.2 0.2
3 RM168-yl-171 7 C615-R565 6.20 6.7 0.3
8 S2108-C483 11 RG543-y245EI 7.08 2.8 12.7 0.2
TCP4 2 C370-Y0193 11 G257-RG2 5.46 1.9 0.2
5 C624-RM26 9 S752-C1257 7.30 3.8 5.7 0.3
GYPP TCP2 2 RG634-y254 4 y103D-C2807 5.40 5.9 3.6
8 RM337-G278 10 RM304-G2155 8.73 5.8 10.7 3.5
TCP3 4 y103D-C2807 5 R2232-R568 5.00 5.3 5.3 1.4
TCP4 1 y517-S2139 1 C904-R596 9.81 9.2 1.8
2 RM233-RM154 6 R1679-C751B 5.26 3.6 1.1
8 G1073-S2055 9 C873-S752 5.07 6.2 19.0 1.5
aA LOD score of 5.0 was used for declaring the existence of putative pairs of epistatic QTL, according to the method of Lynch
and Walsh(1998).
bVariance (%) for locus is the proportion of variance explained by the component epistasis. c
Variance (%) for trait is the total variance of this trait explained by all epistatic QTL detected in a population.
d
for many other hybrid rice varieties, with a combined total planting area of 130 million ha. The high general combining ability and the genetic basis of Minghui63 are attractive to rice breeders. Three maintaining lines used in this experiment are among the best in China. Zhenshan97B is the maintainer of Zhenshan97A, which is the female parent of Shanyou63 and a number of other hybrid varieties with a total planting area of 108 million ha. In addition, the respective CMS lines of II-32B and YuetaiB, which have different types of cytoplasmic male sterility, are widely employed in rice breeding programs and the areas planted with them are rapidly growing. Another tester, Peiai64S, is a PTGMS rice line that is the parental line of the first super hybrid rice in China. Utilizing Peiai64s, many hybrid rice combinations have been released for rice production. For field trials, we used TC progenies derived directly from crossing the breeding lines (RILs) with maintaining lines for different types of CMS and PTGMS lines, closely resembling practices in modern rice breeding strategies. Data on QTL and the genetic features associated with them, detected using improved modern rice varieties, are expected to be more attractive to breeders than data obtained using other types of material since such results are likely to be highly applicable to contemporary rice breeding programs.
Comparison of QTL mapped in RILs and their TC
populations in rice: In this study, F1performance was
related to the performance of the parental lines ac-cording to both the phenotypic correlation analysis (Table 2) and the QTL mapping (Table 4). In all, 67 distinct main-effect QTL were identified for seven traits in the RILs and four TC populations. Of these, 27 were identified in the RIL population. For each trait, the QTL that had the strongest effect in the RILs (giving a total of 9 such QTL) were also detected in two, three, or four TC populations. Six main-effect QTL in RILs were identified in one TC populations. Another 12 main-effect QTL detected in RILs were not identified in any TC populations. In all instances of common main-effect QTL across the RILs and multiple TC progenies, the direction of parental contribution was the same. Several features of the distribution of main-effect QTL in the RILs and TC progenies for the seven traits under study can be noted. First, only the main-effect QTL with the largest effects in the RILs for each trait were detected in two or more TC populations, and except for GW only one such QTL was identified for the other six traits considered. Second, some main-effect QTL that were detected in RILs were identified in one TC population, and more than half of the main-effect QTL detected in RILs were identified in TC populations. Third, effects of the common main-effect QTL among the RILs and four TC progenies may vary in the magnitude of their sub-stitution effects, but do not change in parental contri-bution. Fourth, both Minghui 63 and B5 contributed to increased trait values across the RILs and four TC pop-ulations for the seven traits evaluated.
A number of main-effect QTL were detected either in TC populations or in RILs. When comparing QTL mapped in RILs and their TC populations, we have to take into account the fact that TC progenies are likely to show only half of the difference in performance attach-able to any specific marker compared to the difference between the testers and the RILs. In RILs, a QTL is identified when the additive effect between lines homo-zygous for the allele from the parents is significant. TC progenies carry only one allele from RILs in combina-tion with another allele from the tester. A QTL is de-tected when the substitution effect of replacing an allele from RILs with the allele from the tester is significant. Possible interactions between the parental allele with the tester allele also have to be considered when com-paring different types of progeny. The discrepancies between QTL mapped in RILs and their TC populations could be caused by genetic effects and are easy to explain by considering the genetic components of the RILs and TC populations. Main-effect QTL effects de-tected in the TC populations represent the differential intralocus interactions between the parental alleles from the RILs and those from the respective testers—due to the segregation of alleles with additive, partial recessive-ness, intermediate gene action, or dominance—or the difference between the two heterozygous loci (Minghui63/tester–B5/tester). If a tester carries an allele that is fully dominant over the alleles carried by RILs, the corresponding QTL will not be detected in RILs but may be detected in the TC progenies. Overdominance of the RIL alleles over tester alleles can also lead to divergent results among TC progenies unless the four testers carry the same allele. The parental (Minghui 63 and B5) alleles in QTL associated with a single tester presumably have specific dominance interactions with the respective testers that do not occur with the other testers. Another possible explanation for the differ-ences between QTL mapped in RILs and TC popula-tions is the presence of epistatic effects. Twenty-nine pairs of distinct epistatic QTL were identified for six traits, and no common epistatic QTL were identified for the same trait across the RILs and the four TC progenies in this study. Hence, epistasis is very likely a major cause for the inconsistencies of QTL detection across RILs and their TC populations and is specific to the cross combination.
Cluster distribution of the main-effect QTL: In this
have also been observed in previous studies (Xionget al. 1999; Liet al. 2000). Particular attention should be given to such QTL hot spots in future studies of gene cloning and functional genomics.
Positional convergence of main-effect QTL in rice:
Traits of agronomic importance, including those in this study, are useful characters for QTL analysis in rice. A QTL associated with grain weight or length has been reported in the centromere region of rice chromosome 3 in at least 10 different inter- and intraspecific popu-lations of independent studies, suggesting that a homol-ogous gene determining seed weight or size may be associated with domestication and subsequent selection (Liet al.2004). For the seven QTL with strongest main effect (i.e.,ph1,ppp2,spp1,gpp1,gw1,gypp1, andhd6a), we explored the publicly available QTL database (http://www.gramene.org) to search their alignment QTL identified in the same chromosome region in previous studies. Forph1, the same QTL associated with plant height has been reported in six populations: CNHZAU Zh97/Ming63 RI (Cui et al.2002), Cornell 9024/LH422 RI (Xiaoet al.1996), Cornell Jef/Oruf BC (Thomsonet al.2003), IRRI Mor/CO39 (Huanget al. 1996), IRRI IR64/Azu DH (Venuprasadet al. 2002), and IRRI Lem/Teq RI QTL (Mei et al. 2003). In the vicinity ofph1, two genes associated with plant height have been identified and isolated: one is the gibberellin biosynthetic geneOsGA3ox2(Itohet al.2001) and the other is the brassinosteroid biosynthetic geneD2(Hong
et al.2003). The same QTL ofhd6a has been identified in four populations, including CNHZAU Zh97/Ming63 RI (Yuet al. 2002), IRRI IR64/Azu DH (Liet al. 2003), JRGP Nip/Kas F2(Linet al.1998), and NIAS Kosh/Kas BIL
(Yamamotoet al. 2001). One allele of the gene (Hd3a) has been cloned, which encodes a protein closely re-lated to Arabidopsis FT (Kojima et al. 2002). For five yield-related QTL (i.e.,ppp2,spp1,gpp1,gw1, andgypp1), the same QTL have been reported in the corresponding chromosome regions in 5, 9, 3, 3, and 4 populations, respectively, among total 13 populations: CNHZAU Zh97/Ming63 RI (Cui et al. 2002; Hua et al. 2002, 2003), CNHZAU Zhe97/Wuy2 (Jiang et al. 2004), CNRRI Tes/CB (Zhuanget al.1997), CNRRI Zh97B/ Mil46 RI (Zhuang et al. 2001, 2002), Cornell 9024/ LH422 RI (Xiao et al. 1996), Cornell IR64/IRG105 (Septiningsih et al. 2003), Cornell Jef/Oruf BC (Thomsonet al. 2003), HNAES MIL23/Aki RI (Yagi
et al. 2001), IGCAS ZYQ8/JX17 F2(Xuet al.1995), IRRI
Lem/Teq RI (Mei et al. 2003), IRRI Mil23/Aki RI (Nagata et al. 2002; Kobayashi et al. 2003), JRGP Nip/Kas F2 (Yamayaet al.2002), and NIAS Kosh/Kas
near isogenic lines (Obaraet al.2004). Recently, the gene
Gn1a, which produces more grains per panicle near the QTL gpp1 and encodes a cytokinin oxidase, has been cloned (Ashikari et al. 2005). The results show that these main-effect QTL have been identified in a much wider range of populations and under different
environ-ments in independent studies in rice. Correspondence in the location of QTL in different taxa suggests that some of the underlying genes are identical (Paterson
et al.1995). On the basis of the positional convergence of QTL across different populations, the structure and function of the underlying genes might be conserved across different varieties in the rice gene pool.
The data listed in Table 4 and Table 6 indicate that the genes underlying the main-effect QTL, with large effects, might determine the phenotype of the traits studied in RILs and TC hybrid populations. The effect of these QTL is more evident in modern improved varieties than in traditional varieties, indicating that the loci have been the targets of selection associated with breeding practice. The main-effect QTL detected in RILs are expressed in heterozygous F1as showed in this
report, which is an important part of the genetic basis of heterosis. The QTL are expressed in different genetic backgrounds and environments, making them valuable targets for gene manipulation and also for application in rice breeding. By comparing QTL mapped in RILs and their hybrid populations in rice, and with a publicly available QTL data reservoir, specific candidate loci will be identified to address fundamental problems in rice
TABLE 6
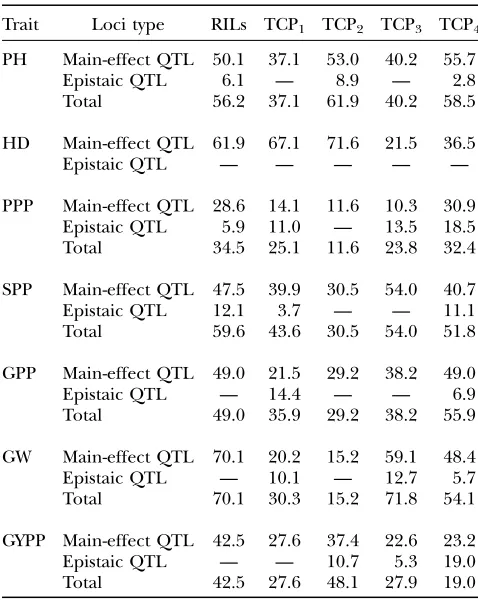
Phenotypic variance (%) for seven traits explained by main-effect QTL and epistaic QTL detected in RILs
and TC progenies
Trait Loci type RILs TCP1 TCP2 TCP3 TCP4
PH Main-effect QTL 50.1 37.1 53.0 40.2 55.7
Epistaic QTL 6.1 — 8.9 — 2.8
Total 56.2 37.1 61.9 40.2 58.5
HD Main-effect QTL 61.9 67.1 71.6 21.5 36.5
Epistaic QTL — — — — —
PPP Main-effect QTL 28.6 14.1 11.6 10.3 30.9 Epistaic QTL 5.9 11.0 — 13.5 18.5
Total 34.5 25.1 11.6 23.8 32.4
SPP Main-effect QTL 47.5 39.9 30.5 54.0 40.7
Epistaic QTL 12.1 3.7 — — 11.1
Total 59.6 43.6 30.5 54.0 51.8
GPP Main-effect QTL 49.0 21.5 29.2 38.2 49.0
Epistaic QTL — 14.4 — — 6.9
Total 49.0 35.9 29.2 38.2 55.9
GW Main-effect QTL 70.1 20.2 15.2 59.1 48.4
Epistaic QTL — 10.1 — 12.7 5.7
Total 70.1 30.3 15.2 71.8 54.1
GYPP Main-effect QTL 42.5 27.6 37.4 22.6 23.2
Epistaic QTL — — 10.7 5.3 19.0
Total 42.5 27.6 48.1 27.9 19.0
improvement. Recently, a fine mapping of a grain-weight QTL has been constructed (Liet al. 2004). Such information should be valuable for positional cloning genes underlying QTL and for marker-aided selection of QTL in rice breeding programs. As correspondence in the location of QTL exists in different taxa of grasses (Paterson et al. 1995), main-effect QTL identified in rice will be useful in other cereal crops.
Implications for genetic improvement and
marker-aided breeding of hybrid rice: In our study, the
de-tected main-effect QTL had distinct effects on both the RILs and the TC hybrids. The results indicate that the contributions of the inbred line on F1 performance
were quite stable across unrelated testers. The common main-effect QTL showing effects on multiple TC prog-enies may be associated with the general combining ability in hybrid breeding. On the other hand, a number of epistatic QTL were detected. Compared with the main-effect QTL, the effects of the epistatic QTL were relatively weak and present in some, but not all, crosses (Table 6). These cross-specific epistatic QTL are likely to be related to the special combining ability in hybrid breeding. Our findings have several implications for contemporary hybrid rice breeding. First, the elite varieties can be selected for use as restorers, as long as they carry fertility-restoring genes, and may contain a relatively high number of main-effect QTL that give large contributions to yields. Second, when a restorer line that carries the common main-effect QTL is bred, it can be used in a number of cross combinations. The direction of the contribution from the main-effect QTL of the restorer will be consistent in the cross combina-tions, according to our results. Third, to further improve the hybrid performance, the selection of the genetic background of the restorer line and the maintaining line should be seriously considered in rice breeding, since the epistatic QTL are cross combination dependent.
Since most quantitative traits of interest to plant breeders are considered to have poor heritabilities, plant breeders are more interested in the phenotypic variability among progenies of crosses between the inbred lines than in the linesper se. Breeders of hybrid crops need to improve the performance of the traits in the inbred lines and evaluate the progenies of test-crosses with unrelated testers. A crucial question in hybrid rice breeding is whether the QTL in inbred lines are stable across different testers. The identification of QTL in RILs that affect the performance of F1
popula-tions and the accurate estimation of their genetic effects, including epistasis, is essential for efficient hybrid breeding of crops. Common QTL exhibiting effect across RILs and the F1 population in this study
have also been detected in the large number of previous studies in rice. With the development of dense linkage maps based on molecular markers, marker-aided trans-fer and selection of the common QTL to improve hybrid productivity is expected to be possible. The common
main-effect QTL for each trait with the largest effects in both the RILs and different TC populations, and the chromosome regions harboring multiple main-effect QTL for different traits such as those between S1501 and C904 on chromosome 1 and between C688 and S1520 on chromosome 6, will be valuable targets in marker-aided selection for efficient hybrid rice breed-ing and functional genomic studies.
We thank S. D. Tanksley and S. McCouch of Cornell University and the Japanese Rice Genome Research Program for providing us with DNA probes. This research was supported by a grant from the National Program of High Technology Development of China.
LITERATURE CITED
Ashikari, M., H. Sakakibara, S. Lin, T. Yamamoto, T. Takashi
et al., 2005 Cytokinin oxidase regulates rice grain production.
Science309:741–745.
Bruce, A. B., 1910 The Mendelian theory of heredity and the
aug-mentation of vigor. Science32:627–628.
Causse, M., T. Fulton, Y. Cho, S. Ahn, J. Chunwongse et al.,
1994 Saturated molecular map of the rice genome based on an interspecific backcross population. Genetics138:1251– 1274.
Comstock, R. E., and H. F. Robison, 1948 The components of
ge-netic variance in populations of biparental progenies and their use in estimating the average degree of dominance. Biometrics
4:254–266.
Cui, K. H., S. Peng, Y. Xing, S. B. Yuand C. G. Xu, 2002 Molecular
dissection of relationship between seedling characteristics and seed size in rice. Acta Bot. Sin.44:702–707.
Goodnight, C. J., 1999 Epistasis and heterosis, pp. 59–67 inThe
Genetics and Exploitation of Heterosis in Crops, edited by J. G. Coors
and S. Pandey. American Society of Agronomy, Crop Science
Society of America and Soil Science Society of America, Madison, WI.
Harushima, Y., M. Yano, A. Shormura, M. Sato, T. Shimanoet al.,
1998 A high-density rice genetic linkage map with 2275 mark-ers using a single F2population. Genetics148:479–494. Hong, Z., M. Ueguchi-Tanaka, K. Umemura, S. Uozu and M.
Matsuoka, 2003 A rice brassinosteroid-deficient mutant,ebisu
dwarf(d2), is caused by a loss of function of a new member of
cytochrome P450. Plant Cell15:2900–2910.
Hua, J. P., Y. Z. Xing, C. G. Xu, X. L. Sun, S. B. Yuet al., 2002 Genetic
dissection of an elite rice hybrid revealed that heterozygotes are not always advantageous for performance. Genetics162:1885– 1895.
Hua, J. P., Y. Xing, W. Wu, C. G. Xu, X. Sunet al., 2003 Single-locus
heterotic effects and dominance by dominance interactions can adequately explain the genetic basis of heterosis in an elite rice hybrid. Proc. Natl. Acad. Sci. USA100:2574–2579.
Huang, N., B. Courtois, G. S. Khush, H. X. Lin, G. L. Wanget al.,
1996 Association of quantitative trait loci for plant height with major dwarfing genes in rice. Heredity77:130–137.
Huang, Z., G. C. He, L. Shu, X. Liand Q. F. Zhang, 2001
Iden-tification and mapping of two brown planthopper resistance genes in rice. Theor. Appl. Genet.102:929–934.
Itoh, H., M. Ueguchi-Tanaka, N. Sentoku, H. Kitano, M. Matsuoka
et al., 2001 Cloning and functional analysis of two gibberellin
3 beta-hydroxylase genes that are differently expressed during the growth of rice. Proc. Natl. Acad. Sci. USA98:8909–8914. Jiang, G. H., C. G. Xu, X. H. Li, Y. Q. He, 2004 Characterization of the
genetic basis for yield and its component traits of rice revealed by doubled haploid population. Acta Genet. Sin.31:63–72. Khush, G. S., 2001 Green revolution: the way forward. Nat. Genet.
Rev.2:815–822.
Kobayashi, S., Y. Fukuta, T. Sato, M. Osakiand G. S. Khush,
Kojima, S., Y. Takahashi, Y. Kobayashi, L. Monna, T. Sasakiet al.,
2002 Hd3a, a rice ortholog of theArabidopsis FTgene, promotes transition to flowering downstream ofHd1under short-day con-ditions. Plant Cell Physiol.43:1096–1105.
Lander, E. S., and D. Botstein, 1989 Mapping Menedelian factors
underlying quantitative traits using RFLP linkage maps. Genetics
121:185–199.
Li, J. M., M. Thomsonand S. R. McCouch, 2004 Fine mapping of a
grain-weight quantitative trait locus in pericentromeric region of rice chromsome 3. Genetics168:2187–2195.
Li, J. X., S. B. Yu, C. G. Xu, Y. F. Tan, Y. J. Gaoet al., 2000 Analyzing
quantitative trait loci for yield using a vegetatively replicated F2 population from a cross between the parents of an elite hybrid. Theor. Appl. Genet.101:248–254.
Li, Z. K., L. J. Luo, H. W. Mei, D. L. Wang, Q. Y. Shu et al.,
2001 Overdominant epistatic loci are the primary genetic basis of inbreeding depression and heterosis in rice. I. Biomass and grain yield. Genetics158:1737–1753.
Li, Z. K., S. B. Yu, H. R. Lafitte, N. Huang, B. Courtoiset al.,
2003 QTL3environment interactions in rice. I. Heading date and plant height. Theor. Appl. Genet.108:141–153.
Lin, S. Y., T. Sasakiand M. Yano, 1998 Mapping quantitative trait loci
controlling seed dormancy and heading date in rice,Oryza sativa
L., using backcross inbred Theor. Appl. Genet.96:997–1003. Lincoln, S., M. Dalyand E. Lander, 1992 Constructing genetic
maps with MAPMAKER/EXP 3.0. Whitehead Institute Technical Report, Whitehead Institute, Cambridge, MA.
Luo, L. J., Z. K. Li, H. W. Mei, Q. Y. Shu, R. Tabien et al.,
2001 Overdominant epistatic loci are the primary genetic basis of inbreeding depression and heterosis in rice. II. Grain yield components. Genetics158:1755–1771.
Lynch, M., and B. Walsh, 1998 Genetics and Analysis of Quantitative
Traits.Sinauer Associates, Sunderland, MA.
Mather, K., and J. L. Jinks, 1982 Bimetrical Genetics, Ed. 3. Chapman
& Hall, London/New York.
Mei, H. W., L. J. Luo, C. S. Ying, Y. P. Wang, X. Q. Yu et al.,
2003 Gene actions of QTLs affecting several agronomic traits resolved in a recombinant inbred rice population and two test-cross populations. Theor. Appl. Genet.107:89–101.
Murray, M. G., and W. F. Thompson, 1980 Rapid isolation of high
molecular weight plant DNA. Nucleic Acids Res.8:4321–4325. Nagata, K., Y. Fukuta, H. Shimizu, T. Yagi and T. Terao,
2002 Quantitative trait loci for sink size and ripening traits in rice (Oryza sativaL.). Breed. Sci.52:259–273.
Obara, M., T. Sato, S. Sasaki, K. Kashiba, A. Nagano et al.,
2004 Identification and characterization of a QTL on chromo-some 2 for cytosolic glutamine synthetase content and panicle number in rice. Theor. Appl. Genet.110:1–11.
Paterson, A. H., E. S. Lander, J. D. Had, S. Paterson, S. E. Lincoln
et al., 1988 Resolution of quantitative traits into Mendelian
fac-tors by using a complete linkage map of restriction fragment length polymorphisms. Nature335:721–726.
Paterson, A. H., Y. R. Lin, Z. Li, K. F. Schertz, J. F. Doebleyet al.,
1995 Convergent domestication of cereal crops by indepen-dent mutations at corresponding genetic loci. Science269:1714– 1718.
Septiningsih, E. M., J. Prasetiyono, E. Lubis, T. H. Tai, T. Tjubaryat
et al., 2003 Identification of quantitative trait loci for yield and
yield components in an advanced backcross population derived from theOryza sativavariety IR64 and the wild relativeO. rufipogon.
Theor. Appl. Genet.107:1419–1432.
Shull, G., H., 1908 The composition of a field of maize. Ann.
Breed. Assoc.4: 296–301.
Stuber, C. W., 1994 Heterosis in plant breeding. Plant Breed. Rev. 12:227–251.
Stuber, C. W., S. W. Lincoln, D. W. Wolff, T. Helentjarisand E. S.
Lander, 1992 Identification of genetic factors contributing to
heterosis in a hybrid from two elite maize inbred lines using mo-lecular markers. Genetics132:823–839.
Thomson, M. J., T. H. Tai, A. M. McClung, H. X. Lai, M. E. Hinga
et al., 2003 Mapping quantitative trait loci for yield, yield
com-ponents and morphological traits in an advanced backcross population betweenOryza rufipogonand theOryza sativacultivar Jefferson. Theor. Appl. Genet.107:479–493.
Venuprasad, R., H. E. Shashidhar, S. Hittalmaniand G. S. H ema-malini, 2002 Tagging quantitative trait loci associated with
grain yield and root morphological traits in rice (Oryza sativa
L.) under contrasting moisture regimes. Euphytica128:293–300. Wang, D. L., J. Zhu, Z. K. Liand A. H. Paterson, 1999 Mapping
QTL with epistatic effects and QTL3environment interactions by mixed model approaches. Theor. Appl. Genet.99:1255–1264. Wu, K. S., and S. D. Tanksley, 1993 Abundance polymorphism and
genetic mapping of microsatellites in rice. Mol. Gen. Genet.241:
225–235.
Xiao, J. H., J. Li, L. P. Yuanand S. D. Tanksley, 1995 Dominance is
the major genetic basis of heterosis in rice as revealed by QTL analysis using molecular markers. Genetics140:745–754. Xiao, J. H., J. M. Li, L. P. Yuan and S. D. Tanksley,
1996 Identification of QTLs affecting traits of agronomic im-portance in a recombinant inbred population derived from a subspecific rice cross. Theor. Appl. Genet.92:230–244. Xiong, L. Z., K. D. Liu, X. K. Dai, C. G. Xu and Q. F. Zhang,
1999 Identification of genetic factors controlling domestication-related traits of rice using an F2population of a cross between
Oryza sativaandO. rufipogon.Theor. Appl. Genet.98:243–251.
Xu, Y. B., Z. Shen, J. Xu, H. Zhu, Y. Chenet al., 1995 Interval
map-ping of quantitative trait loci by molecular markers in rice (Oryza
sativaL.). Sci. China Ser. C Life Sci.38:422–428.
Yagi, T., K. Nagata, Y. Fukuta, K. Tamura, I. Ashikawa et al.,
2001 QTL mapping of spikelet number in rice (Oryza sativa
L.). Breed. Sci.51:53–56.
Yamamoto, T., S. F. Taguchi, Y. Ukai, T. Sasaki and M. Yano,
2001 Mapping quantitative trait loci for days-to-heading, and culm, panicle and internode lengths in a BC1F3population using an elite rice variety, Koshihikari, as the recurrent parent. Breed. Sci.51:63–71.
Yamaya, T., M. Obara, H. Nakajima, S. Sasaki, T. Hayakawaet al.,
2002 Genetic manipulation and quantitative-trait loci mapping for nitrogen recycling in rice. J. Exp. Bot.53:917–925. Yu, S. B., J. X. Li, C. G. Xu, Y. F. Tan, Y. J. Gaoet al., 1997 Importance
of epistasis as the genetic basis of heterosis in an elite rice hybrid. Proc. Natl. Acad. Sci. USA94:9226–9231.
Yu, S. B., J. X. Li, C. G. Xu, Y. F. Tan, X. H. Li et al.,
2002 Identification of quantitative trait loci and epistatic inter-actions for plant height and heading date in rice. Theor. Appl. Genet.104:619–625.
Yuan, L. P., 1998 Hybrid rice breeding in China, pp. 27–33 in
Advances in Hybrid Rice Technology, edited by S. S. Virmani, E. A.
Siddiq and K. Muralidharan. International Rice Research
Institute, Los Ban˜ os, Philippines.
Zhuang, J. Y., H. X. Lin, J. Lu, H. R. Qian, S. Hittalmaniet al.,
1997 Analysis of QTL3environment interaction for yield com-ponents and plant height in rice. Theor. Appl. Genet.95:799– 808.
Zhuang, J. Y., Y. Y. Fan, J. L. Wu, Y. W. Xia, K. L. Zheng,
2001 Comparison of the detection of QTL for yield traits in dif-ferent generations of a rice cross using two mapping approaches. Acta Genet. Sin.28:458–464.
Zhuang, J. Y., Y. Y. Fan, Z. M. Rao, J. L. Wu, Y. W. Xia et al.,
2002 Analysis on additive effects and additive-by-additive epi-static effects of QTLs for yield traits in a recombinant inbred line population of rice. Theor. Appl. Genet.105:1137–1145.