Abstract
SREENATH, RAGHURAM MASTI. A Community-Based Rating System for Selecting Among Web Services. (Under the direction of Munindar P. Singh.)
A COMMUNITY-BASED RATING SYSTEM FOR
SELECTING AMONG WEB SERVICES
BY
RAGHURAM SREENATH
DEPARTMENT OF COMPUTER SCIENCE
NORTH CAROLINA STATE UNIVERSITY
RALEIGH, NC 27695
A THESIS SUBMITTED TO THE GRADUATE FACULTY OF NORTH CAROLINA STATE UNIVERSITY
IN PARTIAL FULFILLMENT OF THE REQUIREMENTS FOR THE DEGREE OF
MASTER OF SCIENCE
DEPARTMENT OF COMPUTER SCIENCE
RALEIGH
DECEMBER 2002
APPROVED BY:
PETER R. WURMAN MICHAEL R. YOUNG
Biography
Acknowledgments
I thank my advisor, Dr. Munindar Singh, for his constant support and inspiration. I thank my committee members, Dr. Peter Wurman and Dr. Michael Young. I thank Ashok, Vinay, Raj, Dharshan, and Srikanth for proof reading my work. A special thanks to Pınar for convincing me to switch to the Linux operating system. I would also like to thank her for all the interesting discussions we had. They bear a huge influence on the quality of this work. I thank Yathi and Amit for letting me have priority over the lab resources. I thank Subhayu for lending me his laptop for my presentation.
Table of Contents
List of Figures vii
List of Tables viii
1 Introduction 1
1.1 Applying Web Services . . . 1
1.1.1 Description of Services . . . 2
1.1.2 Discovery of Services . . . 3
1.2 Challenges . . . 3
1.2.1 Current Approaches . . . 4
1.2.2 Our Approach . . . 6
1.2.3 Implementation . . . 8
1.3 Organization . . . 11
2 Evaluation Model 13 2.1 Evaluation Cycle . . . 14
2.2 Selecting a Service . . . 15
2.2.1 Getting a List of Competing Service Providers . . . 15
2.2.2 Representation . . . 15
2.2.3 Choosing the Winner . . . 16
2.3 Rating the Service . . . 17
2.4 Evaluating the Raters . . . 17
3 Rating the Raters 19 3.1 Formal Concept Analysis . . . 19
3.2 Motivation . . . 22
3.3 Considerations While Evaluating . . . 23
3.4 Traversing the Concept Lattice for Agent Evaluation . . . 23
3.5 Handling Concepts . . . 25
3.5.2 Scenario 2: Later Stages . . . 27
3.5.3 Scenario 3: Propagation of Evaluation Through Concept Chains . . 28
3.5.4 Updating the Confidence . . . 30
4 Experiments 32 4.1 Methodology . . . 32
4.1.1 Data-sets Used . . . 32
4.1.2 Problem Formulation . . . 33
4.2 Comparison With Other Approaches . . . 35
4.2.1 Correlation-Based Approach . . . 35
4.2.2 Generalized-Learn-Relationship (G-Learn)-Based Approach . . . . 35
4.3 Results . . . 36
4.3.1 Change of Agent Ratings With Time . . . 36
4.3.2 Learning Curve . . . 38
4.3.3 Steady State Accuracy Test . . . 38
4.3.4 Ordinal Error Test . . . 39
5 Discussion 41 5.1 Related Work . . . 41
5.1.1 Content-Based Filtering . . . 42
5.1.2 Social Information Filtering . . . 42
5.2 Concept Lattice Algorithms . . . 44
5.3 Directions . . . 45
5.3.1 Bootstrapping Agents . . . 46
5.3.2 Decreasing Confidence . . . 46
5.3.3 Neighbor Selection . . . 47
5.3.4 Using the Hierarchical Classification Scheme . . . 47
List of Figures
1.1 Current web services architecture . . . 2
1.2 Propagation of queries in Gnutella . . . 5
1.3 Agent based referral system . . . 9
1.4 A sample hierarchy of categories . . . 10
2.1 Flow diagram . . . 14
3.1 Concept lattice constructed from the context in Table 3.1 . . . 21
3.2 Concept lattice constructed from the context in Table 2.1 . . . 21
3.3 Propagation of rating through concepts . . . 28
3.4 The problem of propagating ratings through concepts . . . 30
4.1 A comparison of the variation of agent ratings with time . . . 37
4.2 Time taken to reach steady state - comparison . . . 38
4.3 Steady state accuracy test - MovieLens . . . 39
List of Tables
2.1 Agents and the services they have rated . . . 15 3.1 Context of “Living Beings”. The attributes are a: needs water to live, b:
Chapter 1
Introduction
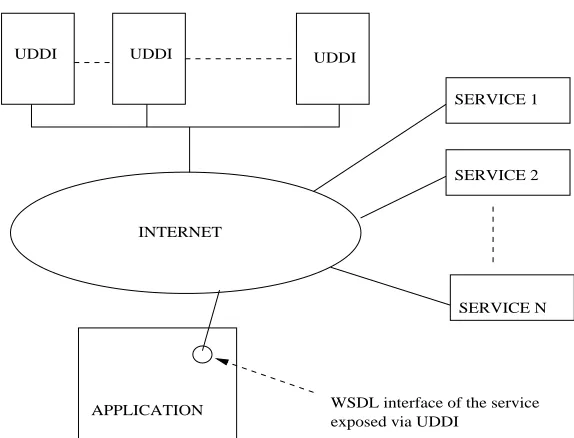
Computer applications executing on distributed systems have become popular over the past decade. Distributed system continue to grow in popularity due to the increasing need to develop reusable components that can coordinate with each other . There is a definite trend among software vendors to expose these reusable components as independent modules, referred to as services. The public interface that these services expose is usually published in a registry for the world to discover them. The more challenging aspects of choosing among competing services is either left as a problem for the user to solve or is handled in artificial ways such as issuing of certificates by trusted third parties, and advertising service attributes on popular portals.
1.1
Applying Web Services
a Web service is deployed, applications (and other Web services) can discover and invoke the deployed service.
UDDI UDDI
SERVICE 1
SERVICE 2
SERVICE N
APPLICATION WSDL interface of the service exposed via UDDI
INTERNET UDDI
Figure 1.1: Current web services architecture
1.1.1
Description of Services
The Web Service Description Language is an industry standard used to describe services [WSDL, 2002]. It includes such information as:
1. Interface description, i.e., the methods exposed.
2. Port description, i.e., its url.
1.1.2
Discovery of Services
Universal Description, Discovery and Integration is an industry standard for discovering
services [UDDI, 2002]. A database, called Business Registry, contains information about services that are registered with it. There are many such registries, which are distributed globally and synchronized periodically for consistency of data. These registries expose a search interface for the world to discover the registered services. The working of UDDI can be summarized as follows:
1. Software companies, standards bodies, and programmers volunteer to populate a business registry with descriptions of different types of services.
2. Businesses populate the registry with descriptions of the services they support.
3. Business registries assign unique ids to each service and business registration.
4. Marketplaces, search engines, and business applications query a registry to discover services at other companies.
5. Businesses use these data to facilitate easier integration with each other over the Web.
1.2
Challenges
1.2.1
Current Approaches
A few definitions are in order before we discuss popular approaches.
Definition 1 A set of people who have similar interests in services form a community.
Note that it is not necessary that everyone in the community know each other a-priori, as long as there is a mechanism for them to discover each other.
Definition 2 The set of all possible communities forms a society.
Definition 3 Consumer is a role taken on by a member of a community when he requests a service.
Definition 4 Service Provider is a role taken on by a member of a community when he provides or is willing to provide a service requested by a consumer
We now discuss some of the popular approaches that have been used to find service providers:
Reputation
Queries
Replies Peers
Figure 1.2: Propagation of queries in Gnutella
with respect to every user in the system. The extent to which an individual’s interest is represented in these ratings is proportional to the reputation of the rater himself. Although reputation systems are better in locating service providers when compared to systems with no reputation such as Kasbah [Chavez and Maes, 1996], their drawback is that they assume that one rating of a service provider fits all. This may not always be justified, especially when the service providers have multiple attributes, each of which is preferred differently by different users.
P2P
of the most successful implementation of a P2P system [2001]. It is used to share files over the Internet. The system assigns a set of neighbors to each user. When the user requests a file, a query is sent out to all of his neighbors, who in turn may forward the query to their neighbors, and so on until the requested file is found. The search process is depicted in Figure 1.2.1. The drawback of this approach is that there is no trust associated with the suggestions given by the peers. That is, there are no guarantees made on the quality of the file that was found.
Referral
A referral system is a form of P2P system. Referral systems address the problem of trust by associating a permanent identity with the peers. The peers in this case not only provide services directly, but may also refer to other peers. In this manner, they can find the right peer to provide the required service. Every peer is represented by a software agent in the referral system. These agents maintain a changing list of trusted peers of the system, which are referred to as neighbors. Whenever a service is requested, the agent asks its neighbors to help it locate the right service provider. The agent changes the ratings of its peers based on the quality of answers (replies or referrals) that they give.
1.2.2
Our Approach
Competing service providers potentially have an infinite number of attributes to advertise. It is highly likely that different users would be interested in different subsets of the possible attributes. Also, the weights that different users attach to each of the attributes would most likely be different. Let be the true representation of scores given to individual attributes of a service provider and let
be the weight attached by user to the respective attributes. The local rating (
"!
user can be given as:
"!
!
(1.1)
Equation 1.1 suggests that the rating of a service provider must be personalized for individual users. Consider Example 1.
Example 1 Suppose there are three travel agents: A, B, and C. Also, suppose that the complete list of attributes that any travel agent can advertise is: cost, reliability, speed, customer-relationship, and efficiency. Now, let there be two users, U1 and U2, that are seeking a travel agent. It is highly likely that the preference of these two users are different for the different attributes listed. User U1 might feel cost is the most important factor and not bother about customer-relationship, while user U2 might value efficiency more and not bother about cost. If there were only one rating given for any travel agent, or if a rating of only a sub-set of the complete list of attributes were available for all travel agents, it would be difficult for the users to select among these travel agents.
Personalizing the rating of a service provider for individual users would require the user to clearly indicate his preferences in terms of the weights he attaches to the attributes defining a service provider. Coming up with weights (
’s) for individual attributes is not possible for most users. This could be because they lack enough experience to give a correct estimate. Moreover, it is the overall evaluation of the service provider that is more important than the evaluation of individual attributes. A community based rating system could be used to address this problem. We could attach weights (denoted by in Equation
1.2) to the raters, so that a user can find his own true rating of the service provider, using the ratings given by other known users. If there are N agents in the community, this rating can be represented by the following equation:
"!
!
We define a community in which the consumers do not offer any service but may have (either at present or in the near future) a need for some service, and the providers do not request any service but have services to offer presumably in exchange for some material benefits which, however, are not directly modeled. Consumers query each other to find out the Quality of Service (QoS) offered by a service provider. The query is in the form of a list of service providers that a user needs to choose among, and the reply is the same list with a rating attached to each of them. This rating could be null, indicating that the person replying doesn’t know about the service provider. A consumer, when in need of a service, sends out queries to other consumers in the community. Upon receiving replies, he makes a local decision as to which service provider to select finally. In order to make this decision, the consumer should have a local rating of other consumers in the community.
1.2.3
Implementation
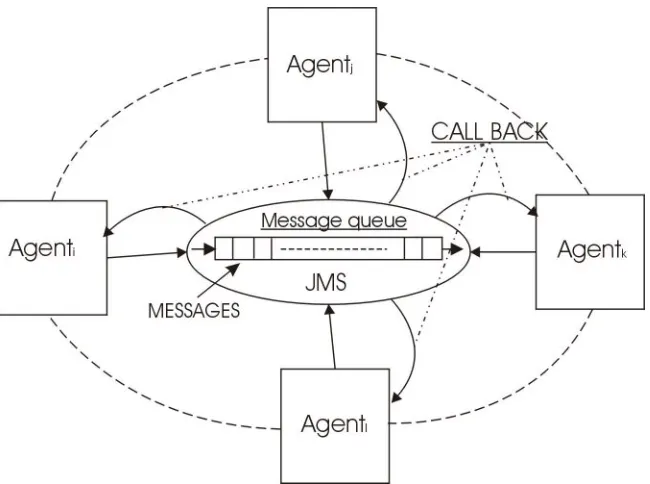
As discussed in Section 1.2.1, agent-based P2P systems could be used to rate agents in a community. Yolum and Singh show that by maintaining expertise (a vector) and socia-bility (a scalar) for each agent and by having a set of changing neighbors, we can have a schematic configuration of the society with desirable properties such as good consumer-provider proximity [2002]. The system that they define is described next.
Architecture
When an agent wants to ask a question, it sends the question to its neighbors. These neigh-bors are chosen from among its acquaintances based on a neighbor selection policy. At the other end, when an agent receives a query, it does one of the three things:
Figure 1.3: Agent based referral system
2. Not reply at all.
3. Reply with a referral (based on a local referral policy).
The agent which asks the query maintains a directed acyclic graph (DAG) capturing the communication between itself, and all the agents that the query was sent to. This avoids duplication of query messages and formation of referral loops.
Finally, when the agent receives a reply, it evaluates the reply and updates the expertise and sociability of the agent giving the reply based on this evaluation.
Extending the architecture for service appraisal
Agent X
Travel
Car−Rental Air−line
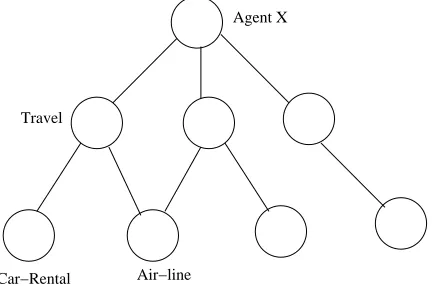
Figure 1.4: A sample hierarchy of categories
1. Represent expertise as a graph rather than a vector
Modeling expertise of an agent as a vector has the inherent danger of the number of entries in this vector growing too long. Moreover, a particular query may not always find a perfectly matching area of expertise. Conversely, an area of expertise might in itself not be definable independently i.e., there could be a hierarchical relationship between areas of expertise. For example, an expert in vehicles has to be an expert in automobiles and bikes among others. In order to solve this problem, we use a hierarchical structure (a graph) like the one shown in Figure 1.4 to maintain expertise of an agent. An area of expertise, which translates to a node in this graph, will henceforth be called category. Also, we refer to expertise as rating.
2. Use confidence to represent trust in rating
agent associates a confidence level with ratings in the model, which changes with the number of questions answered by the agent. Thus, confidence acts a measure of the level of trust an agent associates with the other agent. By taking confidence into account in calculating an agent’s rating, we have addressed the issue of trust to a certain extent.
3. Have a non-referral system
Since we are using the referral system only to appraise service provider rating and not to find service providers themselves, having neighbors give referrals would not be very meaningful. So, we modify the system so that the agents give only answers and no referrals. We now have a non-referral system with the trust issue taken care of (from the previous extension). So, we do not maintain sociability values for agents.
4. Use a concept-lattice representation to help rate raters
Correlation measurements adopted in collaborative filtering techniques help compare two users based on the common set of items that they have rated. Collaborative filtering does not allow indirect evaluations of raters. Such indirect evaluations are important since a friend of a friend could also be a friend. In order to facilitate such measurements, we have a concept-lattice representation of the users and the scores they give to service providers. This approach will be described in detail in Chapter 3.
1.3
Organization
Chapter 2
Evaluation Model
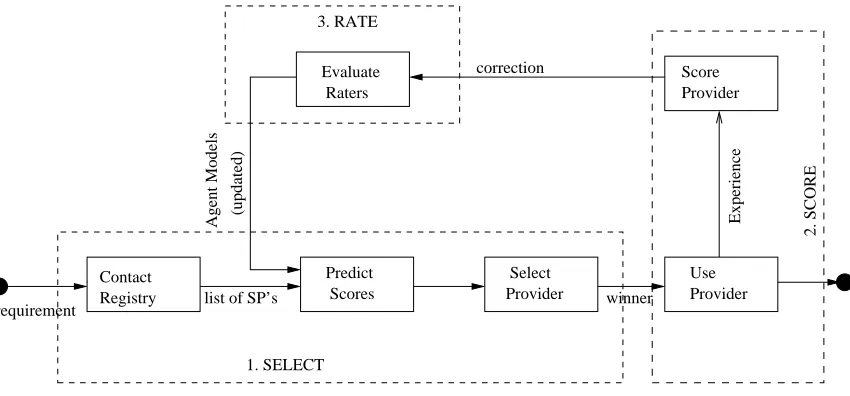
In our experiments, we iterate through a list of tasks. Each task requires an agent to find a service provider in a particular category. We refer to the agent that is trying to find a service provider as the active-agent. We adopt a three-step approach to solve the problem of selecting a service provider. The active-agent goes through these three steps in every iteration. At the end of each iteration, the agent gets to evaluate a new service provider and based on this experience, correct the weights that it associates with other agents in the community. Unless otherwise specified, represents the set of agents (users) in the community, and represents the set of service providers. The word user is sometimes
Contact Registry
Score Provider Evaluate
Raters
requirement list of SP’s
correction
Experience
(updated)
Agent Models
Provider Select Scores
Predict
Provider Use
winner
1. SELECT
2. SCORE
3. RATE
Figure 2.1: Flow diagram
2.1
Evaluation Cycle
An agent goes through the following three steps every time it wishes to use a service offered by competing service providers.
1. Select a service provider
(a) Get a list of providers for the kind of service desired.
(b) Contact raters to obtain appraisals of providers in the list.
(c) Obtain scores from raters.
(d) Evaluate scores (using the current ratings given to the raters) and choose a ser-vice provider.
2. Score the selected service
(a) Use the selected service.
3. Rate raters and adjust their ratings.
2.2
Selecting a Service
2.2.1
Getting a List of Competing Service Providers
Two approaches could be taken here:
1. A registry (such as UDDI) is queried for the kind of service desired and a list of com-peting service providers is built. This list is then sent out to all the peers, in a query message, for appraisal. The agent then collects replies and builds a representation as discussed in Section 2.2.2.
2. The type of service required is sent out to the peers and requesting them to return a list of service providers with scores attached to each of them. This approach would be useful when the requester doesn’t care as to who provides the services, as in the case of buying a book.
In our experiments we use the first approach.
2.2.2
Representation
a b c d
0.3 0.5 0.1
0.2 0.4 0.1 0.5
- 0.3 0.2 0.1
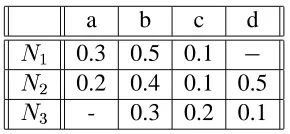
The raters and their scores are stored in a two-dimensional matrix, with the columns representing the different service providers, and the rows representing the raters. Let
,
, and
be three agents who have rated four services providers, a, b, c, and d. Not all services are rated by all agents, i.e., each agent would rate only a subset of these services. An example is shown in Table 2.1.
2.2.3
Choosing the Winner
One way of choosing the winner is by using a weighted average of the scores (weighted by the local rating of the agents giving the scores). So, the final score of a service , which
belongs to a category , is given by
! ! (2.1) Where
is the local rating of agent
in category , !
is the score given by this agent to service , is the number of agents evaluating the service and
are the agent that have evaluated the service .
The problem with Equation 2.1 is that different users have different score-ranges that they prefer while scoring, although the possible range of scores they can give remains the same. For example, a user could give a 4.0 out of 5.0 for the best service he has seen till now, while another might give a score of 5.0. Thus, a more accurate measure of the value that a user attaches to a service is the deviation of his score of the service from his average score. Hence, Equation 2.2 was used in our simulations in preference over Equation 2.1.
2.3
Rating the Service
After using the service, the user can give the true score to the service provider as follows:
1. Individual attributes of the service are scored. These are the attributes that are im-portant to the user, e.g., speed, accuracy, cost, and reliability.
2. The service is then given a score calculated as a weighted average of the individual attributes above. The score is then normalized to be in the interval [0,1] and repre-sents the true score of the service for the user.
In our simulation, we fake the actual service evaluation, by maintaining a simple table of services and their attributes. Any agent that wants to evaluate a service is returned the record corresponding to the service. How each agent weighs each of the attributes, is up to the agent (perhaps driven by a local policy).
We now move on to evaluate the agents based on our current experience.
2.4
Evaluating the Raters
The local rating ( in Equation 2.1) itself would be a function of the rating ( ) and the confidence ( ) in the rating of the agent in a category . The formula given in [Chen and
Singh, 2001] is:
(2.3)
Equation 2.3 has the following desirable properties:
1. It increases with and when the other variable is fixed.
3. It is 1 only when both and are 1.
4. It is exactly same as when is equal to 1.
A hierarchy of categories is maintained like the one shown in Figure 1.4. Every agent models its peers based on this hierarchy. This is similar to the hierarchy described in [Chen and Singh, 2001]. Each node entry is a pair
where is the rating and is the
confidence in this rating, in the corresponding category in the category hierarchy.
Our approach to calculate (rating) and (confidence) in Equation 2.3 is discussed in
Chapter 3
Rating the Raters
Before we go on to discuss our approach to evaluate the agents, a few definitions and explanations are in order.
3.1
Formal Concept Analysis
Definition 5 A triple
is called a Formal Context if and
are sets and
is a binary relation between and
. We call the element of objects, those of
attributes, and the incidence of the context
.
Definition 6 For and
, if we define:
then,
is a Formal Concept of
iff: and
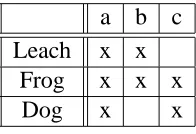
Example 2 Consider the context of “Living Beings” where ,
and is as represented in Table 3.1.
a b c
Leach x x
Frog x x x
Dog x x
Table 3.1: Context of “Living Beings”. The attributes are a: needs water to live, b: lives in water, c: lives on land.
The concepts for this context are:
1. 2. 3. 4.
These concepts, when represented as a lattice, with “subset of objects” as the ordering relation, like in Figure 3.1, is called the “Concept Lattice” of the context.
0 1 2 3
Figure 3.1: Concept lattice constructed from the context in Table 3.1
1 2 3 4 5
The following could be said about the scores given to a service provider in a concept:
1. The greater the height of the concept from which the score for a service provider was got, more the number of agents rating it, so more the confidence in the absolute score.
2. The lower the concept from which the score for a service provider is obtained, more the number of service providers being compared together (since the lattice formed by treating services as objects and agents as attributes would form a Galois connection with the lattice in Figure 3.2) and hence better the relative standing of the score.
3. The score from concepts whose height and depth are both low, i.e., concepts formed out of very few agents and very few service providers are undesirable, as nothing significant can be inferred from them. For example, if there were a service provider,
, which was evaluated by just one agent, say
, It would form a concept in itself and appear in the concept lattice of Figure 3.2 between concepts 1 and 3. Hence it would have a low depth and height (both equal to 1). In such a scenario, it would be difficult to rely on such a score. Hence such concepts could be considered for being pruned from the final evaluation lattice.
3.2
Motivation
Our motivation to do a concept-wise evaluation of the raters are as follows:
1. People seeing similar facets of the world should be evaluated together. For example, there is no point in comparing two agents, and , where has evaluated services
and has evaluated services
2. Assume all agents are “learners”. If they have seen only a small number of services, they should not be penalized or rewarded unduly.
3. What we are evaluating is the agents learning capability, so evaluate agents treating their answer space (services evaluated), as the sample space their learners are exposed to.
3.3
Considerations While Evaluating
1. Direction of traversal through the concept lattice.
2. Is the evaluated service present in the concept? If so, the distance of each agents evaluation from the “correct” evaluation.
3. Are previously evaluated agents present in the extent of the concept being currently examined?
4. What should be done if the evaluated service is not present in the intent of the concept and no previously evaluated agents are present in the extent.
The remaining of this chapter deals with the issues raised here.
3.4
Traversing the Concept Lattice for Agent Evaluation
we could handle the non-trivial (having a non-empty intent set) root concept of the sub-tree containing this concept. If, after this, all the raters have not been evaluated, we could consider all the children of the trivial root node, one at a time, till all the raters have been evaluated. The method is illustrated in Algorithm 1.
Algorithm 1 Re-Evaluate()
1: Do a breadth first search (BFS) to find a concept, say , that contains the winning service.
2: Handle concept (i.e., re-evaluate all the agents in concept ).
3: Handle the non-trivial root concept of a sub-tree containing concept .
4: If all the raters have not yet been re-evaluated, handle the children of the trivial root node, one at a time, till every agent has been re-evaluated.
Since all the agents would have been re-evaluated when the above algorithm executes, considering any other concept, that has not been handled, would be unnecessary and is ignored in our simulations.
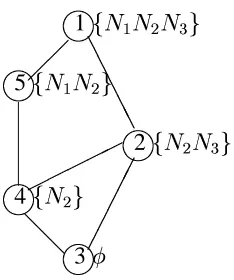
Example 3 Consider the concept lattice of Figure 3.2. Suppose that the winning service was found only in concept
. Note that this case is impossible considering the context
from which this concept is derived: Table 2.1. But, we still consider this case, just to explain the algorithm above. If the above algorithm was run on the lattice:
Step 1: The concept
is found by doing a breadth first search to find a concept that
contains the winning service.
Step 2: The Agent N2 is evaluated during the course of handling concept .
Step 3: Concept
is a non-trivial root node of a sub-tree containing
, so it
is handled next. This would result in agent N1 being included in the set of agents that have been evaluated.
Step 4: Since all the agents have not yet been evaluated (Agent N3 is still left out), the children of the trivial root concept (
would result in concept being handled, or agent N3 being evaluated.
At this time, all the agents have been evaluated and hence the algorithm stops.
3.5
Handling Concepts
The important step during evaluating raters (agents) is the way in which concepts are han-dled. The end-result is that the rating ( ) and confidence ( ) of the agents that are present
in the concept (as its extent) are somehow altered to better represent the real world.
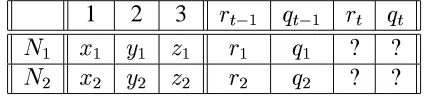
1 2 3
? ? ? ?
Table 3.2: Handling Concepts
The scenario, for a concept with two raters (
) and three rated services (
, and
), is depicted in Table 3.2. Furthermore, in order to facilitate the calculation of and
,
we could divide this into three sub scenarios as follows:
3.5.1
Scenario 1: Early Stages
During the first few iterations, the active user would not have rated enough service providers to have a row wise comparison with other users. The scenario is depicted below:
1 2 3
-In this scenario, we have a concept, which contains a service provider ( ) that has been evaluated by the active user (this e
¯valuated s¯ervice p¯rovider will be called e.s.p henceforth).
Updating the Ratings The new rating (
) depends on following:
1. The current rating (
).
2. The absolute difference between the scores given to the e.s.p by the rater and the active user.
!
!
(3.1)
We use the following equation to rate agents in this scenario:
(3.2)
The decision whether to increase or decrease the rating (
or ) in Equation 3.2 is
made by agreeing on a threshold value for the difference in rating ( ).
Normalizing
The difference in Equation 3.2 is normalized to be in the interval
. In order to prevent agent ratings from growing very large, we also normalize the rating such that
Damping
We introduce the damping factor, , in Equation 3.2 in order to damp the increase and
decrease of the rating. This damping factor should reduce the incremental value (
in Equation 3.2) at the extremities, i.e., the reduction of an already low rating, and the increase of an already high rating should be low. We use Equation 3.3, in which is a
positive constant and
is the minimum of
and . (3.3)
3.5.2
Scenario 2: Later Stages
This scenario is same as in Section 3.5.1 except that the active user has now rated enough service providers to be able to make a row-wise comparison with other agents. The consid-erations for this scenario is same as for the previous one, except that the vector similarity between the active user and the other user replaces the additive factor in Equation 3.2. There are many algorithms that calculate the correlation between vectors, the simplest among them being the mean square difference between the vectors:
. Breese et al. compare many such algorithms [1998]. The Pearson’s r-correlation with a few
exten-sions seems to have performed best. Accordingly, user ’s rating of another user
is given by: ! "! ! ! "! ! ! (3.4) Where
is the set of all service providers,
"!
refers to the score that user has
given to the provider , and
refers to the average rating of user. Note that we don’t have
to make a decision whether to add or subtract the correlation factor, since
is added or subtracted from the old rating depending on the sign of . The ratings are normalized as in Scenario 1.
3.5.3
Scenario 3: Propagation of Evaluation Through Concept Chains
An agent (rater) that is considered for evaluation satisfies at least one of the following conditions:
1. Agent is in a concept that contains the winning service in its
.
2. Agent is in a concept that has agents that have been evaluated by virtue of satisfying condition 1.
3. Agent is in a concept that has agents that have been evaluated by virtue of satisfying conditions 1 or 2 above. (Note that this is the generic case of condition 2.)
4. Agent is in a lonely concept that cannot be reached through any of the above ways. Such concepts are not handled (i.e., the agents belonging to such concepts are not evaluated).
0
1 2 3
[N2,N3]
[N1,N2] [N3,N4] [N1,N2,N3,N4]
1 N2 2 N3 3
In order to facilitate indirect evaluation of raters (to find friends of friends), we have to find a way of propagating rating and confidence through concepts. Consider the concept lattice in Figure 3.3. In this lattice, if concept 1 contained the active agent (letting a direct evaluation of the agents in this concept), then the ratings (and confidence) would have to propagate to concept 2 through N2, and to concept 3 through N3, via concept 2. The propagation graph is shown in the same figure.
1 2 3
? ? ? ?
In this scenario, we have a concept in which one of the raters has already been evaluated, perhaps in a previously handled concept. We have to somehow find a way of propagating this new rating and confidence to the other agents in this concept. One such scenario, with the propagating agent being
, is shown in the table above.
Updating the Ratings The new rating (
) depends on the following:
1. The current rating (
).
2. The vector distance of the rater’s rating and the linking rater’s rating (
).
3. The vector distance between the active agent and linking agent (
).
4. The distance between the previous and current rating of the linking rater ( ).
d1
d2 d1 + d2
t t+1 Time Attribute−1
active−agent preference
linking−agent preference
evaluated−agent’s preference
− linking−agent rating − evaluated−agent rating
Rating
Attribute−2 l
?
Figure 3.4: The problem of propagating ratings through concepts
The formula used to calculate the new rating is given in Equation 3.5. Here, is a
constant.
(3.5)
In Equation 3.5, is the damping factor calculated as in Equation 3.3.
3.5.4
Updating the Confidence
We use a generic formula to update the confidence in rating ( in Equation 2.3) in all the
scenarios discussed in Section 3.5. In general, we believe that the confidence in rating must go up after every evaluation of the agent, irrespective of whether or not the rating of the agent itself was increased. The case when confidence goes down (e.g., when an agent behaves erratically) could be a possibility in a real life scenario. But, we do not explore this research direction in our work.
The requirement for the value of confidence is summarized below:
2. Confidence is initialized to a low value and is incremented every time there is a chance to evaluate the agent.
3. The amount by which the confidence is increased during every iteration depends on the degree of indirection while evaluating the agent’s rating, i.e., the incremental value decreases with the propagation length of the ratings. For example, in Fig-ure 3.3, the amount by which the confidence in the rating of N4 is increased should be less than the amount by which the confidence in the rating of N3 is increased, which in turn should be less than the amount by which the confidence in the rating of N2 is increased.
The equation used was:
(3.6)
In Equation 3.6,
is the damping factor, which is set to be equal to the reciprocal of the sum of the confidences associated with every category of the agent being evaluated —
Chapter 4
Experiments
This chapter describes an experimental setup to test the key aspects of our proposal. Al-though implementing the entire architecture described in this thesis is not the goal, we have identified the key differentiators of our approach with respect to the literature. We describe a methodology to see these key differentiators in action and define a set of metrics with which to measure them.
4.1
Methodology
4.1.1
Data-sets Used
We evaluate our work with respect to two data-sets.
1. MovieLens database
evaluation process from ambiguities inherent in human perceptions. Although the user’s ratings are not completely random, we require a better prediction of the truth values (the actual value of the provider to a user) in order to evaluate our approach. However, evaluating our approach (and comparing it with other approaches) against this database, helps us visualize the performance of our approach under presumed varying interests of the users.
2. Artificial database
Due to reasons cited above we also evaluate our work against an artificially created database. In this database we have three categories of services: travel, car-rental, and airline. The travel service forms the parent category for the other two services. Each service has five service providers. Each service provider is assigned different values for five arbitrarily chosen attributes: cost, speed, accuracy, public-relations, and availability. We define ten user profiles, wherein each profile contains weights associated with each of the five attributes.
4.1.2
Problem Formulation
Given
During every round of simulation, we maintain the following:
1. The truth matrix,
, which contains the real ratings of the Users vs. Items.
2. The prediction matrix,
, which is a matrix of predictions made by our algorithm.
3. The observation matrix,
. This matrix in general satisfies
"! "!
for every pair
that has been observed, and
"!
otherwise. Initially,
4. A list of tasks, , that the active agent has to perform. Each entry in this list can be thought of as a six tuple, active-agent, requested-category, done, winning-provider,
predicted-score, actual-score . The first two fields are filled in by the simulator and
the last three fields are filled in by the agent, depending on whether or not it is able to complete the task (thus setting the done field to either true or false. The truth matrix,
, is used to help the agent fill the actual-score field.
During every iteration, a task is handed over to the agent. If the task is completed successfully (the done field is true in this case), the predicted-score is entered into the prediction matrix,
, and the actual-score is entered into the observation matrix,
. The experiment terminates when all the tasks are completed or a predefined time-out is reached.
Observation
During the simulation, we observe the following:
1. Variation of errors with time Error value of the prediction,
"!
"!
, at the end of or each iteration, , is noted for
to . Where is the number of tasks given to the system.
2. Variation of agent ratings with time
For every user,, of the system, the active user’s rating of this user,
, at the end of each iteration, , is noted for
to . Where is the number of tasks given to the
4.2
Comparison With Other Approaches
Our approach is compared with two other popular approaches. These approaches can pre-dict a winning service provider and evaluate the raters, thus providing alternate means of carrying out the functionality depicted by the first and the last block of the flow diagram shown in Figure 2.1. These approaches are described briefly in the following sections:
4.2.1
Correlation-Based Approach
In this approach, a user’s rating of any other user of the system is based on the correlation between the ratings of the two users. Pearson’s correlation factor is used to measure the correlation between two users. The actual formula is given in Equation 3.4. The difference between the correlation based approach and the way Pearson’s correlation is used in our approach is that in the former approach, the time of recording of the score is immaterial, i.e., a correlation is calculated based on all the scores given by the two users till now. In our approach, we use the correlation factor only for the current iteration. It is only used to find the similarity in scores given by any two users in the current iteration.
While making a prediction, a weighted average of the scores given by the agents (weighted by their correlation with the active user) is computed for each competing ser-vice provider. The provider with the highest score is declared as the winner.
4.2.2
Generalized-Learn-Relationship (G-Learn)-Based Approach
from their true value. Let denote the range of values in (the truth matrix). Also for any , let
denote the set of prediction values that are permissible when the correct value is
. A prediction is made as follows:
"! if !! #"$
(a constant) otherwise
(4.1)
After knowing the true value (the second step in the three step approach described in Section 2.1), the weights are updated as follows:
&% if ! ! ) % if ! ! ) (4.2)
4.3
Results
4.3.1
Change of Agent Ratings With Time
The three approaches compared - Correlation, GLearn, and Concept - adopt different strate-gies to update agent ratings. We test each approach against the artificial database in order see the way the ratings vary with time. The artificial database was preferred to the Movie-Lens database, since we have an accurate representation of the true value of a service to the user (programmatically computed from the user preferences) as opposed to the approx-imate true value in the case of MovieLens (since the ratings are given by real users). The active-agent field in all the tasks is kept the same, since we are only interested in one active
0 0.2 0.4 0.6 0.8 1
0 5 10 15 20 25 30 35 40
Agent Rating Time best-neighbor 0 0.2 0.4 0.6 0.8 1
0 5 10 15 20 25 30 35 40
Agent Rating Time worst-neighbor 0 0.2 0.4 0.6 0.8 1
0 5 10 15 20 25 30 35 40
Agent Rating Time average neighbor Correlation GLearn Concept
Figure 4.1: A comparison of the variation of agent ratings with time
the three approaches is compared in Figure 4.1. The figure compares the change in ratings of three neighbors of the active user bestneighbor, worstneighbor, averageneighbor -in each of the three approaches. The preferences of the best-neighbor was set exactly the same as the active user. All the neighbors were arranged in an increasing order of the root-mean square difference (
4.3.2
Learning Curve
0 0.2 0.4 0.6 0.8 1
2 4 6 8 10 12 14 16 18 20
Absolute Error
Time
Concept Correlation GLearn
Figure 4.2: Time taken to reach steady state - comparison
In order to compare the three approaches based on the time they take to reach the steady state (after which their prediction accuracy remains almost constant), we initialize the active user with a null observation matrix and let him predict the scores of service providers in a chosen category. Thus the setup is similar to the previous one except that we now have the category field fixed in all the tasks. From the graph in Figure 4.2 we see that the concept based approach converges slightly faster than the other two approaches towards the steady state. Also, the absolute error made in the concept based approach is lower than the error in the other two approaches (for the artificial database).
4.3.3
Steady State Accuracy Test
0 10 20 30 40 50 60 70
-4 -2 0 2 4
Number Of Errors
Error Value Correlation 0 10 20 30 40 50 60 70
-4 -2 0 2 4
Number Of Errors
Error Value G-Learn 0 10 20 30 40 50 60 70
-4 -2 0 2 4
Number Of Errors
Error Value Concept
Figure 4.3: Steady state accuracy test - MovieLens
represent the real-world, the MovieLens database was chosen in this case. All the active agents were initialized with 70% of the Truth matrix (
).
4.3.4
Ordinal Error Test
In the steady state accuracy test, we record the error value of prediction irrespective of the quality of prediction. That is, we measure the error value whether or not the winning service provider was indeed the right choice. In order to measure the quality of the choice itself, we define a value called the ordinal error. This value is simply the rank of the winning service provider among the list of service providers considered in the current iteration, with respect to the active user. Note that we can measure this value since we have access to the truth matrix (
0 5 10 15 20 25 30 35 40 45 50
0 5 10 15 20
Number of predictions
Ordinal Error Correlation 0 5 10 15 20 25 30 35 40 45 50
0 5 10 15 20
Number of predictions
Ordinal Error G-Learn 0 5 10 15 20 25 30 35 40 45 50
0 5 10 15 20
Number of predictions
Ordinal Error Concept
Figure 4.4: Ordinal error test - MovieLens
of the ordinal errors made in the three approaches is shown in Figure 4.4. The sum of the number of predictions with ordinal errors one, two, and three was computed for each approach. It was learnt that the performance of the GLearn predictor was better than the Concept-based predictor, which in turn was better than the Correlation-based predictor.
Chapter 5
Discussion
In this chapter, we describe literature that is related to our work. We also describe two important concept lattice algorithms that we had to implement in our approach. We end the chapter with a discussion of the extensions that could be made to our work.
5.1
Related Work
5.1.1
Content-Based Filtering
The most well-known techniques of content-based filtering is keyword-based search such as the one adopted by search engines like Google. Primitive QoS-based filtering could be introduced for keyword searches, by identifying the right keywords for search and com-bining them with boolean operations such as
,
, and
. Techniques such as term frequency-inverse document frequency (TF-IDF) are based on the view that the least frequently occurring words and the number of times such words appear in a document are the most likely factors that decide the relevance of a document. Latent Semantic Indexing (LSI) is a popular approach used to minimize the adverse effects of synonyms (many words used to convey the same meaning) and polysems (one word having many meanings) in a query based search [Dumais et al., 1988]. TF-IDF and LSI, along with techniques to mea-sure correlation of the query with a document, such as the vector similarity meamea-surements, aid the content-based filtering approach.
5.1.2
Social Information Filtering
Social information filtering refers to the generic technique of selecting articles based on relationships between people and on their subjective judgments. Such filtering, in general, could be for an individual or for a group. Placing an author in the “preferred list” is a crude example. Collaborative filtering [Goldberg et al., 1992] is a form of social information filtering in which people collaborate to help one another to perform filtering by recording their reactions to services they use (e.g., rating documents read).
Implicit vs. explicit voting
Implicit voting involves estimating the user’s preferences without the user having to explic-itly express his rating, by observing patterns like: purchase history, browsing pattern, and the amount of time spent reading an article. As opposed to this, in explicit voting systems, such as GroupLens [Resnick et al., 1994] and Ringo [Shardanand and Maes, 1995], the user rates the service he uses (in this case, the articles that he reads) on a scale of 1 to 5 and 1 to 7 respectively.
Memory-based vs. model-based approaches
Offline vs. online filtering
The methods described above are offline filtering methods. These methods make use of a matrix representing a record of the history of the users of the system. This matrix is used to make predictions for the users. As opposed to this approach, online filtering methods treats the prediction process as one that is continuous and interactive. They make use of a mistake-bound model that has a learner that corrects itself after each iteration. Thus there is more personalizing of the recommender. The theoretical framework for one of the popular approaches, called the Weighted Majority Algorithm is discussed in [Little-stone and Warmuth, 1994]. The idea here is to attach weights to individual algorithms in a pool of algorithms called expert predictors. These algorithms make binary predictions (yes/no) given an instance of the problem. The master algorithm, calculates a weighted majority of these predictions and comes up with its own binary prediction. If the predic-tion is wrong, the master algorithm reduces the weights attached to all the algorithms that predicted wrong. This generic WMA can be used to predict user preferences treating the ratings of other users as the ratings by various algorithms, and the “learner” as the master algorithm that learns how much weight to attach to each of the users. This approach for a binary prediction is discussed in [Goldman and Warmuth]. Generalized versions of this learning algorithm, for a range of ratings (not just binary), is discussed in [Nakamura and Abe, 1998] and [Delgado and Naohiro, 1999].
5.2
Concept Lattice Algorithms
Identifying Concepts
The algorithm given in [Ganter and Wille, 1999] was used to get a list of all concept extents of a context
and is shown in Algorithm 2.
Algorithm 2 Get-Concepts()
1: The extent is entered into the list. Then we carry out the following for each attribute
(the attributes are processed in an arbitrary order.
2: For each set A, entered into the list in an earlier step, we form the set
and
include it into the list, provided it is not yet contained within it.
Building the Concept Lattice
Once the concepts are identified, a lattice has to be built from them (capturing the parent-child relationship). A fast algorithm to build concept lattice described in [Nourine and Raynaud, 1999] was considered, but was given up in preference to a “dog-work” algorithm, for the sake of simplicity. The algorithm that was adopted is shown in Algorithm 3
Algorithm 3 Build-Lattice()
1: Place each concept in the list of concepts in a bucket representing the size of the extent.
2: For each concept in a bucket representing size , add all the concepts in buckets
repre-senting size
or higher to its parent list.
3: For each concept, remove concepts that are found in the parent list of any other concept that is a parent of the concept under consideration.
5.3
Directions
5.3.1
Bootstrapping Agents
One of the important problems in a real-life community is accomodating a new user. This would translate to bootstrapping the agent that represents this user in the community. In our experiments, we assume that an observation matrix is available for every agent in order to bootstrap the agent. This matrix is not very useful unless there is a row representing the active user, i.e., the observation matrix cannot be used to bootstrap the agent unless there is standard of comparison (which in our approach is the active user’s row) is available to evaluate the raters. We could measure the deviation of a user rating of a service provider from the average rating. But, this would not be a personalized rating of the rater. A hybrid system — a mix of reputation and referral systems — could be considered in this case.
5.3.2
Decreasing Confidence
5.3.3
Neighbor Selection
In our experiments, we maintain a list of ten neighbors and evaluate twenty raters during every iteration, i.e., the score table contains ratings given by atmost twenty raters. At the end of the iteration, we update the list of neighbors to contain the top ten raters. This list is used to make sure that the scores given by any of the neighbors is retained while building the score table during the next iteration. The number of neighbors maintained and the number of raters chosen during every iteration could influence the quality of decision and should be typically driven by a local policy described by the user.
5.3.4
Using the Hierarchical Classification Scheme
Bibliography
K. Suzanne Barber and Joonoo Kim. Belief revision process based on trust: Agents evalu-ating reputation of information sources. In R. Falcone, M. Singh, and Y.-H. Tan, editors, Trust in Cyber-societies, LNAI 2246, pages 73–82. Springer-Verlag, 2001.
Chumki Basu, Haym Hirsh, and William W. Cohen. Recommendation as classification: Using social and content-based information in recommendation. In Proceedings of the 15th National Conference on Artificial Intelligence, pages 714–720, 1998. URL
http://citeseer.nj.nec.com/basu98recommendation.html.
Daniel Billsus and Michael J. Pazzani. Learning collaborative information fil-ters. In Proceedings of the 15th International Conference on Machine Learn-ing, pages 46–54. Morgan Kaufmann, San Francisco, CA, 1998. URL
http://citeseer.nj.nec.com/billsus98learning.html.
John S. Breese, David Heckerman, and Carl Kadie. Empirical analysis of pre-dictive algorithms for collaborative filtering. In Proceedings of the 14th Annual Conference on Uncertainty in Artificial Intelligence, pages 43–52, 1998. URL
Anthony Chavez and Pattie Maes. Kasbah: An agent marketplace for buy-ing and sellbuy-ing goods. In First International Conference on the Practi-cal Application of Intelligent Agents and Multi-Agent Technology (PAAM’96),
pages 75–90, London, UK, 1996. Practical Application Company. URL
http://citeseer.nj.nec.com/chavez96kasbah.html.
Mao Chen and Jaswinder Pal Singh. Computing and using reputations for Inter-net ratings. In Proceedings of the 3rd ACM Conference on Electronic Com-merce, pages 154–162. ACM Press, 2001. ISBN 1-58113-387-1. URL
http://doi.acm.org/10.1145/501158.501175.
Joaquin Delgado and Ishii Naohiro. Memory-based weighted majority prediction for recommender systems, 1999. URL
http://citeseer.nj.nec.com/delgado99memorybased.html.
Susan T. Dumais, George W. Furnas, Thomas K. Landauer, Scott Deerwester, and Richard Harshman. Using latent semantic analysis to improve access to textual information. In Proceedings of the Conference on Human Factors in Computing Systems CHI’88, 1988.
URLhttp://citeseer.nj.nec.com/dumais88using.html.
Epinions. Home page, 2002. http://www.epinions.com.
Bernhard Ganter and Rudolf Wille, editors. Formal Concept Analysis. Springer, Berlin, 1999. ISBN 3-540-62771-5.
Gnutella. Home page, 2001. http://gnutella.wego.com.
filtering to weave an information tapestry. Communications of the ACM, 35(12):61–70, 1992.
Sally A. Goldman and Manfred K. Warmuth. Learning binary relations using weighted ma-jority voting. In Proceedings of the 6th Annual Conference on Computational Learning Theory, pages 453–462. ACM Press. ISBN 0-89791-611-5.
Nick Littlestone and Manfred K. Warmuth. The weighted majority algo-rithm. In Information and Computation, 108(2), pages 212–261, 1994. URL
http://citeseer.nj.nec.com/littlestone92weighted.html.
MovieLens. Home page, 2002. http://movielens.umn.edu.
Atsuyoshi Nakamura and Naoki Abe. Collaborative filtering using weighted majority pre-diction algorithms. In Proceedings of the 15th International Conference on Machine Learning, pages 395–403. Morgan Kaufman, 1998.
Lhouari Nourine and Olivier Raynaud. A fast algorithm for building lattices. Information Processing Letters, 71(5-6):199–204, 1999. ISSN 0020-0190.
Paul Resnick, Neophytos Iacovou, Mitesh Suchak, Peter Bergstorm, and John Riedl. Grouplens: An open architecture for collaborative filtering of netnews. In Proceedings of the 1994 ACM Conference on Computer Supported Cooper-ative Work, pages 175–186, Chapel Hill, North Carolina, 1994. ACM. URL
http://citeseer.nj.nec.com/resnick94grouplens.html.
automating “word of mouth”. In Proceedings of ACM CHI Conference on Hu-man Factors in Computing Systems, volume 1, pages 210–217, 1995. URL
http://citeseer.nj.nec.com/shardanand95social.html.
UDDI. Universal Discription Discovery and Integration, 2002. http://www.uddi.org.
WSDL. Web Services Description Language, 2002. http://www.w3.org/TR/wsdl.
Pınar Yolum and Munindar P. Singh. An agent-based approach for trustworthy service location. In Proceedings of the 1st Workshop on Agents and Peer-to-Peer Computing (AP2PC). Springer, 2002. To appear.
Giorgos Zacharia, Alexandros Moukas, and Pattie Maes. Collaborative rep-utation mechanisms in electronic marketplaces. In Proceedings of the 32nd Hawaii International Conference on System Sciences, 1999. URL