CFD SIMULATION OF OPTICAL OBSCURATION DUE TO FIRE IN
ENCLOSURE
Pavan K. Sharma
Reactor Safety Division, Bhabha Atomic Research Centre, Mumbai, INDIA-400085 E-mail of corresponding author: [email protected]
ABSTRACT
In order to ensure safety of Nuclear Power Plants (NPPs) in the event of occurrence of a fire, the fire modelling is often recommended in the fire safety guides prepared by the national regulatory bodies. The analytical simulation of fire propagation and validation of the physics of several processes involved while using them for application to NPPs. Limited work has been done to validate the capability to predict optical density in the smoke laden fire atmosphere for most of the fire model. In present paper four full-scale experiments from open literature were simulated in a CFD code to evaluate this predictive capability. These four scenarios are: a propane burner in a small enclosure, a hospital bed in a large room, a wood stack fire and solid polyutherene fire in enclosure. The analysis has been carried out with the correct value of the grid size based on earlier experiences. The predicted visibility of the four scenarios at top corner of the enclosures by the current analysis is compared against the earlier reported experimental data and our own earlier prediction. from a zone model based code. The CFD results are much improved over the zone model based predicts with similar assumptions in input and fire scenario simplification. The studies have extended the utility of field model based tools to model the particular useful separate effect aspect like predicting visibility conditions for fire and validate against experimental data. The present study have several applications in such as conventional room fires, fire in nuclear reactor containment, post fire accident management, identifying fire escape route, visibility in tunnel and designing fire exit sign etc.
INTRODUCTION
developed in recent years. Fire Dynamics Simulator (FDS) [16] and Smart Fire [17] are popular special-purpose software, and CFX [18], FLUENT [19] and PHOENICS [20] are among the popular general-purpose CFD software. This study took one of the special-purpose CFD software packages, FDS [21], as an example, to investigate the feasibility of using this program and for validation for the visibility reduction due to fire in an enclosure. RANS CFD packages [22] [23] [24] [25] however, are quite commonly used in field modeling of fire phenomena. The main criticism leveled at the RANS approach targets the validity of the turbulence models employed to provide closure to the governing equation set. These turbulence models contain empirically determined parameters that can only be considered applicable for the specific flow cases where they have been validated. This narrows the range of validity for the RANS CFD approach. Large Eddy Simulation (LES) is a branch of Computational Fluid Dynamics (CFD). It differs from other CFD approaches, in that LES explicitly calculates the large-scale turbulent flow structures from first principles. The small-scale turbulent motion not calculated directly from the governing equations has its influence on the resolved flow field modeled. The simplest and most common form of SGS turbulence model used in LES is the Smagorinsky model [26] [27]. This is the default SGS model used in the FDS fire code. The Smagorinsky model uses the eddy viscosity approach to quantify the stresses that the turbulent velocity fluctuations place on the mean flow. In this modeling approach, the Reynolds stresses are assumed to relate to the local mean velocity gradient. The present work has been carried out using the code FDS. The code FDS have been extensively validated using salt water modeling experiments[28,29], gravity current modeling [30,31,32], isolated plumes[33,34,35,36], buoyant plume in cross flow [37], enclosure fire dynamics [38,39,40] and by qualitative observations in above mentioned studies. A detailed systematic validation exercise for the FDS hydrodynamic model can be found in reference [43]. Authors have also used the validated tool for various applications in nuclear industry [42]. The aim of present paper is to study the corner fire characteristics in a compartment which have been an area of keen interest worldwide. Numerical prediction of above situations has been compared with the experimental and numerical results available from open literature. Simulations have been carried with finer grid sizes based on our earlier studies [43].
FIRE DYNAMICS SIMULATOR (FDS)
Fire Dynamics Simulator (FDS) is a field model based software developed by NIST (USA) and has built-in dedicated computational fluid dynamics (CFD) model to describe and analyses fire in multiple compartment geometries. The code solves numerically the set of governing equations of mass, momentum (Navier-Stroke) and energy conservation appropriate for low-speed, thermally-driven flows of multispecies gas mixture to describe the smoke and heat transport arising from fires. In this paper, Smagorinsky sub-grid model [26,27] was used in the fire-enclosure to get the fire generated three-dimensional flow field. The basic set of equations for conservation of mass, momentum and energy respectively [16]: The details of formulation of the equations and the choice of numerical algorithm available are contained in a companion document, called Fire Dynamics Simulator – User and Mathematical Reference Guide [16].
Visibility Modeling in Fire Modeling Codes
Among the current national and international fire design guidelines and regulations, the NFPA “Standards for smoke detection and management systems in malls, atria and large spaces” (NFPA, 2005)[45] are widely referred. The output from the analytical fire models consists of gas layer temperatures, concentration of oxygen, carbon dioxides, velocity etc. based on the solution of the conservation equations. Certain transformation models have been employed that used the output from the conservation equations and calculate the smoke density, optical density and visibility parameters. The generation of combustion products in fires is generally associated with a reduction in visibility. The smoke yield of the fire is expressed in terms of obscuration potential per gram of material burned. The opaque portion of the products reduces visibility by light absorption and scattering, letting only a certain fraction of light to pass through. Various researchers have utilised approaches based on correlations in terms of oxygen depletion, mass fraction of combustion products, temperature rise etc. to calculate the optical density. The optical density D of smoke is defined as D=log(I0/I)/l. Where, I0 is the initial intensity of the light and I is the final
intensity of the light passing through the smoke layer of thickness l. The fraction of the light passing through the
smoke layer is expressed by Beer Lambert law: (I0/I)=e(-K.ll. Here, K is the extinction coefficient (m-1), which is the
function of a mass concentration of smoke, Cs. The optical density per unit optical path length can then be expressed
as D/L=KmρYs. Where, Ys is in Kg/m3 and Km is the specific extinction coefficient of smoke or particle optical
density (m2/Kg).
For an open system , the smoke mass concentration takes the form Cs=YsGf/VT Where, Ys is Yield of
rate of the mixture of fire product D/l=ξ. YsGf/VT = DmassGf/VT. The value of parameter Dmass(m2/g) called mass
optical density, is given in standard handbooks for different materials or need to be obtained experimentally. The ratio Gf/VT is approximated by the fact that the amount of fuel involved in the generation of smoke within the
control volume is directly proportional to the amount of oxygen consumed neglecting the amount of unburned fuel. Let Y0 denote the local mass fraction of oxygen, Y∞ is the mass fraction in undisturbed air and r0 is the
stoichiometric oxygen to fuel ratio. The optical density can be expressed as D= Dmassρ( Y0- Y∞).l/r0. The equation of
the optical density can alternatively be formulated in terms of local mass fraction of combustion products rather than the mass fraction of the oxygen.Various experiments have shown a constant ratio between the optical density and the temperature rise in the gas. Evans and Stroup [Soren et al., (1997)[46]] have reported a model to use smoke temperature as a measure of smoke density that takes into account the individual properties of the different fuel.
D/∇T=3330.ρ CP Ys/Q. Where Q is the convective heat release rate per Kg fuel burnt.
The optical density can also be expressed in terms of extinction coefficient, which is defined as K= 1/l*ln(I0/I). The difference between the extinction coefficient, k, and the optical density, D, is the use of natural
lgorithms and logarithms with the base 10. K=2.303 X D
Model Used in Zone Model Based (BRANZFIRE)
In code BRANZFIRE (BRANZFIRE 99.)[47] the following approach has been utilised.
Average extinction coefficient , Kavg=KmCsoot with Csoot=Ysootρ∞T∞/Tu. Where, Ysoot is yield of smoke, T∞=
Ambient temperature, Tu =Upper layer temperature, ρ∞ =Ambient density and Km particle extinction cross section
(m2/ kg soot), given by Beyler for flaming combustion as K
m=10750exp(1-4.95Ysoot).
The maximum distance an observer can recognise an object, usually an exit sign, when viewing the object through smoke is by Beyler defined as the visibility, V,. He states that it has been widely found that the product VKavg is a constant for a given object and lighting condition. The model uses a value of 2 for reflective sign and 5
for illuminated sign.
Model Used in CFD code Fire Dynamics Simulator (16)
The intensity of monochromatic light passing a distance L through smoke is attenuated according to (I0/I)=e(-K.L). The light extinction coefficient, K, is a product of the density of smoke particulate, ρYs, and a mass
specific extinction coefficient that is fuel dependent K = KmρYs Estimates of visibility through smoke can be made
by using the equation (S =C/K) where C is a non-dimensional constant characteristic of the type of object being viewed through the smoke, i.e. C = 8 for a light-emitting sign and C = 3 for a light-reflecting sign (Jin (1978))[48]; Mulholland, (2000)[49]. Since K varies from point to point in the domain, the visibility S does as well. This get converted into quantity Optical density via K/2.3 (D= K log10 e)
Other Alternative Route for Visibility in CFD
From CFD calculations we get also estimate smoke layer height by using some simple calculation -quantity. The critical time tcrit to describe a typical exit sign fading to the smoke, The critical time tcrit gives us the
visibility V in meters, which is the same as the path length, if whole path is along smoke layer. The more details about the approach and the related validation study is available in Rinne et al., (2007)[50].
CASE STUDIES FOR VALIDATION
The four full-scale experiments that have been simulated with CFD are a hospital bed in a large enclosure (Hans Hultquist, 2000)[51], a propane burner in a small enclosure (Gandhi, 1994[52], Hans Hultquist, 2000)[51], wood-stack fire in enclosure linked to staircase and polyurethane fire in enclosure. The test configurations, test data from these experiments and assumptions made while modelling these experiments are presented in the following sections. Soot yield values are used in all the simulations are taken from Tewarson (2002)[53].
Hospital Bed in Large Enclosure: This experiment consists of a typical Swedish hospital bed (made of polyester) in a 5.6 X 5.6 X 6 m (Length X Width X Height) enclosure. The material in all the walls, the ceiling and the floor
was concrete. The only connection to the outside was a small opening, 0.4X0.2 m (Width X Height), down by the
floor. The actual heat release rate of the single hospital bed is about 1.1 MW based on the amount of polyurethane (45 Kg) for a dimension of 1mX2m given by Yii (2000)[54] .
kW for the first eight minutes and then increased to 160 kW . A composite material was mounted on the walls. However, this composite material didn’t contribute very much to the flame spread and the heat release (Gandhi, 1994)[52] and hence effect of wall combustible material has not been modeled in the present study for flame spread the approximation that there is only propane burning is made.
Wood-Stack Fire in Enclosure Linked to Staircase:The fuel is a stack of wood-strips (pine) with a total weight of 100 kg. The enclosure in which the fire is present is of size 4.2 X 2.8 X 2.6 m (Length X Width X Height) with a 0.8 X 2.1 m doorway leading to the staircase. There are four stories in the staircase, floor 0 at ground level and floor 3
at top level. The experimental value of the optical density, here given as OD, is measured at floor 2 in the staircase.
In the simulation the available heat release rate from naturally ventilated wooden crib fire test in the “blasted rock tunnel” has been used [Carvel, 2004][55].
Polyurethane fire in enclosure:The enclosure in which the fire is present is of size 2.5 X 2.5 X 2.5 m (Length X
Width X Height) with a 0.2 X 0.2 m slit leading to the atmosphere. The fire source consisted of one piece of
polyurethane foam. From the DELTA experiment it was assumed that the heat release rate increased linearly from 0 kW at t=0 to 2.0 kW at t=80 seconds . The perforated suspended ceiling of the experiments is assumed to be absent in this simulation.
COMPUTATIONAL DETAILS
FDS was used as a tool to calculate the temperature field generated by the burner inside the room. The model used in this study does not incorporate fire spread, and the experiments also did not result in flame spread on the linings, which were non-combustible. Wall was modeled as heat conducting media using conjugate heat transfer approach. For this, the computational domain was made up of the indoor gas domain, 0.1m-thick ceiling, 0.1m-thick walls and 0.1m-deep solid floor. In this case, the computational domain and the boundary were extended to the exterior wall surface to take into account the heat transfer into the wall. FDS solves the radiation Transport equation (RTE) for radiation modeling. As the fire-generated buoyancy driven flow is turbulent, and results into natural convection, the LES turbulence model was employed to resolve the subscale turbulence. The fire source is taken as the input parameter, which is either a stable heat release rate that was designed to represent the experimental measured HRR by the calorimeter or equivalent HRR taken from reported data.
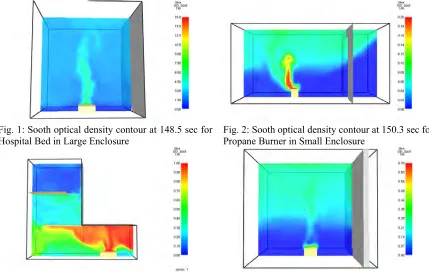
Fig. 1: Sooth optical density contour at 148.5 sec for
Hospital Bed in Large Enclosure Fig. 2: Sooth optical density contour at 150.3 sec for Propane Burner in Small Enclosure
Fig. 3: Sooth optical density contour at 151.5 sec for
RESULTS & DISCUSSION
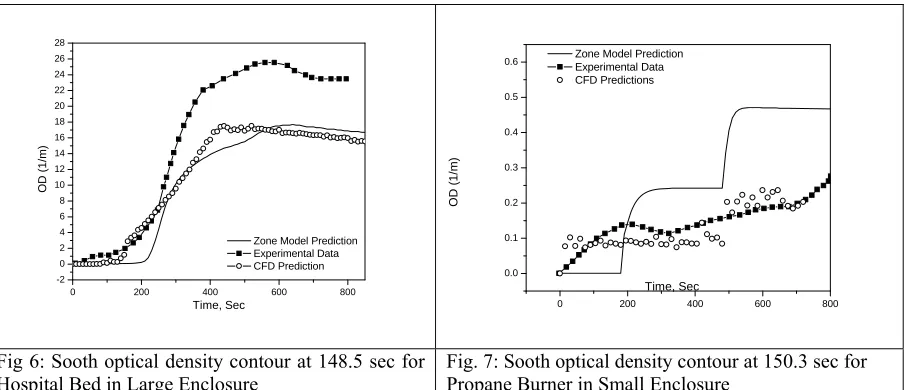
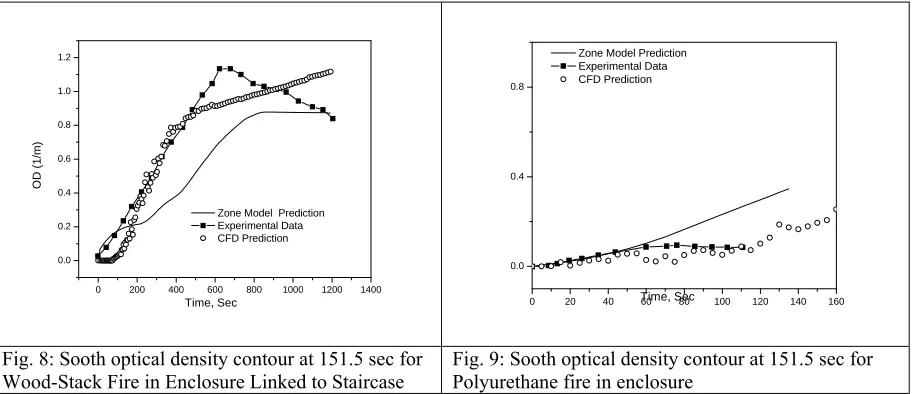
As a fire scenario is transient, a smaller time step is taken in the initial stage of the fire to resolve the transient. The computational domain was divided in sufficient number of cells based on our earlier studies. From Fig. 1 to Fig. 4 depicts smoke soot optical density contours from these four experiments are extracted at around 150 sec for a quantitative physical interpretations. For more simulative view is in form of 3D iso surface of smoke sooth obtained from these simulations has also been studied. Simulated visibility from iso surface clearly gives a feel of vision obscuration due to fire generated smoke. In first experiment the smoke density is so much that we are not able to see the white background and the modeled bed . Visibility conditions are better in second experiment. The third experiment isosurface depicts that in the top staircase the white background is visible where as in the burn room the white back ground is not visible and infact the yellow wood crib equivalent object is also less visible. The fourth experiment has less visibility then second experiment but more visibility then third experiment. This qualitative visibility construct(not shown in paper due to page limitations) however depends on the defaults values of sooth and associated image processing procedure available in companion post processing software Smokeview. In order to validate the CFD code numerically obtained values at the top corner in the enclosure are compared with the experimental observation which are shown from Fig 6 to Fig. 9 respectively for all the experiments. The results are also compared with the authors earlier zone model based predictions. In all the simulations zone model predictions are generally found to be agree fairly well in the developing stage of fire. At this stage the smoke density value is very important for designing the fire detection system. At the developed stage of fire the zone model predictions do not closely match with the experimental values. But, the CFD computations are in good agreement with the experimental data for the complete fire duration. This studies conclude that the engineering CFD calculation are cable of simulating the visibility conditions in fire . This information is also useful for planning of escape routes for evacuating and access routes for fire fighting. In the fully developed stage of fire the CFD predictions marginally differ from the experimental values. These differences may be attributed to several unknown parameters in the available experimental data such as time to ignition, rate of consumption of burning material and to the lack of aerosol processes in present study. The fact that the present does not account for smoke particle adsorption on the building surfaces may be one of the reasons for the observed differences. Based on these studies it is concluded that the CFD based prediction are more reliable as compared to zone model based predictions and for engineering design and safety purposes the CFD based procedure can reproduced the visibility the fire affected enclosure.
0 200 400 600 800
-2 0 2 4 6 8 10 12 14 16 18 20 22 24 26 28
Zone Model Prediction Experimental Data CFD Prediction
OD
(
1
/m
)
Time, Sec 0 200 400 600 800
0.0 0.1 0.2 0.3 0.4 0.5 0.6
Time, Sec
OD
(
1
/m
)
Zone Model Prediction Experimental Data CFD Predictions
Fig 6: Sooth optical density contour at 148.5 sec for
Hospital Bed in Large Enclosure Fig. 7: Sooth optical density contour at 150.3 sec for Propane Burner in Small Enclosure
6. CONCLUSION
0 200 400 600 800 1000 1200 1400 0.0
0.2 0.4 0.6 0.8 1.0 1.2
Zone Model Prediction Experimental Data CFD Prediction
Time, Sec
OD
(1/
m
)
0 20 40 60 80 100 120 140 160 0.0
0.4 0.8
Zone Model Prediction Experimental Data CFD Prediction
Time, Sec
Fig. 8: Sooth optical density contour at 151.5 sec for
Wood-Stack Fire in Enclosure Linked to Staircase Fig. 9: Sooth optical density contour at 151.5 sec for Polyurethane fire in enclosure
7. REFERENCE
[1] National Fire Protection Association Standard 130 (NFPA-130), "Standard for Fixed Guideway Transit Systems",
[2] William D Kennedy, Abdelghani Zigh and David M Plotkin, "Estimating the Light Attenuation of Smoke as a function of Ventilation and Heat release Rate", www.TransportationUSA.net.
[3] Clarke, A.G. and Shaw, C.L., 1993, Evaluation of plume visibility, Trans IChemE, Part B, 71: 203–207. [4] Brown G. J. and Fletcher D. F., “CFD Prediction of Odour Dispersion and Plume Visibility for Alumina Refinery Calciner Stacks”, Process Safety and Environmental Protection, 83(B3): 231–241
[5] Kawabata N., Wang Q., 'Study of Ventilation Operation During Fire Accident in Road Tunnels with Large Cross Section ', Proc. 4th KSME-JSME Fluids Eng. Conf., Pusan, Korea, October 1998, pp. 53-56.
[6] Kawabata N., Wang Q. and Yagi H., 'Study of Evacuation Environment During Fire Accident in Tunnels of the 2nd Tomei-meishin Expressway by Numerical Simulation', Transactions of The Society of Heating, Air-Conditioning and Sanitary Engineers of Japan, No.74, July, 1999, pp.101-111 (in Japanese).
[7] Gobeau, N., Ledin, H.S. and Lea, C.J. (2002) Guidance for HSE Inspectors: Smoke movement in complex enclosed spaces - Assessment of Computational Fluid Dynamics. HSL Report HSL/2002/29.
[8] Purser D. (1996) Behavioural impairment in smoke environments. Toxicology, 115, 25-40.
[9] Kang K. (2007) A smoke model and its application for smoke management in an underground mass transit station. Fire Safety J., 42, 218-231.
[10] Mulholland, G.W. (1995) Smoke production and properties. In The SFPE Handbook of Fire Protection Engineering. 2nd edition (P.J. DiNenno et al. Eds.), National Fire Protection Association, Quincy (USA), Chapter 2-15.
[11] Blake D. and J. Suo-Anttila (2008) Aircraft cargo compartment fire detection and smoke transport modeling. Fire Safety J., 43, 576–582.
[12] Gobeau, N. and Zhou, X.X. (2004) Evaluation of CFD to predict smoke movement in complex enclosed spaces: Application to three real scenarios: an underground station, an offshore accommodation module and a building under construction. Fire and Explosion Group, HSL Report 255.
[13] Zigh G, Ong I, Kang K. CFD application for station fires. In: Proceedings of the 10th BHR Group international symposium on aerodynamics and ventilation of vehicle tunnels, Boston, MA, USA, 2000.
[14] Milke, J.A. (1995) Smoke management in covered malls and atria. In The SFPE Handbook of Fire Protection Engineering. 2nd edition (P.J. DiNenno et al. Eds.), National Fire Protection Association, Quincy (USA), Chapter 4-
[15] Meo, M., G., “Modelling OfEnclosure Fires”, Ph.D. Course in Chemical Engineering, Graz University of Technology
[17] J Ewer; E R Galea, An Intelligent CFD Based Fire Model, Journal of Fire Protection Engineering, vol(1), 1999, p.12-27.
[18] Simcox S; Wilkes et al, Computer Simulation of the Flows of Hot Gases from the Fires at King’s Cross Underground Station, Fire Safety Journal, vol(18), 1992, p.49-73.
[19] Barrero D.; Ozell B.; and Reggio M. , On CFD and Graphic Animation for Fire Simulation, The Eleventh Annual Conference of the CFD Society of Canada, Vancouver, BC, 2003.
[20] Glynn D.R.; Eckford D.C. and Pope C.W., Smoke Concentrations and Air Temperatures Generated by a Fire on a Train in a Tunnel, The PHOENICS Journal of Computational Fluid Dynamics and its Applications, vol(9) 1, 1996, p. 157-168.
[21] Kerrison, L.; MaWhinney, N.; Galea, E.R.; Hoffmann, N.; and Patel, M.K., A Comparison of a FLOW3D Based Fire Field Model with Experimental Compartment Fire Data, Fire Safety Journal, vol(23), 1994, p. 387-411.
[22] Kumar, S., Hoffmann, N. and Cox, G., “Some Validation of Jasmine for Fires in Hospital Wards”, Numerical Solution of Fluid Flow and Heat/Mass Transfer Processes, Springer-Verlag, Berlin, p.159, 1985.
[23] Welch, S.; and Rubini, P.A., SOFIE 2.1 User’s Manual, Cranfield University, Cranfield, United Kingdom, 1996.
[24] Galea, E.R.; Knight, B.; Patel, M.K.; Ewer, J.; Pitridis, M.; and Taylor, S., SMARTFIRE v2.0 User Guide and Technical Manual, Fire Safety Engineering Group, University of Greenwich, UK, 1998.
[25] Ferziger, J.H., Subgrid-Scale Modeling’ In: Large Eddy Simulation of Complex Engineering and Geophysical Flows”. Editors: B. Galperin and S.A. Orszag, Cambridge University Press, Cambridge, 1993, p. 37-54.
[26] Smagorinsky, J., General Circulation Experiments with the Primitive Equations, Monthly Weather Review, vol(91), 99-165.
[27] Baum, H.R.; and Rehm, R.G., Numerical Computation of Large-Scale Fire Induced Flows, In: Eighth International Conference on Numerical Methods in Fluid Dynamics, Editors: E. Krause, Lecture Notes in Physics vol(170), Springer-Verlag, Berlin, 1982,p. 124-130.
[28] Baum, H.R.; Rehm, R.G.; and Mulholland, G.W., Computation of Fire Induced Flow and Smoke Coagulation”, Nineteenth Symposium (International) on Combustion/The Combustion Institute, 1982, pp 921-931.2–22.
[29] Rehm, R.G.; Tang, H.C.; Baum, H.R.; Sims, J.S.; and Corley D.M., A Boussinesq Algorithm for Enclosed Buoyant Convection in Two Dimensions”, NISTIR 4540, U.S. Department of Commerce, National Institute of Standards and Technology, Computing and Applied Mathematics Laboratory, Gaithersburg, MD 20899, U.S.A., 1991.
[30] Baum, H.R.; McGrattan, K.B.; and Rehm, R.G., Mathematical Modelling and Computer Simulation of Fire Phenomena, Fire Safety Science – Proceedings of the Fourth International Symposium, Ottawa, Ontario, Canada, 1994, p. 185-193.
[31] Rehm, R.G.; McGrattan, K.B.; Baum, H.R.; and Cassel K.W., Transport by Gravity Currents in Building Fires, Fire Safety Science – Proceedings of the Fifth International Symposium, 1997, p. 391-402.
[32] Baum, H.R.; McGrattan, K.B.; and Rehm, R.G., Large Eddy Simulations of Smoke Movement in Three Dimensions, Conference Proceedings of the Seventh International Interflam Conference, Interscience Communications, London, 1996, p. 189-198.
[33] Baum, H.R.; McGrattan, K.B.; and Rehm, R.G., Three Dimensional Simulations of Fire Plume Dynamics, Fire Safety Science – Proceedings of the Fifth International Symposium, 1997, p. 511-522.
[34] Baum, H.R., Large Eddy Simulations of Fires – from Concepts to Computations, Fire Protection Engineering, vol(6), 1999, p. 36-42.
[35] McGrattan, K.B.; Baum, H.R.; and Rehm, R.G., Large Eddy Simulations of Smoke Movement, Fire Safety Journal, vol(30), 1998, p.161-178.
[36] Sharma, Pavan K.; Markandeya S. G.; Ghosh, A. K.; Kushwaha, H. S.; and Venkat Raj V., A Computational Fluid Dynamics Study of a Buoyant Plume in a Cross Flow Condition, 28th National Conference on Fluid Mechanics and Fluid Power, Punjab University, Chandigarh, 2001.
[37] Wang Lei; Pu Jin-yun,Computing on Fire-induced Smoke Flow in Irregular Confined Space, International Forum on Computer Science-Technology and Applications, 2009.
[38] Baum, H.R.; McGrattan, K.B.; and Rehm, R.G., Three Dimensional Simulations of Fire Plume Dynamics, Fire Safety Science – Proceedings of the Fifth International Symposium, 1997, p. 511-522.
Engineering (ICFRE3), Third (3rd). Proceedings. Society of Fire Protection Engineers (SFPE), National Institute
of Standard and Technology (NIST) and International Association of Fire Safety Science (IAFSS), 1999, Chicago, IL, Society of Fire Protection Engineers, Boston, MA.
[40] Clement, J. M., Experimental Verification of the Fire Dynamics Simulator (FDS) Hydrodynamic Model, Ph D. Thesis, University of Canterbury, Christchurch, New Zealand, 2000.
[41] Sharma, Pavan K.; Ghosh, A. K.; Singh R. K.;, Kushwaha, H. S., A CFD Validation Study of Pool Fire and Few Applications In Nuclear Industry, Discussion meet on "Fire Modeling", AERB Mumbai., 2007.
[42] Sharma, Pavan K.; Ghosh, A. K.; Kushwaha, H. S., A Computational Fluid Dynamics Study of Buoyant Plume and its Rise Time, 32nd National Conference on Fluid Mechanics & Fluid Power, College of
Engineering , Osmanabad, Maharashtra, 2005.
[43] McGrattan Kevin; Hostikka Simo; Floyd Jason; Baum Howard; and Rehm Ronald, Fire Dynamics Simulator (Version 5) Volume -2, Validation, Technical Reference Guide NIST Special Publication 1018-5, In cooperation with: VTT Technical Research Centre of Finland National Institute of Standards and Technology, Gaithersburg, Maryland, 2007.
[44] McGrattan Kevin; Hostikka Simo; Floyd Jason; Baum Howard; and Rehm Ronald, Fire Dynamics Simulator (Version 5) Volume -3, Verification, Technical Reference Guide NIST Special Publication 1018-5, In cooperation with: VTT Technical Research Centre of Finland National Institute of Standards and Technology, Gaithersburg, Maryland, 2007.
[45].National Fire Protection Association Standard, (NFPA) 2005.
[46]. Soren Isaksson, Bror Persson, Heimo Tuovinen, "CFD-Simulations of Fire Detection in a Room with a Perforated Suspended Ceiling", SP Swedish National Testing and Research Institute, Fire Technology, SP Report 1997:43,1997.
[47]. BRANZFIRE 99.004, Technical Reference Guide, Building Research Association of New Zealand, New Zealand, “BRANZFIRE”, June 1999.
[48]. Jin, T. 1978. Visibility Trough Fire Smoke. Journal of Fire & Flammability, Vol. 9, pp. 135–155. [49] Mulholland G.W. . SFPE Handbook of Fire Protection Engineering, chapter Smoke Production and Properties. National Fire Protection Association, Quincy, Massachusetts, 3rd edition, 2002. 159
[50] Rinne, Tuomo, Hietaniemi, Jukka & Hostikka, Simo. Experimental Validation of the FDS Simulations of Smoke and Toxic Gas Concentrations, VTT Working Papers 1459–7683, 2007. (URL: http://www.vtt.fi/publications/index.jsp)
[51] Hultqueist Hans, "Simulating Visibility in Hazard1/CFAST", Department of Fire Safety Engineering, Lund University,Sweden, Report 7010, Lund 2000.
[52] Gandhi, P. D. " Validation of a Zone Model for Predicting Smoke Obscuration in rooms", Journal of Fire Sciences, vol. 12, pp 313-325, 1994.
[53] Tewarson, A. 2002. Generation of Heat and Chemical Compounds in Fires. The SFPE Handbook of Fire Protection Engineering. 3rd ed. Section 3, Chapter 4. Quincy, MA: The National Fire Protection Association Press. Pp. 3-82–3-161.
[54] Yii, H.,W., "Effect of Surface Area and Thickness on Fire Load", Fire Engineering Report 2000/13.March 2000.