1
A compact micro-bolometer array for mid-infrared laser beam alignment,
diagnostics and spot-size measurement
IP Clark
a)and M Towrie
Science and Technology Facilities Council, Central Laser Facility, Research Complex at Harwell, Harwell Campus, Didcot, Oxfordshire, OX11 0QX, UK
a)Author to whom correspondence should be addressed: [email protected]
Knowledge of a lasers beam’s profile throughout a laser system and experiment can help immensely in
diagnosing laser problems and assisting in beam alignment and focusing at a sample. Obtaining such profiles is a trivial task in the ultraviolet-visible wavelength range but more challenging with near-infrared to infrared beams. Scientific grade bolometer arrays, suitable for such a task, do exist but are extremely costly, relatively large and have a large pixel size, of the order of 80 µm, which is adequate for profiling larger beams but poses an issue when trying to profile sub 100 µm beams for example at a focal point.
This communication identifies a micro-bolometer array for near- to mid-infrared laser beam profiling, which is extremely low cost. In addition, the device is very compact, enabling use in confined spaces, and has a small, 12 µm, pixel size permitting the profiling of focused laser beams. The best scientific grade device identified has a pixel size of 17 µm. This device is a powerful tool for infrared laser spectroscopists, reducing the time required to measure the spot size of beams and to achieve spatial overlap of multiple infrared beams as used in two-dimensional infrared spectroscopy, saving many hours of setup time. The use of the bolometer array as a spectrographic detector and probe of long-term beam drifts is also demonstrated.
1. Introduction
The intensity of light impinging on a sample and the spot-size of beams at the sample are two of the most
important factors influencing the collection of quantitative data in many scientific disciplines, but particularly in
laser-based time-resolved spectroscopic applications. The operator needs to know the spot-size and power of both pump
and probe beams incident on the sample. It is a trivial task, not discussed here, to measure the power of laser
beams using a power meter. Recording the spot-size of laser beams, in particular in the mid-IR, at the target is
however, less trivial. A number of methods are available to the researcher including visual inspection of laser burn
spots, knife-edge, pinhole, or slit-method and array camera methods. These techniques are reviewed in references
[1] and [2].
2
Visual methods of analysing a beam profile, whilst simple and low cost, are somewhat crude and subjective.
The human eye perceives brightness as a logarithmic function of the light intensity entering the eye and is limited
to perceiving approximately 30 shades of grey.[3] A study by Kimpe and Tuytschaever [4] shows that given the
right conditions, e.g. a high specification medical display, the human visual system is potentially capable of
observing approximately 900 shades of grey. Assuming the eye can perceive such a high number of grey shades,
viewing a laser burn pattern has the disadvantage of only being practical for larger spot sizes, not sub-millimetre
beam sizes, and only being useful with beams of high enough energy to induce a burn. When attempting to
determine the size of a focal spot, the other non-digital methods such as the use of a knife-edge, slit or pinhole, are
time consuming requiring the operator to traverse the device through the beam and along the optical axis to locate
the focal point.
The location in space of infrared beams is also a critical factor to collecting quality data in infrared spectroscopy,
with some techniques such as two-dimensional infrared spectroscopy requiring not only temporal overlap of two or
more beams but also spatial overlap. At present commercial scientific infrared cameras, which can aid in both
spot-size and beam overlap are beyond the reach of many budgets, and often have pixel spot-sizes approaching or greater
than the focused infrared beams used in such experiments. Thus not only are the cameras expensive they are far
from optimal for small diameter beams. Another issue that may hinder their use, depending on the experimental
arrangement, is the large size of these devices, which can be up to 80×80×40 mm, a volume which is further
enlarged by the space required for power and communication cables.
We present an ultra-compact and, commercially available micro-bolometer array thermal camera with a small
pixel size, which can be adapted for the purpose of profiling beams (up to approximately 0.5 mm in diameter) in the
near to mid-infrared range. The device has the potential to reduce significantly the setup time of any spectroscopic
technique requiring the spot-size measurement of infrared beams or requiring spatial overlap of multiple infrared
beams and has many other laboratory uses.
2. Experimental
A micro-bolometer array meeting the following criteria: commercially available, low cost, compact and with small
pixel size was identified and purchased. The device (Seek Thermal, model Compact XR Android) is 45×25×18 mm
3
dimensions are approximately 2.5×1.8 mm. The micro-bolometer is equipped with an internal shutter, which
periodically blocks the sensor during the cameras calibration process and has a micro-B USB 2.0 male connector
for communication, being designed for connecting to Android phones. As purchased the device has an attached
adjustable focus lens, which appears to be a made from a chalcogenide material and provides a 20° field of view.
The use of the lens clearly aids the collection of thermal images, which is the device’s intended purpose, but
prevents use in laser beam profiling applications. It was a relatively simple task, however, to remove the optic thus
permitting a clear light path to the sensor.
Testing of the micro-bolometer was performed using the output of the Ultra LIFEtime system, which is part of
the STFC’s Central Laser Facility. References [5] and [6] give full details of this laser system and its capabilities.
Briefly, the system consists of two synchronized 100 kHz femtosecond lasers (Light Conversion, Pharos) and three
optical parametric amplifiers (Light Conversion, Orpheus) providing one UV to mid-IR (210-16,000 nm) output and
two independently tunable mid-IR (2,400-13,000 nm) outputs. The bolometer was located at the focal point of an
off-axis parabolic mirror of focal length 75 mm; all three of the laser systems infrared beams were incident on the
mirror such that they were coincident at the focal point.
One of the infrared beams was diverted to a 125 mm spectrograph (Oriel Instruments, model 77400) with a 30
lines/mm grating blazed at 8 µm to test the use of the micro-bolometer as an infrared array detector for spectroscopic
applications. A “chopped” mode of operation was used for these measurements, where by an image with and
without the beam was recorded for each frame. Chopping was controlled by an in-house servo-motor based shutter
controlled by an Arduino which linked to the data acquisition software.
In-house code written in the Python programming language enabled acquisition of the raw 14bit greyscale data
from the bolometer thus permitting easy processing, viewing and saving of images. All images reproduced are
displayed using a perceptually uniform colour map, ie one in which equal data steps are perceived as equal steps
in the colour space, and stored in ASCII format upon saving.
3. Results and Discussions
Image Capture and Processing
The Android version of the Seek bolometer purchased has a companion app available for download from the
4
lens-free device to operate as a beam profiler; however, it is obviously limited to a small format screen, lacks the
software features often used during beam profiling such as x- and y-cuts through the images and is a significant
drain on the phone’s battery.
The Seek bolometer array exports many frame modes, only two of which are understood – images with the
shutter closed, to act as a background measurement, and images in ‘normal’ capture mode, the data from which
can be processed as outlined below to yield usable images whether as an infrared camera for thermal imaging or
a beam profiler as described here. The raw images from the array have every 15th pixel set to zero; there is
speculation on the web that this may be to avoid patent infringement.[7] Figure 1 shows a background image (a)
and a raw ‘normal mode’ image (b) of the focal spot of a 6 µm laser beam and a subtracted image, normal minus
background, (c). The subtracted image still contains the artefacts at every 15th pixel, which will hamper any beam
profiling. These can however be corrected using a simple nonlinear digital filtering technique, in this case the
application of a median filter with a window size of three, the result of this operation are shown in figure 1(d). One
downside of using a bolometer, which is essentially a thermal detector, is visible when comparing figure 1(a) and
(b) – the background and raw images. With the device in a temperature-regulated laboratory at 20 °C the
background image intensity is approximately half the peak intensity of the pixels on which the beam is incident,
which was recorded with the device close to saturation. This room temperature background essentially halves the
usable dynamic range of the bolometer. The images are pixelated, a consequence of the beam spot size (full width
at half maximum, FWHM) being ca 5 times the pixel size; a typical silicon based CCD sensor used for profiling
UV-visible beams would have at least four times the pixel density. Other researchers have reported similar work for
visible to near-infrared beams using web cameras as beam profilers which have a higher pixel density [8] and
Langer and co-workers reported an elegant method for achieving sub-pixel resolution by operating in
Bayer-mode.[9] This approach is not an option here as a micro-bolometer is not a colour device; however, the image can
easily be enhanced, by resampling using a bicubic Mitchell Netravali image reconstruction filter with B = C = 1/3,
[10, 11] figure 1(d, inset). Spot-size measurement, from x- and y-cuts through the image, is carried out using the
5
Figure 1. A single frame raw calibration (backgound) image (a) and ‘normal’ image (b) from the micro-bolometer array using a 6 µm laser beam at 15 nJ and 5 kHz, due to the cameras frame rate the image is the result of ca 700 laser pulses. (c) shows the subtracted image, ie the calibration image subtracted from the ‘normal’ image. The image is enhanced by applying a median filter with a window size of three (d) and by resampling using a bicubic Mitchell-Netravali image reconstruction filter with B = C = 1/3 (d, insert). Each image is of a 50×50 pixel section of the bolometer array.
Figure 2 shows cuts through the x- and y-axes of the image displayed in figure 1(d). The captured data is of
high enough quality to obtain laser spot-size measurements from Gaussian fits to the x- and y-cuts, figure 2(a) and
(b). The cuts shown yield beam diameters, FWHM, of 90 and 77 µm along the x- and y-axes, with R2 values of
0.911 and 0.961 respectively, which is an indication of the quality of the laser beam spot rather than the bolometer
array. Figure 2(c) illustrates the noise level of the device, showing the baseline across the whole of the y-cut, which
6
Figure 2. (a) x-cut through the image displayed in figure 1(d) at y-pixel 90 and (b) y-cut through the same image at x-pixel 110. The broken lines in (a) and (b) are Gaussian fits to the x- and y-cuts respectively. (c) zoom into the baseline along the y-cut to illustrate the noise level of the micro-bolometer. Note, this data is from a single image frame which is the result of ca 700 laser pulses.
It is not possible to trigger the micro-bolometer from an external source so frame capture is limited to the devices
inherent frame rate, which if simply acquiring and viewing images is ca 7 fps using its USB 2.0 connection and a
computer with Intel Core i5-3427U 1.8 GHz processor and 6 GB RAM. If all images (raw, corrected and the
corresponding calibration image) are saved for every frame this frame rate drops to ca 3.5 fps.
Detector Response
Possibly the most common detector used for infrared spectroscopic measurements is the mercury cadmium
telluride, or MCT, detector, which typically peaks in spectral response around 10 µm, and has little response below
1 µm or above 12 µm.[12] In general, a bolometer, which is a thermal detector, responds to a much broader
7
window.[13] An indication of the bolometer array’s spectral response was obtained using a variety of wavelengths
available from the Ultra laser system. Figure 3 shows the captured images, which were used to calculate a crude
sensitivity at each wavelength (using the average power of the laser and the amplitude of a 2D-Gaussian peak fitted
to the beam) using Equation 1, figure 4.
𝑺𝒆𝒏𝒔𝒊𝒕𝒊𝒗𝒊𝒕𝒚 = 𝑻𝒐𝒕𝒂𝒍 𝒊𝒏𝒕𝒆𝒏𝒔𝒊𝒕𝒚 𝒊𝒏 𝑭𝑾𝑯𝑴
(𝑵𝒖𝒎𝒃𝒆𝒓 𝒐𝒇 𝒑𝒊𝒙𝒆𝒍𝒔 𝒊𝒏 𝑭𝑾𝑯𝑴 ×𝑰𝒏𝒄𝒊𝒅𝒆𝒏𝒕 𝒑𝒐𝒘𝒆𝒓) Equation 1
As anticipated, the bolometer sensitivity is higher at 10 µm than 1.3 µm, with sensitivity increasing through the
mid-infrared region. What was not expected was the high sensitivity of the device at 1.6 µm. The exact cut on
wavelength of the device, which is unable to see light in the visible region nor 800 nm, is not known.
All the images above were recorded using beams with a pulse length of ca 180 fs. Although not shown here
the bolometer was also tested, and found to function well, at 4 µm with the nanosecond output of a periodically
poled lithium niobate (Covesion) based optical parametric oscillator pumped by a 4 W 1064 nm diode-pumped
solid-state laser (Wedge laser, Bright Solutions).
8
890 pulses; (b) 1.6 µm, 15 nJ at 0.2 kHz, ca 28 pulses; (c) 3.5 µm, 10 nJ at 2 kHz, ca 290 pulses; (d) 4 µm, 20 nJ at 1.25 kHz, ca 180 pulses; (e) 5 µm, 18 nJ at 1.25 kHz, ca 180 pulses; and (f) 10 µm, 2.25 nJ at 0.1 kHz, ca 14 pulses.
Figure 4. Plot of wavelength versus sensitivity of the bolometer array. Equation 1 was used to calculate sensitivity. Note, the ordinate is on a log scale.
The bolometer’s linear dynamic range was measured using one of the infrared beams at 6 µm. The pulse
picker on the laser provided an easy means of attenuating the average power by reducing its repetition rate;
confirmation of the linearity of the power reduction with reduced repetition rate was obtained by measurement.
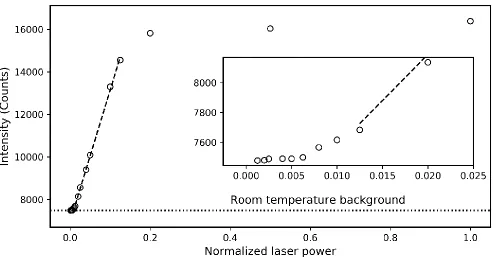
Figure 5 shows a plot of the maximum intensity of the beam recorded in each image. The results show the 7,600
counts room temperature background and that in the intensity range 7,750 to 14,500 counts the response of the
detector is linear, with a coefficient of determination, R2, of 0.996. Like any other photodetector, the spectral
response is not flat, as observed in figure 3 and figure 4. Whilst the observed intensity with a particular incident
power changes with wavelength, we anticipate the intensity range over which the bolometer is linear to be the same.
9
Figure 5. Plot of micro-bolometer intensity recorded using a 6 µm beam at powers ranging from 1.9 to 1500 µW, pulse energy of 15 nJ and a spot size of 92 µm (FWHM). The dashed line represents a linear fit to the data showing the range over which the device is linear. The dotted line shows the room
temperature background detected by the bolometer array. The inset shows the first 10 data points on a larger scale, showing that below an intensity of ca 7,750 counts the response of the bolometer is not linear.
Beam Profiling, Spatial Overlap and Beam Drift
The bolometer array increases the speed and ease with which it is possible to identify aberration in either an
infrared probe or pump beam, and saves time when determining the focal plane and focal spot-size (shown above).
Figure 6 demonstrates how the device can easily identify aberration within a focal spot, in this instance induced by
poor alignment of the infrared beam onto an off-axis parabolic mirror. As shown in figure 6, such aberration has a
significant impact on the focal spot size and shape and only requires a small displacement of the beam as it
approaches the focusing mirror. Figure 7 shows an image, at the focal plane, of the beam from the systems
pulse-shaper used for the pump beam in two-dimensional infrared experiments. This beam exhibits satellite artefacts
along the x-axis or vertical axis in the experimental setup. Without a means of viewing the infrared beam profile the
detection of these effects would be both time consuming and difficult. Either effect could have a significant impact
on any experimental signal and the quality of collected data; for example, it is feasible for the operator to overlap
10
Figure 6. 50×50 pixel sections of the bolometer array containing the focus of a 4 µm beam (20 nJ at 10 kHz) with a small amount of aberration (a) and severe aberration (b). The image is the result of ca 1430 laser pulses.
11
Prior to purchasing the micro-bolometer, obtaining spatial overlap of multiple mid-infrared beams was a tedious
task, requiring location of the focal point, overlap of the beams using a pinhole in the focal plane and spot-size
measurement of each beam with a knife-edge. This would often require repetition numerous times after adjusting
the collimation of the beams to achieve an optimal focal spot size. At best, this process took many hours. With the
introduction of the micro-bolometer array to the laboratory the time-taken to achieve this task is vastly reduced
making the task much easier, leaving more time for research. Figure 8 shows images from the bolometer array
recorded as it travels along the optical axis. Each image shows three infrared beams which focus to the same
point, at which all three beams are spatially overlapped.
12
The bolometer is also an extremely useful tool for monitoring long-term drifts in infrared beam position by
capturing and analysing individual frames, a process which can easily be automated. As discussed above, it is not
possible to trigger the device from an external source, and it has a relatively slow frame rate; it is therefore not
possible to capture every laser shot. By recording every 4th frame a frame capture rate of approximately 1.3 fps is
achieved. Fitting a two-dimensional Gaussian to each image enables tracking of the beam position with time.
Figure 9 shows the drift over 15 minutes of one of the 6 µm laser outputs from the LIFEtime system after opening
its pulse-picker. There is a clear horizontal drift over time, whereas the vertical beam position is constant, with the
exception of the point, marked by an arrow, when the door to the laboratory opened. Changes in the laboratory air
pressure are known to affect the laser system, this effect is reduced by shielding around the laser; however, a small
drift in beam position can be seen. It is worth noting that, the significance of a relatively small, 1.5 µm, drift is low
given that the FWHM of the beam was 75 µm.
Figure 9. Plots of long-term beam deviation of the 6 µm output of the laser system monitored at the focal plane. Each frame represents an average of approximately 7,500 laser shots, saving every 4th frame gave
13
Spectrographic Detection
As an array device there is potential to employ the micro-bolometer as a detector for infrared spectroscopy.
The detectors usually employed for such applications are MCT focal plane arrays costing many tens of thousands
of pounds. In order to test the potential of the bolometer array as a low-cost spectrographic detector, the data
acquisition code required additional features, including a means of vertical binning of the pixels over a region of
interest, frame averaging and operation in a ‘chopped’ mode using a shutter controlled by the software. In ‘chopped’
mode, each image is the result of two frames, one with infrared light on the detector and the other a dark frame, the
two images are subtracted. For spectral acquisition, the calibration image was unused; its subtraction simply
removes a baseline from recorded spectra.
The dimensions of a typical MCT focal plane array are 32x1 mm for a 128-element array with 200 µm wide
pixels with a 50 µm separation. The 206×156 element micro-bolometer sensor (unknown pixel separation) has an
approximate width of 2.5 mm, which is ca 13 times narrower than the MCT detector, but has ca 1.6 times more
pixels. Clearly to see the same spectral bandwidth, careful grating choice is required. The results of the test using
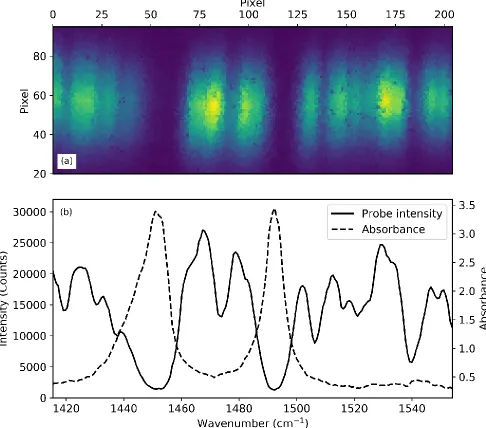
a ca 200 cm-1 bandwidth beam at 6 µm and a 30 lines/mm grating blazed at 8 µm are shown in figure 10. The
figure shows the resulting image, binned data and calculated infrared spectrum using a polystyrene sample. A
clear spectrum of polystyrene in the 1480 cm-1 region can be seen, showing 140 cm-1 bandwidth and ca 0.7 cm-1
per pixel. The fact the edges of the detector still show a significant amount of light indicates that the device was
not capturing all the bandwidth, a 20 l/mm grating in the 125 mm spectrometer may have permitted the full bandwidth
to be observed, nevertheless, the data shows clearly that the micro-bolometer can work well as a spectroscopic
14
Figure 10. (a) Image showing the section of the micro-bolometer array illuminated by the infrared light with a 38 µm polystyrene sample in the beam. The infrared light was dispersed using a 125 mm
spectrograph (Oriel Instruments, model 77400) with a 30 lines/mm grating blazed at 8 µm and the detector was operated in ‘chopped’ mode. (b) Plot of the binned light intensity (binned over 75 pixels in the vertical direction) on the array (solid line), which clearly shows absorbance features from the polystyrene sample and water vapour lines. The dashed line shows the absorbance of the polystyrene sample.
4. Conclusions
The work presented shows how it is possible to use a low-cost compact off-the-shelf micro-bolometer array
designed for mobile devices for a number of applications with infrared laser beams that can significantly ease
15
detection, spatial overlap of beams, monitoring of long-term beam drift and use as a low-cost spectroscopic infrared
array detector. The data presented shows that the device is sensitive in the range 1.3 to 10 µm, but we anticipate
the upper limit of its usable range to be close to 20 µm. The supplier specifies the working range to be 7.5 to 14
µm, but this is likely limited by the supplied chalcogenide lens. The use of such an infrared viewing aid can vastly
reduce the amount of time required to set-up complex experiments involving infrared beams, being particularly
useful for time-resolved spectroscopic techniques such as time-resolved infrared and two-dimensional infrared
spectroscopies. The compactness of the device enables it to fit in even the smallest sample region.
One downside of the micro-bolometer array is that at present it is insensitive to light with a wavelength less than
ca 1.3 µm we are presently looking into whether or not this limitation can be overcome which would enable use of
the device to overlap near- or mid-infrared beams with visible beams, particularly useful for pump-probe
spectroscopic experiments. In addition, the room temperature background seen by the micro-bolometer limits its
usable dynamic range.
It is possible the micro-bolometer will find a use in assisting in phase-correction of two-dimensional infrared
spectra. The technique is particularly challenging, being sensitive to both spatial and temporal overlap of three
beams when the impulsive time-domain technique is used. Using this approach requires sub-cycle accuracy in
pulse timings and the experimentalist must know the absolute phase. Hamm and co-workers have reported a
set-up in which a pinhole is placed in the focal plane to induce scatter enabling the interference fringes of two
pulse-pairs to be observed.[14, 15] Cundiff and colleagues have developed a similar technique for two-dimensional visible
spectroscopy where a camera is placed in replica focal plane.[16] The micro-bolometer array may be able to work
in a similar manner for two-dimensional infrared spectroscopy.
The fact that the micro-bolometer can be used as an infrared array detector for spectroscopic applications
makes it particularly useful for quick test experiments, being very portable requiring just the detector and a
computer. The low-cost of the device means that infrared array detectors should not be beyond the budget of
teaching environments.
16
The authors gratefully acknowledge the support of the Science and Technology Facilities Council and the
contributors to the post entitled “Yet another cheap thermal imager incoming.. Seek Thermal” on the EEVblog
Electronics Community Forum,[17] without which the initial steps of acquiring raw data from the Seek
micro-bolometer would have taken significantly longer.
References
1. Dickey, FM and Holswade SC, editors 2000 Laser Beam Shaping : Theory and Techniques (New York:
Marcel Dekker, Inc).
2. Magnes J, Odera D, Hartke J, Fountain M, Florence L and Davis V 2006 Quantitative and qualitative
study of Gaussian beam visualization techniques arXiv:physics/0605102.
3. Glover DM, Jenkins WJ and Doney SC 2011 Modelling methods for marine science, (New
York: Cambridge University Press), p 398.
4. Kimpe T and Tuytschaever T, 2007 Increasing the number of gray shades in medical display systems -
How much is enough? Journal of Digital Imaging20, 422.
5. Greetham GM, Donaldson PM, Nation C, Sazanovich IV, Clark IP, Shaw DJ, Parker AW and Towrie M
2016 A 100 kHz time-resolved multiple-probe femtosecond to second infrared absorption spectrometer
Applied Spectroscopy70, 645.
6. Donaldson PM, Greetham GM, Shaw DJ, Parker AW and Towrie M 2018 A 100 kHz pulse shaping 2D-IR
spectrometer based on dual Yb:KGW amplifiers Journal of Physical Chemistry A122, 780.
7. Tulloh D, https://github.com/lod/seek-thermal-documentation/wiki/Frame#basic-information.
8. Cignoli F, De Iuliis S and Zizak G 2004 A webcam as a light probe beam profiler Applied Spectroscopy
58, 1372.
9. Langer G, Hochreiner A, Burgholzer P and Berer T 2013 A webcam in Bayer-mode as a light beam
profiler for the near infra-red Optics and Lasers in Engineering51, 571.
10. Mitchell DP and Netravali AN 1988 Reconstruction filters in computer-graphics Proceedings of 15th
Annual Conference on Computer Graphics and Interactive Techniques - SIGGRAPH ’88 (New York: ACM
Press), pp. 221–228.
17
12. Rogalski A 2002 Infrared detectors: an overview Infrared Physics and Technology43, 187.
13. Niklaus F, Vieider C and Jakobsen H 2007 Proc. SPIE6836, 68360D.
14. Backus EHG, Garrett-Roe S and Hamm P 2008 Phasing problem of heterodyne-detected
two-dimensional infrared spectroscopy Optics Letters33, 2665.
15. Hamm P and Zanni M 2011 Concepts and Methods of 2D Infrared Spectroscopy (Cambridge: Cambridge
University Press).
16. Bristow AD, Karaiskaj D, Dai X and Cundiff ST 2008 All-optical retrieval of the global phase for
two-dimensional Fourier-transform spectroscopy Optics Express16, 18017.
17. EEVblog Electron. Community Forum (2014),