Stock Price Index Movement Prediction Using
Adaptive Firefly Algorithm Based Association Rule
Mining
B.SHARMILA, DR. R. KHANCHANA
Abstract: Stock market prediction is treated as important for the finding the economy growth of a country. Success of multiple investors is dependent on prediction of future stock market, but the prediction is based on three factors namely economic, technical and fundamental. Not all countries depend on the same factors or all factors, but developing countries like India depends on all three factors. Prediction of future stock price index movement will provide a step ahead towards success. In this paper, bio-inspired based classifier namely Adaptive Firefly Algorithm based Association Rule Mining is proposed to address the issues in predicting the stock price index movements. Optimization plays a major role towards increasing the classification accuracy of association rule mining algorithm. This research work considers the selected Indian based stock market companies, namely CNX Nifty, S&P BSE Sensex, Infosys, and Reliance. Benchmarks performance metrics in data mining are chosen to measure the performance of proposed algorithm against existing algorithms. The results shows that the proposed algorithm outperforms the existing algorithms in all the chosen performance metrics.
Keywords: Prediction, Stock, Price, Index, Firefly, Association
————————————————————
1. INTRODUCTION
The world of economy (WoE) is seen as various scales resembling the country and global scale. In country scale, WoE is observed as the relationship between various economic institutions in the country and it gives the outline to the country’s economy. It resembles the similar features in all available financial structure, which exist in most correlated units of financial data. It aims to provide large scale enhancement to financial structure. Authority of country’s loss on other country act as a evidence towards demonstrating the correlation on WoE. However, world people expect to have common scale of financial structure around the globe. The financial structure or units indirectly indicates different countries stock market. This kind of theoretical structure are denoted as “World Stock Market (WSM)”. Collective behavior plays a major role in WSM, where it includes collection of behavior in WSM. Econophysics literature defines collective behavior as, study and analysis of matrix involving cross-correlation and stock returns by utilizing theory of random matrix. Stock prediction and its price index prediction is almost a demanding issue due to its ambiguity presence. It involves two different kinds of analysis stock marketing before making investment, which are technical investigation and basic investigation. In technical investigation, the investors won’t check the essential value of stock, but the charts of the stock are thoroughly checked to seek patterns to suggest the upcoming behavior of the stock, where price history and market impact for the stocks are also analyzed. In basic investigation, investors will make a review on stock value, standard of the industry, and the market economy. In general, Association Rule Mining (ARM) is composed of control structure statements which helps the algorithm to find the relationship between relational databases that dependent and independent. Multiple machine learning algorithms process the numeric dataset alone and it involves mathematical function. Hence, ARM is well suited for non-numeric datasets, where one step more effort is needed. ARM is a set of systematic procedure with the intention to detect patterns which occur more frequently in different kinds of databases. Sometimes, ARM is referred as Market-Basket-Analysis which aim to find multiple
associations which are expected in a random sampling methodology.
2. LITERATURE REVIEW
1542 presented a forecast model for stock marketing. Dual
approach was followed for extracting the input variables, where the dual approach utilizes the raw data and signal data. Further it uses the wrapper model to highlight the predicted data as output variables. Feature selection was applied to reduced the features used for classification. The results with increased time for classification shows the algorithm weakness towards heterogeneous dataset. Stock Evaluation based Mining [7] was developed to forecast the prediction of stocks and its risk. It involves the deep analysis of available features for stock prediction and data mining methods for prediction from the features. Filter based clustering method was applied to applied to identify the risks available in the particular features, but the results shows that the algorithm has low sensitivity. Machine Learning Algorithms [8] were evaluated find the better accuracy providing algorithm. This algorithm focuses in house price prediction. It aimed to provide assistance for house brokers, but it was found that the price difference exist a lot and algorithm was weak performance towards giving the accuracy. Combined Mining Framework [9] was proposed to make an analysis on payment prediction based system. It used the domain driven strategy of data mining and association rule mining. It has found that the bills generated were deleted for balancing the data, which was really unexpected. Analysis attempted to generate better attributes. It was found that the algorithm was low value on f-measure and sensitivity. Sentiment Lexicon Acquisition Method [10] was proposed to create the lexicons of stock market. It was based on statistics methods, and it applies label for the data for better processing. It attempted to make comparison using different statistical methods. Sentiment analysis were also made. Due to the lengthy process, the time taken for the classification got increased and also the accuracy went low than the previous works. Causality Analysis based Stock Prediction [11] was proposed to make prediction on financial aspects based on news. Unstructured data was used for this research purpose. Several attempts were made to analyze the asymmetric data and focused on target and relevant firms. Multi-kernel learning method was used to ensemble the features. Due to not performing the feature reduction, the algorithm performance on accuracy went down. Three Phase Clustering Method [12] was proposed perform clustering more than once to increase the accuracy of the classification. Initially, minimum resolution time series data were used to segregate the companies, then it was once again clustered to form clusters. In the end, sub-clusters were merged. The classification accuracy of different clusters got different accuracy which is unexpected.
3. ADAPTIVE FIREFLY ALGORITHM BASED
ASSOCIATION RULE MINING (AFA-ARM)
Firefly Algorithm is developed from the natural behavior of firefly insect. Fireflies makes interaction and transform the information with each other using flashing lights that are emitted through their bodies. The emitted flashing lights are utilized to make attraction with other fireflies. The intensity of the emitted light gets varied based on the distance that exist between the fireflies. The behavior of the firefly is used to develop and map the proposed algorithm based classifier, which cover three different rules that are (1)
Fireflies are unisex and all fireflies gets attracted to each other. (2) Firefly catches the attention of other firefly based on the brightness of light that it emits, increased bright light indicates the higher attractiveness between 2 fireflies, decreased light indicates the lower attractiveness between the two fireflies and they tend to move in a random manner to the firefly which have increased bright light. (3) The brightness of the firefly depends and described by the fitness function. Two variables are considered essential in AFA-ARM, which are used to control the behavior of the algorithm, which are (i) intensity of the light, (ii) attraction between fireflies. There will be a variation in light intensity based in the brightness. It is indicated and calculated using a fitness function. Attraction rate of individual firefly is mathematically expressed as Eqn. (1):
[ ] (1)
where indicates the attraction rate at zero distanceand for mathematical based calculation it is mostly assumed as 1, and indicates light absorbing rate value in air. denotes the distance that exist between the firefly in and positions. The space that exist between the fireflies determines the attraction with each other. The fireflies tend to change their position continuously because of their flying characteristics. The attraction rate that exist between two fireflies is entirely dependent on the space or distance among them. Euclidean distance is used to calculate the distance exist between any 2 fireflies, and it is mathematically expressed as Eqn. (2):
∫
(2)
where indicates the dimensionality issue, and is the th element indicating the position of firefly . After performing the calculation to find distance of two fireflies, brightness of the light are to be checked. If the firefly has decreased brightness than the firefly , then the attraction rate while firefly moves to the location of firefly is mathematically expressed as Eqn. (3):
(3)
Feature Selection Stage Model Construction Stage Classification Stage
3.1. Feature Selection Stage
Noisy and irrelevant data in dataset may lower the performance of classification to unexpected results. Hence, the feature selection was planned to utilize in AFA-ARM, which considers all the feature of firefly. Classification will be done only after filtrations are done. The final outcome of this feature selection stage ends with finding the relevant features (i.e., the informative fireflies)
3.2. Model Construction Stage.
In this model construction stage, the class that is stock price movement dataset is considered as the type of fireflies, where indicates the type of fireflies, and represent the classes that already exist. is a separate class that to be individually processed and it indirectly indicates the swarm of fireflies having the count has in ( ). is separated with 75:25 ratio, that is 75% for training the samples and 25% for testing the samples, with the condition classes in fireflies and every class holds contains samples for training. In this phase features of the firefly are extracted from class for developing class by applying firefly algorithm in order to select the fireflies that are very informative. Firefly algorithm is necessarily to be applied on every individual class by utilizing the fitness function to simulate the intensity. The extraction is done the presenter class to denote a specific class is considered as the informative firefly in the whole class. By following this procedure, different number of classes are created/separated, where each firefly swarms individually. The swarms that fly separately are categorized as superlative class. The main purpose of this stage is to make
a deep analysis to identify the new class which hold more information about that specific class. This stage has involved the below mentioned steps:
Finding the input for training the samples and segregate the individual class into a group.
Making assignment for the values which indicate the firefly position.
Compute the intensity of the firefly using the fitness function.
3.3. Classification Stage:
The classification stage will focus on testing the dataset. Count of the samples used for testing is denoted as and it is to be assumed as fireflies that are unknown and it flies in a random manner without worrying about any class. By assuming a random space holds multiple random fireflies that are identified to test samples, and represents the fireflies, where denotes the fireflies that are unseen so far. The main objective of this final stage is to find the class that are related to the testing samples . The processing of classification regarding the unseen fireflies are developed by three different methods, which are:
distance based classification intensity based classification
average intensity of class based classification.
The above mentioned optimization is inherited as a framework for performing the prediction task for stock market. It assumes frequency of all the data items that are similar. Sometimes, the rare items are considered as core important for multiple real-time applications (for instance- stock markets). However, the selection of maximum may miss few better rules or selecting minimum may add better uninteresting rules which leads to minimizing the efficiency because of adding many rules.
Pseudo-code of AFA-ARM
1.
2.
3.
4.
5.
6. { }
7.
8.
9.
10.
11.
12.
13.
14.
15.
16.
17.
4. ABOUT DATASET
Sixteen years of data of whole stock price indexes (CNX Nifty and S&P BSE Sensex) and two stocks (Infosys and Reliance) from Jan 1, 2003 to Dec 31, 2018 is utilized in this research work. All the data is acquired from
www.nseindia.com, www.bseindia.com, and
1544
5. PERFORMANCE METRICS
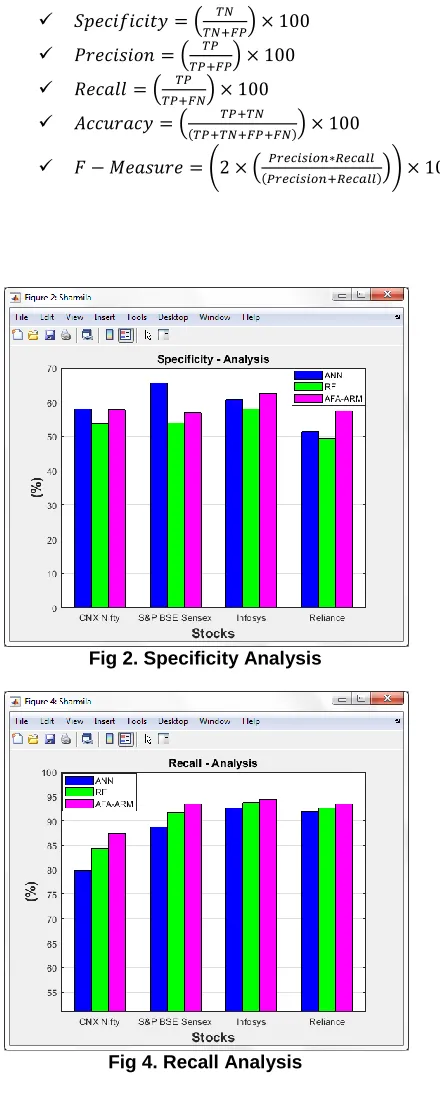
Sensititivty, Specificity, Precision, Recall, Accuracy and F-Measure are the metrics used to measure the performance of proposed algorithm with existing algorithms, where all the values are calculated from the parameters True Positive (TP), False Positive (FP), True Negative (TN) and False Negative (FN). Metric values and its formulae are projected below:.
( )
( ) ( ) ( )
( )
( ( ))
6. RESULTS AND DISCUSSION
Fig 1. Sensitivity Analysis Fig 2. Specificity Analysis
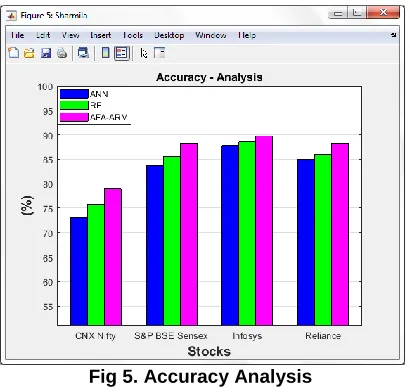
Fig 5. Accuracy Analysis Fig 6. F-Measure Analysis
From the Fig. 1 to Fig. 6, it is evident that the proposed algorithm AFA-ARM outperforms the RF [13] and ANN [14] with all the chosen performance metrics. It is because that FPSO classifies the records based on fuzzy technique by generating the rules in order to make effective classification, but the existing algorithms RF [13] and ANN [14] makes classification in the first in first out manner, which consumes more time also. Overall analysis of the research work founds that the proposed algorithm has its best performance in all the considered datasets.
7. CONCLUSION
This paper has focused to predict the movement of stock market and its price indexes. The ANN and RF performance models are compared with the proposed algorithm AFA-ARM based on sixteen years (2003 to 2018) historical dataset of Indian stock market companies CNX Nifty, S&P BSE Sensex, Infosys, and Reliance. The experiment results indicate that ANN models has low performance of 82.41% of accuracy and AFA-ARM has highest performance of 86.37% of accuracy.
References
[1]. S. Choudhury, S. Ghosh, A. Bhattacharya, K. J. Fernandes, M. K. Tiwari, “A real time clustering and SVM based price-volatility prediction for optimal trading strategy”, Neurocomputing, Volume 131, Pages 419-426, 2014.
[2]. M. Mozafari, R. Alizadeh, “A cellular learning automata model of investment behavior in the stock market,” Neurocomputing, Volume 122, Pages 470-479, 2013.
[3]. T. Kieu, B. Vo, T. Le, Z. Deng, B. Le, “Mining top-k co-occurrence items with sequential pattern,” Expert Systems with Applications, Volume 85, Pages 123-133, 2017.
[4]. H. Ryang, U. Yun, “High utility pattern mining over data streams with sliding window technique,” Expert Systems with Applications, Volume 57, Pages 214-231, 2016.
[5]. R. Dash, P. Dash, “Efficient stock price prediction using a Self Evolving Recurrent Neuro-Fuzzy Inference System optimized through a Modified Differential Harmony Search Technique,” Expert
Systems with Applications, Volume 52, Pages 75-90, 2016.
[6]. S. Barak, J. H. Dahooie, T. Tichý, “Wrapper ANFIS-ICA method to do stock market timing and feature selection on the basis of Japanese Candlestick,” Expert Systems with Applications, Volume 42, Issue 23, Pages 9221-9235, 2015.
[7]. S. Barak, M. Modarres, “Developing an approach to evaluate stocks by forecasting effective features with data mining methods,” Expert Systems with Applications, Volume 42, Issue 3, Pages 1325-1339, 2015.
[8]. B. Park, J. K. Bae, “Using machine learning algorithms for housing price prediction: The case of Fairfax County, Virginia housing data,” Expert Systems with Applications, Volume 42, Issue 6, Pages 2928-2934, 2015.
[9]. C. Chen, R. Chiang, T. Wu, H. Chu, “A combined
mining-based framework for predicting
telecommunications customer payment behaviors,” Expert Systems with Applications, Volume 40, Issue 16, Pages 6561-6569, 2013.
[10]. N. Oliveira, P. Cortez, N. Areal, “Stock market sentiment lexicon acquisition using microblogging data and statistical measures,” Decision Support Systems, Volume 85, Pages 62-73, 2016.
[11]. K. Nam, N. Seong, “Financial news-based stock movement prediction using causality analysis of influence in the Korean stock market”, Decision Support Systems, Volume 117, Pages 100-112, 2019. [12]. S. Aghabozorgi, Y. W. Teh, “Stock market co-movement assessment using a three-phase clustering method,” Expert Systems with Applications, Volume 41, Issue 4, Part 1, Pages 1301-1314, 2014.
[13]. J. Patel, S. Shah, P. Thakkar, K. Kotecha, "Predicting stock and stock price index movement using Trend Deterministic Data Preparation and machine learning techniques", Expert Systems with Applications, Volume 42, Pages 259-268, 2015.