Article
New Methods for Improved Prosumer Trading and
Energy Poverty Mitigation in Microgrids using
Crowdsourcing Concepts and Blockchain
Technologies
Bogdan-Constantin Neagu1,*, Ovidiu Ivanov1, Gheorghe Grigoraș1, Mihai Gavrilaș1 and Dumitru-Marcel Istrate1
1 Department of Power Engineering; Gheorghe Asachi Technical University of Iasi, Romania
* Correspondence: [email protected] (B.C.N.)
Received: date; Accepted: date; Published: date
Abstract: The deregulated markets have replaced the traditional way of trading electricity from the producers to the consumer, via government-owned organizations and regulated tariffs. Nowadays, electricity prices are determined by the offer-demand mechanism and consumers can negotiate tariffs with their supplier of choice. For classic wholesale suppliers, the tariffs are a result of the transactions performed on the wholesale market and the energy mix available in certain geographical regions. In parallel with becoming eligible and participating in retail electricity markets, the consumers use increasingly local generation sources based mostly on renewable energy technologies such as PV panels, and become prosumers. They want to be able to sell back to the market the generation surplus, in order to obtain the maximum benefits from their initial investment. Currently, several trading mechanisms for prosumers are available, ranging from the simplest, selling back the surplus to an aggregator at fixed tariffs, to more complex market schemes. This paper proposed a two-tier local market model for prosumers and consumers connected in microgrids, based on the blockchain technologies and other technologies and concepts such as remote sensing, smart grids, crowdsourcing and energy poverty.
Keywords: local electricity market, smart grids, distributed generation, prosumers, blockchain, energy poverty, market diversity.
1. Introduction
The European Commission's strategic framework envisages an improved and modernized European energy market, aimed at creating secure, sustainable, accessible, and decentralized energy networks in response to the global challenge of greenhouse gas emissions [1]. In the context of the next generation of digital energy networks, and in the presence of multiple decentralized microgrids, managing the energy generation from various and complementary sources will result in gaining more flexibility in meeting demand and lowering costs for the community. The adoption of a decentralized electricity distribution network, in which ordinary consumers can also be energy producers, named ‘prosumers’, and can sell their surplus generation to the network, thus getting involved in market transactions inside a community represents an alternative to current traditional networks. It is estimated that an increasing number of end-users will want to become active in the electricity sector, which will lead to a large number of transactions. A possible tool for enabling the creation of such microgrid-level markets is the blockchain technology which could provide secure and reliable means of communication and data management between the end-users [2].
The blockchain technology was created as a solution to the problem of mistrust and data security. The first steps in the development of technology were taken in 1991, when Stuart Haber and W. Scott Stornetta first spoke about a cryptographically secure blockchain [3]. In 1993, together with
Dave Bayer, they integrated optimal Merkel type trees in the concept [4]. Following the financial crisis of 2008, the concept of blockchain as a distributed database was developed, proposing a solution to change the way monetary transactions are carried out through various financial institutions. With the help of a peer-to-peer network and a distributed data server, a blockchain database can be autonomous [5].
In the recent years, billions of dollars have been invested in research on the blockchain technology in an attempt to make the most of its potential and understand how appropriate it is in the different economic domains [6]. But not all domains are fully ready to assimilate the blockchain technology. In each particular case, the current technological opportunities must be analyzed, as well as the challenges that the end-users face and how a new decentralized architecture could create value for them. The electricity industry is an extremely suitable candidate for blockchain technology-based innovation, with its complex supply chain with a need for increased transparency and improved data management and its highly transactional trading market that would benefit from fast settlement. The transparency and immutability of the blockchain can empower end-users of this industry and consumers.
A blockchain represents a decentralized ledger of transactions that take place in a network. This network consists of nodes owned by independent entities that use a cryptographic protocol to validate the transactions that are entered in the ledger and to ensure that the entered data cannot be altered or changed. It is immutable, secure, and completely transparent. Fully decentralized and replicated to node level, blockchain networks are harder to penetrate and manipulate by dangerous entities.
The blockchain system, coupled with other innovative technologies such as smart grids, big data mining and remote sensing, has the potential to provide solutions to various challenges in the energy sector and to contribute to the achievement of energy efficiency objectives, including to compensate for the funding gap for various projects in the field [7]. The technologies regarding blockchain-based platforms will lead to fundamental changes that will require the involvement of the distribution and supply companies, manufacturers of equipment, regulators, and last but not least end-users.
A review of renewable and sustainable energy published in [6] provides a systematic analysis of more than 140 blockchain research projects and startups in the energy sector, which span countries around the world. The electricity sector has a high potential to implement the blockchain technology as part of addressing several challenges [7], [8], [11], [12]:
• The climate change. The need to integrate renewable energy sources has led to the development of technologies such as photovoltaic panels and wind turbines, whose costs are constantly decreasing. The consumers that choose to install such generation sources become prosumers, which present a challenge for the current structure of electricity networks. They can create technical difficulties for the Distribution Network Operators (DNOs) in ensuring the energy balance. However, electricity generation at the household level (classically with PV panels on the roof) is a great opportunity for the development of blockchain technology-based architectures, because it capitalizes on the distributed nature of electricity generation with unprecedented efficiency.
• The development of technologies that allow the transition to active distribution networks. The technological solutions refer to the communications and networking components, inverters, bidirectional smart metering systems, energy storage solutions. This evolution allows greater control at network level. Electricity becomes a controllable, storable, and easily quantifiable product, being suitable for trading through smart contracts.
They also use the gains from RES energy generation to increase the living standards of vulnerable and low-income households.
• Simplifying the architecture of the current trading models. The implementation of a blockchain-based prosumer network leads to the elimination of a large number of intermediaries in the electricity trading process.
Among the technical advantages of this technology can be underlined the following: better management of power generation, fewer hours of supply interruption, secure energy transactions, increased distributed generation. The main economic advantages refer to protecting the identities of the traders, creating a distributed economy, reducing the tax burdens, data protection and control, and compensation for producers [12], [13].
Another concept that can be associated to local electricity trading in microgrids is the mitigation of energy poverty. ‘Energy poverty’ can be understood as the lack of access to clean, renewable, affordable energy, which leads to staggering energy bills [14]. It lies at the intersection of energy and social issues, as three interconnected causes are at play: high energy prices, reduced or stagnating incomes, and leaky, inefficient homes in urgent need of renovations.
The mitigation of energy poverty can be achieved using crowdsourcing, a concept first introduced in 2005 by James Surowiecki [15]. that can be defined as an emerging trend that utilizes contributions from peers and the collective wisdom of the crowd. It is important to build a service-based approach to make these crowdsourced sensor cloud data available. This can also be an effective means to enable the crowd to provide a service in a community within a geographical area by using their smart meters [16].
In Romania, according to Order 228 / 28.12.2018 published by ANRE (Regulation National Agency in the Energy Domain), the prosumers can trade the energy produced from renewable sources such as photovoltaic (PV), biomass, wind, cogeneration on the free market. Specifically, the suppliers are bound to buy the electricity generated by prosumers at the weighted average day-ahead market price from the previous year [17]. While the prosumer can sell its electricity generation surplus, the advantage for the supplier is the exemption from the payment of the distribution network tariff. This trading system is the most basic, limiting the options of both parties, prosumers who want to sell and consumers who want to buy electricity at lower prices [18]. More advanced trading models should be considered to increase the benefits of the prosumers and consumers which trade electricity in a local market organized at microgrid or community level.
Usually, in classic wholesale electricity markets, electricity is traded using bilateral contracts with negotiated prices, for long periods (years, months, weeks). This trading manner helps to reduce the prices for the buyers, and provides stability and predictability for the producers. For shorter trading intervals, in the day-ahead and intraday markets, the merit order mechanism is preferred, which ensures maximum benefits for producers when the demand is high and can lead for higher prices for suppliers and end-users.
On the other hand, the electricity quantities traded in local grids by prosumers are much smaller, and the trading intervals need to be smaller, because of renewable generation uncertainty. At the same time, the generation from prosumers needs to be incentivized, to promote the proliferation of renewable electricity. Thus, a market model for microgrids shod take into consideration creating advantages simultaneously for prosumers and consumers.
The remainder of the paper is structured as follows. Section 2 presents a literature review on the proposed problem highlighting the advantages of the proposed methodology. Section 3 describes the proposed algorithm. In section 4, a case study is performed, with a comparison between the proposed trading strategies, outlining their particularities. The paper ends with discussions and references.
2. Literature review
Recent studies have considered combining the operation of small-scale renewable energy sources (SSRES) in distribution networks and deregulated electricity markets. The range of these researches is covering unit commitment [19] and economic dispatch problems [20] in addition to scheduling of SSRES [21], and the uncertainty of renewable generation [22]. The main trends and approaches currently described in the literature are shortly summarized in the following paragraphs.
As it was presented in the introduction section, in Europe there are currently over 3400 green energy cooperatives (REScoop). In accordance with [23-26], the REScoop notion is defined in EU directives, as "local energy communities", according to data from the Federation of Green Energy Cooperatives in Europe. More than one million European citizens are participating in REScoops to invest together in the energy transition from fossil fuels to clean energy and energy efficiency. In Romania, starting in 2020, the first established REScoop proposes that future members who generate energy (prosumers) will be able to sell the surplus to other members, rather than to an aggregator, following the concept of ‘prosumer-friendly’ [27].
In another perspective, paper [28] considers a P2P energy trading method using a private Ethereum blockchain ledger where all bids are encrypted and peer matching is done on the encrypted offers by a functional encryption-based contract.
Regarding the energy crowdsourcing in prosumer-enabled electrical networks, a small number of published papers is available in the literature [16, 29]. The existing studies consider a two-stage algorithm for minimizing the cost of generation and the Joule losses by rescheduling users’ shapeable loads and SSRES ahead of time.
In other works, a particular local energy market model was considered in [30], that integrates different P2P energy trading platforms based on unidirectional market clearing price (MCP) for a microgrid. Moreover, the settlement type considers an MCP or P2P mechanism, in order to characterize the autonomous and interactive entities of local microgrids.
The future active distribution network (ADN) is a P2P community based on active energy agent (AEA) users [31]. The maximization of social welfare in the prosumers trading using auction-based mechanism is used in [32]. The same first author considers that in a microgrid the energy flows in a transactive way and the transactions are based on bilateral contracts between peers [33]. Another concept of prosumer surplus trading based on the transactive energy concept is proposed in the literature [34-37]. Paper [34] uses a Stackelberg game-based method for solving the transactive energy problem, in which the DNO and the SSRES aggregators are able to participate simultaneously in the Local Electricity Market (LEM) and Wholesale Electricity Market (WEM). A comprehensive cost-benefit model for prosumer load sharing has been proposed in [35], using the game theory and considering non-cooperative game models of the microgrids for prosumers energy surplus. In the same context, a particular social welfare-based concept on transactive energy or demand response (DR) is applied in [36, 37] using negotiated prices.
receives additional compensation which can take the form of tariff reductions, incentive payments, and invoice credits.
Using online platforms [40-46], the consumers can become prosumers, who create and distribute their own information about the energy generation. Some authors proposed a demurrage mechanism (DM) and Home Energy Management (HEM) for prosumers energy surplus in a LEM based on blockchain [41]. A particular P2P business model for 48 residential prosumers with PV panels installed in a Swedish village is proposed in [42]. This article identifies some new potential opportunities for optimizing the LEM and its variables for the best gain, taking into account that a significant influence is represented by the integration of energy demand, generation supply, and LEM rules. The aforementioned study can be used to provide information for policymakers to create a fair, useful, and cost-effective P2P energy framework for prosumers. Another comprehensive platform for prosumers digitalization was recommended in [43], and market simulations are developed in [44, 45] for consumers integration in microgrids. In the same manner, a virtual platform was proposed in [46] for an efficient management of multiple energy prosumers (MEP).
The presence of decentralized energy sources demands the analysis of the problem of continuity of energy supply to operators whose activities significantly depend on electricity. There are EU countries where the power outages amount to about 20 minutes per year, but in other cases the average power outages range from 450 to 500 minutes [47]. Prosumers' micro-installations ensure the business continuity for producers in such countries and negotiated surplus trading increases social welfare [48]. Because the SSRES efficiency depends on atmospheric conditions and regional climate, even small and fast changes in meteorological conditions can cause significant variability in power generation at different time and space scales. Methodologies based on the remote sensing of the atmospheric conditions are the primary source of information for the development of numerical models that aim at supporting the planning and operation of an electric system with a substantial contribution of intermittent energy sources [49]. For local trading of such electricity surplus, the LEM operators consider the blockchain concept [11, 12, 16, 28, 29, 40, 41, 48], or direct bilateral contracts [50, 51]. These market models aim to provide secure and affordable energy supply for the end user, which is essential for the functioning of an economy in which energy poverty is reduced and the needs of vulnerable social groups are taken into account [52].
The main concepts taken from the literature and discussed above are compared with the market model proposed in the paper, in Table 1. In addition, the last column considers the type of settlement used in the market.
Table 1. A comparative state of the art between the proposed method and the literature survey.
Reference
no. Blockchain
P2P contracts
Energy
Crowdsourcing REScoop
Energy Poverty
Type of settlement
[16], [29] Yes Yes Yes No No Negotiated
[28] Yes Yes No Yes No Negotiated
[24, 25], [44], [49] No No No Yes No Negotiated
[26, 27] Yes No No Yes No Negotiated
[30-32], [35], [38],
[42] No Yes No No No
Negotiated, MCP [33, 34], [36, 37],
[43], [45] No No No No No Negotiated
[39], [46], [50, 51],
[54] No Yes No Yes No Negotiated
[40, 41] Yes Yes No No No Negotiated
[48] Yes No No No No Negotiated
Proposed method Yes Yes Yes Yes Yes Negotiated,
MCP
management taking into account that the solution with local energy storage systems (as is Battery Banks) too expensive [53, 54], and without technical possibility for energy poverty mitigation.
3. Materials and Methods
In LV electricity distribution networks or local microgrids, there is an increasingly larger number of residential consumers who are opting to install local generation resources in order to gain independence from the grid. The predominant choice is the use of PV panels systems, that are easier to install at household residences and provide energy by converting the solar irradiation into electricity. This trend is incentivized by the subsidies offered by governments worldwide. As the number of individual houses adopting this technology increases, new opportunities arise regarding the trading models used for selling the excess generation. Residences become prosumers, entities capable of consuming, producing and selling electricity. The prosumers will use their own generated electricity mainly to cover their individual consumption, and when the generation exceeds this amount, will sell the surplus back to the grid. As described in the introduction section, the simplest method of surplus trading is to sell back the entire available quantity back to the supplier, though an aggregator entity, at a regulated price. However, this is the least profitable approach, as the regulated prices are usually low [55], and the benefits can be seen only by the suppliers / network operators, and the prosumers. New trading methods for microgrids are currently envisioned in the literature, aiming to create local electricity markets that would provide benefits for all the players involved (aggregators, prosumers and consumers). A main requirement for implementing such initiatives is the conversion of the classic electricity distribution infrastructures into intelligent or smart grids, capable of real time communication between the supply and consumer buses, and centralized operation management and data processing at microgrid level.
In line with these trends, previous research efforts by the authors [40] proposed an algorithm for electricity transactions at microgrid level between prosumers and consumers, using P2P contracts and the blockchain technology. The market mechanism considers trading priorities set at central level and based by consumer or prosumer prices, or custom priorities determined by the prosumer-consumer geographical distances and the ‘first-come-first-served’ (FCFS) principle.
This paper extends the previous research considering an improved and extended market model, with two trading phases (primary and secondary). The primary market includes the blockchain approach from [40] and adds a supplementary trading method, based on the merit order used in wholesale markets. These methods can be used as alternatives for trading.
A second market segment, with two tiers, is proposed to help the prosumers and consumers to better manage the sell and buy offers that can be affected by errors. Crowdsourcing and Energy Poverty Mitigation are used for this purpose.
The sell offers are the result of the surplus that the prosumers can generate but cannot use locally. The buy offers placed by the consumers in the local market are usually the result of forecasts made with variable precision. In the case of trading electricity obtained from PV panels, the forecasts must consider weather data obtained with technologies such as remote sensing and big data mining. Thus, the offers placed by the consumers in the market can be affected by errors which will result in mismatches between the needed and traded quantities.
In the Romanian market model, when the electricity acquired from the local market would be less than the demand, the consumers would buy the rest at higher prices, from the national grid, and the generators are forced to sell any surplus to the aggregator, at a lower price.
On the other hand, if trading is performed in a local market, when the consumers forecasts are higher than the actual demand, the buyers would be forced to sell the excess quantities to the aggregator, if sufficient and cheap storage facilities are not available.
The newly proposed algorithm provides market mechanisms designed to alleviate these problems.
The following general assumptions are used:
o A primary market based on the blockchain technology, for ensuring the anonymity and security of the placed orders.
o A secondary market with a two-tier trading mechanism for minimizing the imbalance between the offers placed in the blockchain system and the actual traded quantities. • The primary market can use two alternative price-setting methods based on the blockchain
technology: the ‘first-come-first-served’ (FCFS) method or the merit order method used in traditional day-ahead markets.
• The secondary market provides two optional trading tiers:
o The energy poverty mitigation tier, aimed at low-income consumers which otherwise would not afford to participate in the market.
o The commercial tier, with two options, aimed for expanding the market through crowdsourcing, with two types of consumers: those participating occasionally, in exchange for a fee, and consumers who do not participate directly with offers, but are represented (invited) in the market by other consumers.
• For the invite option of the commercial tier, any consumer Ci can acquire electricity from the second market layer only if has signed previously a P2P contract with a specific prosumer Pj.
• The selling price of a prosumer or consumer can vary hourly, but in the paper is considered fixed for all trading intervals of a day. This approach is modelling the practice used for traditional differentiated tariffs where the peak and night prices are outside the hours when PV panels can generate electricity, and the case where
• No storage capabilities are installed in the network. Electricity is sold on the market for the surplus intervals, and settlement is performed at the end of each trading interval.
• If the local generation exceeds the local demand traded in the market, the surplus will be sold to the aggregator / market administrator, at regulated tariffs.
• The secondary two-tier market components are optional, but the case study considers all the available options, in order to better demonstrate the advantages of the proposed trading algorithm.
The basic flowchart of the algorithm is shown in Figure 1, followed by the description of each of its main elements.
Figure 1. The basic diagram of the proposed market algorithm
3.1. Input data for the local market
The input data required for trading refers to the quantities and prices associated to the consumption and local generation existing in the market. This information is provided in six matrices:
for generation quantity, offers and price offers, where NCM and NPM are the number of consumers and prosumers participating at hour h in the market. It is considered that generally NCM<NC and
NPM<NP, NC and NP being the number of consumers and prosumers connected in the microgrid. Trading in the primary market can occur at any hour h when there are consumer buying offers placed in the blockchain system (1), and there is generation surplus offered for selling (2).
1
, 0
=
NCM
i
CO(h i) (1)
1
, 0
=
NPM
j
GO(h j) (2)
Surplus occurs when the local generation of a prosumer exceeds its individual consumption (3) and the surplus is traded in the market (4).
, , , , =1..
S(h j) = G(h j) - C(h j) j NPM (3)
, ,
S(h j) OG(h j) (4)
The consumer quantity offers for the primary market use two types of representation:
• as actual consumption value measured in [W], when the price is set according to the blockchain priority model, as in [40],
• as a multiple of 100W for the price setting according to the day-ahead merit order model used in wholesale markets.
The prosumers can choose to sell their surplus directly to the aggregator, for a fixed regulated tariff, or in the primary local market. In the paper, it is considered that all the available surplus is traded through sell offers placed in the market blockchain system.
The secondary market is activated at any hour h when at least one of the following conditions is fulfilled:
• The sum of the buy offers is lower than the aggregated offers placed by the prosumers, i.e. the prosumers need to sell remaining surplus:
1 1
= =
NCM NPM
i j
CO(h,i) GO(h, j) (5)
• The buy offer of a consumer i is greater than the actual consumption, because of the forecast error or representation model used in the market (multiple of 100 kW).
, , , =1..
CO(h i) TCO(h i) i NCM (6)
where TCO(h,i) is the quantity of electricity actually traded by the consumer i at hour h, which can be equal or less than the offer placed in the market.
3.2. The primary market
This market segment is the main trading tool for the prosumers and consumers in the microgrid. As outlined previously, two alternatives are provided for determining the consumer and prosumer trading priority: ‘first-come-first served’ and merit order. Both methods use the consumer (buy) and prosumer (sell) offers placed in a centralized secure and anonymous blockchain system established at microgrid or market level. The blockchain system is preferred because it guarantees trading fairness, all players being unaware of the offers placed by others, thus minimizing the risk of market manipulation.
• Consumers place in the market buy offers for the entire consumption at hour h, in order to minimize their electricity bill by attempting to buy the maximum quantity of electricity from the local market, al tower prices, rather than the main grid, at higher prices.
• Consumers place in the market buy offers determined by forecast techniques using big data analysis or remote sensing techniques.
The first type of offers is used in the FCFS trading method, where a generic consumer i places fixed-price-per-kWh and variable quantity offers, the trading order being determined by the time tag of the offer. The quantities for these offers are determined in the settlement phase, based on consumption measurements taken from the microgrid. The flowchart of this trading method is given in Figure 2.
Figure 2.The basic diagram of the primary market ‘first-come-first-served’ trading mechanism
The second type of offer is used in the merit order trading mechanism. The buy offer prices and quantities are placed in the blockchain system by the consumers before the trading interval. Quantities are given as multiples of 100 W and prices are given for each kWh. The trading order and price is determined by the standard merit order method, provided in Figure 3, where the trading price is determined as the market clearing price (MCP). The flowchart of this trading method is given in Figure 4.
For both methods, the prosumer sell offers are given as the full available surplus S(i,h), in kWh. The maximum amount of traded electricity TC is determined by the minimum between the aggregated buy and sell offers:
1 1
min ,
= =
=
NCM NPM
i j
TC CO(h,i) GO(h, j) (7)
Figure 3. The merit order trading mechanism
Figure 4. The basic diagram of the primary market merit order trading mechanism
, , ,
TP(h t) = C(h t) P(h t) (8)
The basic flowchart of the primary market algorithm uses the steps presented in Figure 5.
Figure 5. The flowchart of the primary market trading algorithm
The trading mechanisms used in the primary market can lead to electricity quantities that cannot be traded locally. Three scenarios can lead to this situation:
• At given hours, the total local generation available in the market (sell offers) exceed the total consumption (buy offers).
• If the merit order method is used, the buy offers are given as multiple of 100 W, while the sell offers are the S(h,i) quantities. This leads to S(h,i) fractions that cannot be fulfilled.
• The consumers place in the market buy offers that exceed their real consumption, following forecast errors or significant accidental deviations from the daily demand pattern.
All these quantities can amount to a important value over longer time periods. If they are not traded in the local market, the prosumers would sell surplus at minimum price to the aggregator, while the consumers would buy electricity at standard, high tariffs.
The algorithm proposed in the paper offers the possibility of extending the primary market with a two-tier secondary market, in order to make prosumer and consumer surplus quantities available for trading in the local network.
3.3. The secondary market – the energy poverty tier
The local market is profitable mostly to consumers with high demand, which can better benefit for the energy cost reduction obtained from the price difference between the grid tariffs and the price offers per kWh offered by the local producers. These consumers are also usually those who have the financial resources to install the physical and software infrastructure required to access the market.
On the other hand, amongst the consumers connected in a microgrid can exist a number of low-income consumers, who in traditional networks would be classified as belonging to vulnerable categories and suffer from energy poverty. The paper proposes an optional secondary market tier in which the surplus that cannot be traded in the primary market would be automatically allocated in the initial settlement phase (see Figure 1) to such vulnerable consumers who, in normal conditions, would not be able to access the local market.
The surplus can come from both prosumers and consumers, as summarized in the previous subsection. In all the cases, the electricity quantities will result from the mismatch between the quantities offered for trading (higher) –CO(h,i) or GO(h,j)– and actual traded quantity, determined by the existing (lower) generation availability TC(h,j) or realized consumption TC(h,i):
, ,
TC(h,i) = CO(h,i) - TC(h,i), i = 1...NCM for consumers
TC(h, j) = GO(h, j) - TC(h, j), j = 1...NPM for prosumers (9)
Thus, consumers that were buyers in the primary market can act as sellers in the secondary market, together with the prosumers.
The quantities sold to vulnerable consumers in the secondary market are determined using the merit order method where the buyers’ prices are set as 0 mu/kWh (mu is the monetary units) and the quantities are ranked in descending order. The cost for traded kWh can be set using as reference the price obtained by the seller in the primary market, the original price offer placed by the seller in the primary market or an agreed fixed tariff, according to the policy agreed in the local market.
settlement of the primary market can sell electricity at higher prices than the tariff used by the aggregator.
The flowchart of the first tier of the secondary market is presented in Figure 6.
Figure 6. The flowchart of the social inclusion tier of the secondary market
Since the demand of the vulnerable consumers selected for the energy poverty tier is expected to be low, the remaining surplus after the settlement of the first tier can be further traded in a second tier, reserved for commercial trading.
3.4. The secondary market – the commercial tier
The commercial tier of the secondary market is designed to incentivize market diversity by allowing other consumers to participate in trading. Several consumer categories are envisioned. Some consumers would not trade continuously and would seek only occasional access to the market, buying the local generation surplus to supply automated receptors such as greenhouse irrigation systems in given hours of preset days. Other types of occasional consumers could benefit from the price difference when trading on the local market, but the initial investment for the infrastructure required to get access to the market would be prohibitive.
Two options are available in the algorithm for this trading segment: • Option 1: Fee-access.
• Option 2: Invite-access.
In the fee-access model, the consumers who need only occasionally access to the market can submit offers in the secondary market to gain priority access for the surplus remaining after the settlement of the primary market offers. The trading model considers the merit-order priority method described in Figure 5 for the primary market, but where the consumers offer to buy from the market their entire consumption measured in the trading interval, at the lowest price plus a fixed percent fee from the value of the transaction. The merit order is used to determine the succession in which the offers are fulfilled. The financial settlement is made using the MCP, the consumer or the prosumer price offers for all transactions, according to the market policy, and then a fee f% is added to the price resulting from the trading mechanism.
(
)
, +(1 )
TP(h i) = C(h,i) PCO(h,i),PGO(h, j) or MCP(h) f% (10)
The basic flowchart of the fee-access secondary market model is presented in Figure 7.
Figure 7. The flowchart of the secondary market fee-access model
In the invite-access model, existing market players can act as subcontractors for other consumers from the microgrid. Certain prosumers or consumers can still have surplus quantities unsold after the previous settlement sessions have been completed. In order to avoid getting the lowest price per kWh from the market aggregator, they can optionally choose a partner from the microgrid to which the remaining quantities will be sold. The transactions are based on P2P contracts existing between the two entities and notified to the market administrator, which is responsible for the final settlement at market level. The settlement price is agreed between the parties, chosen from the vendor and buyer offers.
Figure 8. The flowchart of the secondary market invite-access model
It should be noted that the secondary market models are optional and their order of activation can be changed, according to the priorities of a specific microgrid. Instances can exist where the energy poverty mitigation tier is absent or one or both segments of the secondary commercial tier are used.
4. Results
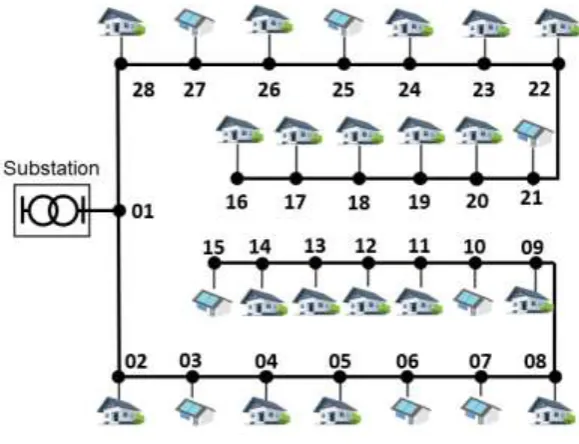
The new market was tested on a real low voltage (LV) electricity distribution network from Romania, with 28 buses and two four-wire three-phase bundled feeders, with an average distance between the connection points of 40 meters. The network supplies only single-phase residential consumers, some of which also have PV generation capabilities. The load and generation profiles used in the study are considered as daily 24-hour measured values, as provided from the smart metering infrastructure existing in the LV microgrid. The 24-hourly load profiles for the network buses are presented in Table A1 from Appendix A.
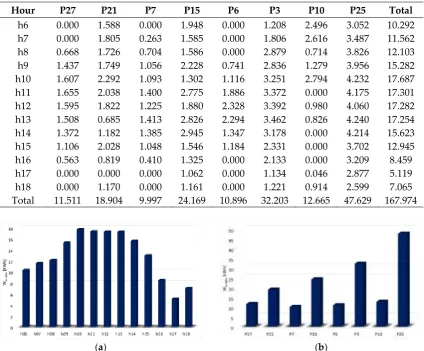
Each bus, except bus 1, which is a branching point, has one residence connected. The prosumers are located at buses 3, 6, 7, 10, 15, 25 and 27, as shown in the one-line diagram from Figure 9. Their 24-hour generation profiles were modeled using representative data for this type of generation and are provided in Appendix A, Table A2. The prosumers will use the generated electricity primarily for supplying their own hourly demand, and wish to sell the remaining surplus to the consumers participating in the local market set up at microgrid level and managed by a non-profit aggregator. From Table 2 and Figure 10, it is seen that generation occurs only in the 06:00 – 18.00 interval, when solar energy is available. The surplus is maximized in the 10:00 – 13:00 interval and minimized towards the evening time, when the peak load hours are near.
Table 2. The prosumers electricity surplus, in kWh.
Hour P27 P21 P7 P15 P6 P3 P10 P25 Total
h6 0.000 1.588 0.000 1.948 0.000 1.208 2.496 3.052 10.292 h7 0.000 1.805 0.263 1.585 0.000 1.806 2.616 3.487 11.562 h8 0.668 1.726 0.704 1.586 0.000 2.879 0.714 3.826 12.103 h9 1.437 1.749 1.056 2.228 0.741 2.836 1.279 3.956 15.282 h10 1.607 2.292 1.093 1.302 1.116 3.251 2.794 4.232 17.687 h11 1.655 2.038 1.400 2.775 1.886 3.372 0.000 4.175 17.301 h12 1.595 1.822 1.225 1.880 2.328 3.392 0.980 4.060 17.282 h13 1.508 0.685 1.413 2.826 2.294 3.462 0.826 4.240 17.254 h14 1.372 1.182 1.385 2.945 1.347 3.178 0.000 4.214 15.623 h15 1.106 2.028 1.048 1.546 1.184 2.331 0.000 3.702 12.945 h16 0.563 0.819 0.410 1.325 0.000 2.133 0.000 3.209 8.459 h17 0.000 0.000 0.000 1.062 0.000 1.134 0.046 2.877 5.119 h18 0.000 1.170 0.000 1.161 0.000 1.221 0.914 2.599 7.065 Total 11.511 18.904 9.997 24.169 10.896 32.203 12.665 47.629 167.974
(a) (b)
Figure 10. The total electricity surplus: (a) hourly; (b) for each prosumer.
4.1. The primary market
From the 27 consumers existing in the microgrid, the case study considers that only 11 are participating in the primary market as buyers (from buses 5, 8, 9, 11, 12, 14, 16, 19, 20, 24, 26), chosen mainly between the residences with high daily electricity demand. For each hour h, they can submit to the market two type of offers regarding the traded quantity: the entire hourly demand and forecasted values, multiple of 100 kW, as discussed in Section 3.2. For the forecasted offers, the values used in the case study are given in Table A3 from Appendix A, and in Figure 11, only for the hour intervals where prosumer generation exists.
The sellers that place offers in the primary market are the prosumers with generation surplus. It is considered that they wish to sell the entire surplus on the market, to maximize their revenue. The quantities offered, derived from Tables A1 and A2, are presented in Table 2 and Figure 10, where it can be seen that surplus exists for trading in all hourly intervals from 06:00 to 18:00, but there are prosumers who cannot trade electricity at some hours (for example, P27 or P6).
In the absence of the local market, the total electricity surplus quantity (167.97 kWh) would be traded by the aggregator back in the grid, at a regulated tariff. Using the reference value of 0.251 mu/kWh applied in Romania [56, 57], the total revenue of the prosumers would be of 42.16 mu/day. For demonstrating the advantages and disadvantages of each trading priority method used in the market, FCFS and MO, the case study results are be provided as comparisons between these alternatives.
As it can be seen from Figure 11, there are hours when the MO offers differ from the total demand used in the FCFS offers. This can happen because of two reasons: the forecast error and the standardized offer type (multiple of 100 W) used by the MO method. On the other hand, the offers placed by the consumers in the market are identical for both trading methods, and equal to the available surplus (Figure 10), because one of the main objectives of the local market is to enable prosumers to sell the entire surplus locally, and offers given as multiples of 100 W would impede in achieving this goal.
(a) (b)
Figure 11. The buyer quantity offers in the primary market: (a) hourly; (b) for each consumer
The traded quantities and revenues / costs for each prosumer / consumer and hourly interval are given in Figures 12-13 and Tables 3-6.
(a) (b)
Figure 12. The traded quantities of the sellers in the primary market: (a) hourly; (b) for each prosumer
(a) (b)
Table 3. The daily offer, traded and remaining quantities for each buyer in the primary market, kWh
Consumer C5 C8 C9 C11 C12 C14 C16 C19 C20 C24 C26 Total Consumption
(offers FCFS) 21.25 24.44 30.70 18.96 8.79 20.92 23.84 4.08 12.90 25.27 12.26 203.41 offers MO 23.2 25.30 30.9 16.50 9.30 20.80 23.8 4.10 11.80 25.20 12.50 203.40 traded FCFS 17.32 20.29 25.07 15.33 6.04 13.20 16.54 3.08 9.05 21.04 9.44 156.40 traded MO 12.55 25.30 26.42 10.30 4.85 20.80 16.36 1.40 7.40 24.02 4.70 154.10 rem. FCFS 3.93 4.15 5.62 3.64 2.75 7.72 7.30 1.01 3.85 4.23 2.82 47.01 rem. MO 10.65 0 4.48 6.20 4.45 0 7.44 2.70 4.40 1.18 7.80 49.30
Table 4. The hourly offer, traded and remaining quantities in the primary market for all buyers, kWh
Hour h06 h07 h08 h09 h10 h11 h12 h13 h14 h15 h16 h17 h18 Total Consumption
(offer FCFS) 11.8 14.06 18.87 13.47 13.55 14.96 16.04 18.16 13.7 12.83 15.23 20.77 19.99 203.43 offer MO 12.1 14.9 17.5 13.6 13.6 14.7 13.6 18.3 13.8 14 15.8 20.5 21 203.40 traded FCFS 10.29 11.56 12.1 13.47 13.55 14.96 16.04 17.25 13.7 12.83 8.46 5.12 7.07 156.40 traded MO 10.29 11.56 12.1 13.6 13.6 14.7 13.6 17.25 13.8 12.95 8.46 5.12 7.07 154.10 rem. FCFS 1.51 2.5 6.77 0 0 0 0 0.91 0 0 6.77 15.65 12.92 47.03 rem. MO 1.81 3.34 5.40 0 0 0 0 1.05 0 1.05 7.34 15.38 13.93 49.30
Table 5. The daily offer, traded and remaining quantities for each seller in the primary market, kWh
Prosumer P27 P21 P7 P15 P6 P3 P10 P25 Total surplus 11.51 18.90 10.00 24.17 10.90 32.20 12.67 47.63 167.97 traded FCFS 11.51 17.72 9.88 22.87 8.92 25.20 12.67 47.63 156.40 traded MO 11.51 9.89 10.00 19.80 10.90 31.71 12.67 47.63 154.10 rem. FCFS 0 1.18 0.11 1.30 1.98 7.00 0 0 11.58
rem. MO 0 9.02 0 4.37 0 0.49 0 0 13.88
Table 6. The hourly offer, traded and remaining quantities in the primary market, for all sellers, kWh
Hour h06 h07 h08 h09 h10 h11 h12 h13 h14 h15 h16 h17 h18 Total
Surplus 10.29 11.56 12.10 15.28 17.69 17.30 17.28 17.25 15.62 12.95 8.46 5.12 7.07 167.97 traded FCFS 10.29 11.56 12.10 13.47 13.55 14.96 16.04 17.25 13.70 12.83 8.46 5.12 7.07 156.40 traded MO 10.29 11.56 12.10 13.60 13.60 14.70 13.60 17.25 13.80 12.95 8.46 5.12 7.07 154.10 rem. FCFS 0 0 0 1.82 4.14 2.35 1.24 0 1.92 0.11 0 0 0 11.58 rem. MO 0 0 0 1.68 4.09 2.60 3.68 0 1.82 0 0 0 0 13.88
The data from Tables 3-6 shows some interesting results regarding the hourly and daily offers and traded quantities, for the consumers and prosumers.
The local generation surplus (167.97 kW) is insufficient to supply all the consumer needs (203.43 kWh). From Table 3, it is seen that, for the chosen consumption, local generation and primary market offers, when using the FCFS trading priority, the consumers can trade quantities lower than their consumption, and will need to buy the rest from the grid, at higher tariffs. If the MO trading priority is used, Table 4 shows that the hourly buy offers placed by the consumers are usually not fully fulfilled, but the traded quantities exceed the consumption.; This lead to surplus at the consumers, which will be traded to the grid, at regulated tariffs, or sold in the secondary market.
surplus offers can be matched more closely by the consumer offers. This means that if the MO trading priority is used, it is expected to have more surplus unsold to the local consumers, thus reducing the profitability of the prosumers. In this case, they would have to sell extra surplus to the grid, in exchange for the regulated tariff, which is lower than the local consumer offers. As it can be seen from Table 6, the generation surplus remaining after the primary market is concentrated in the 09:00 – 14:00 interval, while the evening and morning intervals see the highest deficit in local generation (Table 4). The profitability of the FCFS and MO trading priorities can be assessed from Figure 14 and Tables 7-8 for the buyers and Figure 15 and Tables 9-10 for the sellers. The market model offers the possibility of performing financial settlement in three assumptions for the prices: using the market clearing price (MCP), the consumer offers (COP) and the prosumer offers (POP), because different
(a) (b)
(c) (d)
Figure 14. The primary market cost for buyers: (a) The hourly values, FCFS; (b) The values for each consumer, FCFS; (c) The hourly values, MO; (d) The values for each consumer, MO.
Table 7. The daily cost for each buyer in the primary market, mu
Consumers C5 C8 C9 C11 C12 C14 C16 C19 C20 C24 C26 Total
F
CFS
MCP 8.28 9.23 11.30 6.96 2.70 5.87 7.59 1.36 4.00 9.42 4.39 71.11 COP 7.80 12.17 13.79 7.97 2.90 7.92 8.10 1.20 4.98 11.99 4.72 83.54 POP 8.28 9.23 11.30 6.96 2.70 5.87 7.59 1.36 4.00 9.42 4.39 71.11
MO
MCP 6.40 13.15 13.91 5.44 2.47 10.89 8.49 0.68 3.94 12.53 2.46 80.36 COP 5.65 15.18 14.53 5.36 2.33 12.48 8.01 0.55 4.07 13.69 2.35 84.20 POP 6.03 10.52 11.79 4.80 2.34 9.00 7.91 0.67 3.41 10.56 2.25 69.28
Table 8. The hourly cost in the primary market for all buyers, mu
Consumers h06 h07 h08 h09 h10 h11 h12 h13 h14 h15 h16 h17 h18 Total
F
CFS
MCP 4.74 5.31 5.58 6.11 6.06 6.81 7.30 7.73 6.12 5.90 3.87 2.30 3.28 71.11 COP 5.60 6.33 6.21 7.20 7.35 7.84 8.51 9.12 7.51 7.06 4.42 2.61 3.79 83.54 POP 4.74 5.31 5.58 6.11 6.06 6.81 7.30 7.73 6.12 5.90 3.87 2.30 3.28 71.11
MO
(a) (b)
(c) (d)
Figure 15. The primary market revenue for sellers: (a) The hourly values, FCFS; (b) The values for each prosumer, FCFS; (c) The hourly values, MO; (d) The values for each prosumer, MO.
Table 9. The daily revenue for each seller in the primary market, mu
Prosumers P27 P21 P7 P15 P6 P3 P10 P25 Total
F
CFS
MCP 4.95 9.75 3.95 10.98 3.83 11.85 5.32 20.48 71.11 COP 6.02 9.04 5.15 11.86 4.74 13.95 7.04 25.74 83.54 POP 4.95 9.75 3.95 10.98 3.83 11.85 5.32 20.48 71.11
MO
MCP 5.88 5.44 5.13 10.50 5.51 16.44 6.67 24.78 80.36 COP 6.11 4.98 6.00 9.80 5.90 16.25 7.54 27.61 84.20 POP 4.95 5.44 4.00 9.51 4.69 14.90 5.32 20.48 69.28
Table 10. The hourly revenue in the primary market for all sellers, mu
Prosumers h06 h07 h08 h09 h10 h11 h12 h13 h14 h15 h16 h17 h18 total
F
CFS
MCP 4.74 5.31 5.58 6.11 6.06 6.81 7.30 7.73 6.12 5.90 3.87 2.30 3.28 71.11 COP 5.60 6.33 6.21 7.20 7.35 7.84 8.51 9.12 7.51 7.06 4.42 2.61 3.79 83.54 POP 4.74 5.31 5.58 6.11 6.06 6.81 7.30 7.73 6.12 5.90 3.87 2.30 3.28 71.11
MO
MCP 5.66 6.36 6.66 7.48 6.39 7.06 6.53 9.49 6.62 7.12 4.65 2.46 3.89 80.36 COP 5.66 6.43 6.60 7.28 7.33 7.68 7.26 9.13 7.53 7.18 4.90 3.05 4.15 84.20 POP 4.74 5.31 5.58 6.04 5.90 6.52 5.94 7.73 6.13 5.95 3.87 2.30 3.28 69.28
microgrids can pursue different objectives when establishing the local market. For example, using POP coupled with MO in the primary market can be an advantage for the buying consumers, who will buy electricity with lower prices from the local prosumers, instead of paying the standard residential tariff. Using the MCP favors the prosumers with lower prices. In generation surplus scenarios, they can sell electricity at a higher clearing price. Using the COP will be an advantage for the prosumers, which will be able to obtain settlement prices larger than their initial offers.
The sellers/vendors with the highest cost/revenue can be considered as making the most profit, because quantities are bought by consumers at a price lower than the standard LV residential tariff, while the sell offers are settled by the vendors at a price higher than the resell tariff to the grid.
trading priority is used, the MCP and POP settlements give the same results, because the methodology from [40] uses as settlement price the prosumer offers, and the MCP and POP trading priorities would result the same, as the buy offer price is not relevant and thus considered 0 um/kWh for all buyers. For the MO trading priority, the MCP settlement results in higher trading prices than POP, because the trading price for all sellers and buyers is determined by the price unrestricted merit order used in wholesale markets (Figure 3).
As it can be seen from Tables 7-10, the players who get the most advantage from the local market are C8, C9, C24, the consumers without generation capability that have the highest demand, and P15, P3, P25, the prosumers with the largest daily surplus.
4.2. The secondary market – the energy poverty mitigation tier
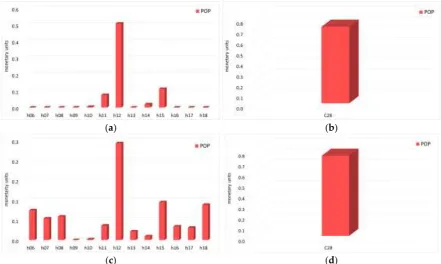
The proposed local market model uses in the secondary market an optional energy poverty mitigation tier, designed to include a category of consumers that can usually will not be able to trade on the market because of their low income or other social vulnerabilities. The microgrid community can decide to assist these consumers by supporting the reduction of their electricity bill. The simplest way to achieve this goal is to automatically allocate the prosumer surplus available after the settlement of the primary market to cover the demand of such consumers. In the data used for the case study, a single consumer, C28, fulfills the requirements of a vulnerable consumer. As seen in Table A1, its total daily consumption amounts to 3.31 kWh, with 1.79 kWh in the 06:00 – 18:00 interval.
Since the two trading priority methods (FCFS and MO) give in the primary market different results regarding the trading participants and quantities at each hour, a similar behavior is propagated in the secondary market. Thus, the trading results will be presented in the same manner as for the primary market, as a comparison between the cases in which the primary market uses the FCFS or the MO in determining the priorities of the traded quantities. It is considered that the secondary market uses the same price offers entered in the blockchain system for the primary market. According to the data from Tables 3 and 5, after the settlement of the primary market, prosumers P21, P7, P15, P6, P3, P25 have unsold surplus if the FCFS trading priority is used. No consumers can participate in the secondary market, because they cannot have surplus after trading. If the MO priority is used, the prosumers with available surplus are P21, P15, P3, and also there are consumers which have placed in the primary market offers exceeding their real consumption, and can become sellers on the secondary market (C5, C9, C11, C12, C16, C19, C20, C24, C26). The hours in which the sellers are having surplus after the primary market are presented in Appendix B, Table B1 and B2.
The only entity buying in this market is C28, and its hourly buy offer match its entire consumption (See Table A1). However, these are total quantities, and each seller can trade different surplus quantities in each hour. This will lead to the necessity of prioritization of the sell offers, and subsequent settlement between C28 and possibly multiple sellers. The quantities traded hourly are presented in Appendix B, Table B3 and B4. The sell offers and traded quantities are given in Figures 16 and 17. Tables 11-14 summarize the daily and hourly offers and quantities traded by buyers and sellers.
(a) (b)
(a) (b)
Figure 17. The traded quantities of the vendors in the energy poverty mitigation market: (a) hourly; (b) for each prosumer
Table 11. The daily traded quantities for consumer C28 in the energy poverty mitigation market, kWh
Consumer C28
Consumption (offers FCFS) 1.79
offers MO 1.79
traded FCFS 0.72
traded MO 1.79
rem. FCFS 1.07
rem. MO 0
Table 12. The hourly traded quantities in the poverty mitigation market for consumer C28, kWh
Hour h06 h07 h08 h09 h10 h11 h12 h13 h14 h15 h16 h17 h18 Total
Consumption
(offer FCFS) 0.19 0.14 0.15 0 0 0.08 0.51 0.06 0.02 0.24 0.09 0.08 0.23 1.79 offer MO 0.19 0.14 0.15 0 0 0.08 0.51 0.06 0.02 0.24 0.09 0.08 0.23 1.79 traded FCFS 0 0 0 0 0 0.08 0.51 0 0.02 0.11 0 0 0 0.72 traded MO 0.19 0.14 0.15 0 0 0.08 0.51 0.06 0.02 0.24 0.09 0.08 0.23 1.79 rem. FCFS 0.19 0.14 0.15 0 0 0 0 0.06 0 0.13 0.09 0.08 0.23 1.07
rem. MO 0 0 0 0 0 0 0 0 0 0 0 0 0 0
Table 13. The daily traded quantities for each vendor in the energy poverty mitigation market, kWh
Vendor P21 P7 P15 P6 P3 C5 C9 C11 C12 C16 C19 C20 C24 C26 Total
surplus FCFS 1.18 0.11 1.30 1.98 7.00 0 0 0 0 0 0 0 0 0 11.58 surplus MO 9.02 0 4.37 0 0.49 10.65 4.48 6.20 4.46 7.44 2.70 4.40 1.18 7.80 63.18 traded FCFS 0 0.11 0 0.53 0.08 0 0 0 0 0 0 0 0 0 0.72 traded MO 0 0 0.60 0 0.00 0 0 0 0 0 1.18 0 0 0 1.79 rem. FCFS 1.18 0.00 1.30 1.45 6.92 0 0 0 0 0 0 0 0 0 10.86 rem. MO 9.02 0.00 3.76 0 0.49 10.65 4.48 6.20 4.46 7.44 1.52 4.40 1.18 7.80 61.39
Table 14. The hourly traded quantities in the energy poverty mitigation market for all vendors, kWh
Hour h06 h07 h08 h09 h10 h11 h12 h13 h14 h15 h16 h17 h18 Total
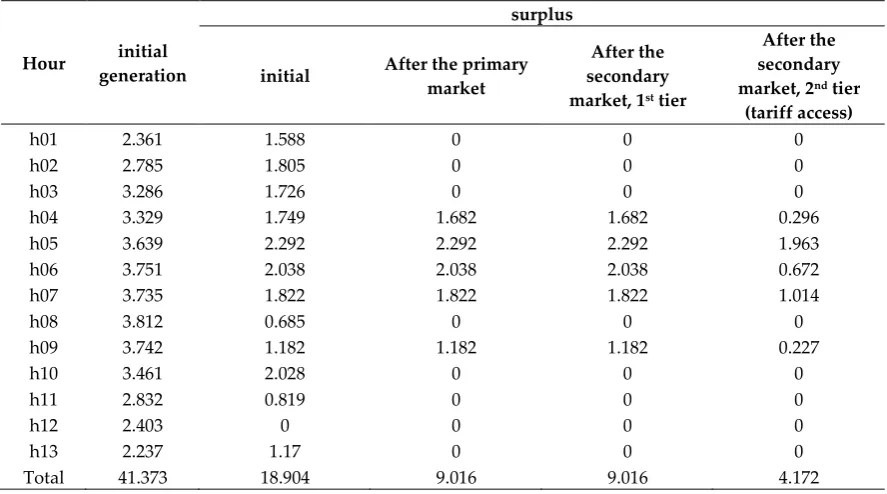
Figures 16-17 and Tables 11-14 reveal significantly different trading scenarios on the energy poverty mitigation market when the two trading priority methods (FCFS and MO) are used in the primary market. For FCFS, 3 out of 5 prosumers will trade electricity with C28, while if MO were to be used, only P15 and P3 will sell electricity, the rest of the buying offer being fulfilled by just one consumer, C19. Also, if the secondary market is activated, the available surplus rises when MO is used from 13.88 kWh in the primary market to 63.18 kWh, due to the presence of the consumers who need to sell the surplus generated by the forecast error or offer quantity rounding. In the absence of the secondary market, these two quantities would be sold back to the grid at minimal price. Thus, in addition to allowing prosumer to sell more surplus, the secondary market offers a mechanism for minimizing the effect of consumption forecast errors at the consumer side when the MO trading priority method is used. However, the prosumer and consumer surplus to be sold back to the grid remain high, at 13.27 kWh and 48.12 kWh respectively (Table 13).
The costs of the consumer C28 and revenues of the vendors in the energy poverty market tier are given in Tables 15-18 and Figures 18-19. The financial settlement is performed in this case using as reference only the vendor price offer, similar to POP from Tables 7-10, because with just one vulnerable consumer trading in the market, the COP is viable only if the consumer would buy at a fixed tariff, and MCP results are the same as POP when COP is not specified.
(a) (b)
(c) (d)
Figure 18. The energy poverty mitigation market cost for buyers: (a) hourly values, FCFS; (b) daily values for each consumer, FCFS; (c) hourly values, MO; (d) daily values for each consumer, MO.
Table 15. The daily cost for each consumer in the energy poverty mitigation market, mu
Consumers C28
FCFS POP 0.72
MO POP 0.75
Table 16. The hourly cost for all buyers in the energy poverty mitigation market, mu
Consumers h06 h07 h08 h09 h10 h11 h12 h13 h14 h15 h16 h17 h18 Total
(a) (b)
(c) (d)
Figure 19. The energy poverty mitigation market revenue for vendors: (a) hourly values, FCFS; (b) daily values for each consumer, FCFS; (c) hourly values, MO; (d) daily values for each consumer, MO.
The results show that the vendor revenues are lower than in the primary market, because of the smaller traded quantities, but they can become significant if they are averaged over longer periods (months, years). The consumer C28 will pay less in the local market than when buying electricity from the grid, and the MO trading priority maximizes its earnings and the number of hourly intervals in which trading can be made. A more profitability analysis will follow in the Discussions section, for all the trading segments considered in the market algorithm.
Table 17. The daily revenue for each vendor in the energy poverty mitigation market, mu
Vendors P21 P7 P15 P6 P3 C5 C9 C11 C12 C16 C19 C20 C24 C26 Total
FCFS POP 0 0.11 0 0.53 0.08 0 0 0 0 0 0 0 0 0 0.72
MO POP 0 0 0.29 0 0.00 0 0 0 0 0 0.46 0 0 0 0.75
Table 18. The hourly revenue in the energy poverty mitigation market for all vendors, mu
Prosumers h06 h07 h08 h09 h10 h11 h12 h13 h14 h15 h16 h17 h18 Total
FCFS POP 0 0 0 0 0.00 0.08 0.51 0 0.02 0.11 0 0 0 0.72 MO POP 0.07 0.05 0.06 0 0.00 0.04 0.24 0.02 0.01 0.10 0.03 0.03 0.09 0.75
4.3. The secondary market – the commercial tariff access tier
model proposed in the paper uses the second tier of the secondary market, operated according to the MO trading priority method used in the primary market, but with different market participants.
The sellers that can enter this market segment are the same as for the energy poverty mitigation market: prosumers with remaining surplus and consumers whose offers placed in the blockchain system of the primary market exceed their actual demand, thus becoming surplus. The buyers are consumers from the same microgrid who did not participate in the primary market, but are ready to occasionally buy surplus from the secondary market when it is available, at market prices. In exchange for this facility, they pay an extra fee, according to the formula from Equation (10). The quantities are determined automatically in the settlement phase of the energy poverty market or at the end of the primary market, if the EP tier is not used. The sell price offers are the offer prices entered by prosumers in the blockchain system of the primary market. For consumers the buy prices are: C13 – 0.47 mu/kWh, C17 – 0.30 mu/kWh, C18 – 0.42 mu/kWh, lower than the average offers from the primary market, in order to minimize the effect of the added tariffs. The fulfillment priority for the buy and sell offers is determined using the MO strategy from Figure 3, and the actual quantities and financial exchanges between sellers and buyers are settled as in the primary market.
Using as reference the trading data from Table 13, the sellers participating in the market are P21, P15, P6 and P3, if the FCFS method is used in the primary market, and P21, P15, P3, C5, C9, C11, C12, C16, C19, C20, C24, C26. The buyers are three consumers that did not participate in the primary market, namely C13, C17 and C18. The fee applied for all the consumers is a 10% increase of the final buy price, and it is charged by the market administrator. For evaluating all the possibilities regarding the financial settlement, all three price alternatives will be considered: MCP, COP and POP, similar to the primary market. The quantities offered and actually traded by each vendor and buyer in the two primary market methodologies (FCFS and MO) are given in Appendix C, Tables C1-C5.
The results show that the use of the MO trading priority in the primary market leads to higher quantities traded in the tariff access market tier, while if the FCFS trading priority is chosen, prosumer surplus is lower. The hourly results for the market and the daily quantities traded by the prosumers and the consumers care summarized, in the same manner as for the previous market tiers, in Figures 20-23 and Tables 19-22.
(a) (b)
Figure 20. The buyer quantity offers in the secondary tariff access market: (a) hourly; (b) per consumer
(a) (b)
(a) (b)
Figure 22. The seller quantity offers in the secondary tariff access market: (a) hourly; (b) for each seller
(a) (b)
Figure 23. The buyer quantities traded in the secondary tariff access market: (a) hourly; (b) for each seller
Table 19. The daily traded quantities for each buyer in the secondary tariff market, kWh
Consumer C13 C17 C18 Total
offer FCFS 7.30 8.55 6.62 22.48 offer MO 7.30 8.55 6.62 22.48 traded FCFS 2.49 2.99 2.20 7.67 traded MO 7.30 7.61 6.36 21.28 rem. FCFS 4.82 5.57 4.43 14.81 rem. MO 0.00 0.94 0.26 1.20
Table 20. The hourly traded quantities in the secondary tariff market for all buyers, kWh
Hour h06 h07 h08 h09 h10 h11 h12 h13 h14 h15 h16 h17 h18 Total
offer FCFS 1.99 1.03 1.11 1.39 2.12 1.85 2.16 1.08 1.58 1.55 2.41 1.79 2.42 22.48 offer MO 1.99 1.03 1.11 1.39 2.12 1.85 2.16 1.08 1.58 1.55 2.41 1.79 2.42 22.48 traded FCFS 0 0 0 1.39 2.12 1.85 0.73 0 1.58 0 0 0 0 7.67 traded MO 1.62 1.03 1.11 1.39 2.12 1.85 2.16 0.99 1.58 0.81 2.41 1.79 2.42 21.28 rem. FCFS 1.99 1.03 1.11 0.00 0.00 0.00 1.43 1.08 0.00 1.55 2.41 1.79 2.42 14.81 rem. MO 0.38 0.00 0.00 0.00 0.00 0.00 0.00 0.09 0.00 0.74 0.00 0.00 0.00 1.20
Table 21. The daily traded quantities for each vendor in the secondary tariff market, kWh
Vendor P21 P15 P6 P3 C5 C9 C11 C12 C16 C19 C20 C24 C26 Total
surplus FCFS 1.18 1.30 1.45 6.92 0 0 0 0 0 0 0 0 0 10.86 surplus MO 9.02 3.76 0.00 0.49 10.65 4.48 6.20 4.46 7.44 1.52 4.40 1.18 7.80 61.39
traded FCFS 0.86 0 1.45 5.36 0 0 0 0 0 0 0 0 0 7.67
traded MO 4.84 3.76 0 0.49 6.38 0 0.00 2.78 1.51 1.52 0 0 0 21.28
rem. FCFS 0.32 1.30 0 1.56 0 0 0 0 0 0 0 0 0 3.19
Table 22. The hourly traded quantities in the secondary tariff market for all vendors, kWh
Hour h06 h07 h08 h09 h10 h11 h12 h13 h14 h15 h16 h17 h18 Total
surplus FCFS 0 0 0 1.82 4.14 2.27 0.73 0 1.90 0 0 0 0 10.86 surplus MO 1.62 3.20 5.25 1.68 4.08 2.53 3.17 0.99 1.80 0.81 7.25 15.30 13.71 61.39 traded FCFS 0 0 0 1.39 2.12 1.85 0.73 0 1.58 0 0 0 0 7.67 traded MO 1.62 1.03 1.11 1.39 2.12 1.85 2.16 0.99 1.58 0.81 2.41 1.79 2.42 21.28 diff FCFS 0 0 0 0.43 2.02 0.42 0.00 0 0.32 0 0 0 0 3.19 diff MO 0 2.16 4.14 0.30 1.96 0.67 1.01 0 0.23 0 4.84 13.51 11.29 40.11
The results from Tables 19-22 show that the tariff-access consumers are able to acquire 7.67 kWh for the FCFS primary market trading priority, exclusively from prosumer surplus. 21.28 kWh are bought for the MO trading priority method, mainly from consumer surplus, as it can be seen in Table 21. When the MO method is used, the consumer buy offers are fulfilled from the most part from the local market (Table 20), only 1.2 kWh remaining to be bought from the grid. After the settlement of the two commercial market tiers, the prosumers lower their unsold surplus to only 3.19 kWh (FCFS) or 4.7 kWh (MO), while the consumer surplus remains high, at 35.94 kWh. The prosumer surplus is available mainly in the 09:00-14:00 interval, while the consumer surplus can be accessed outside this interval, between 06:00-8:00 and 15:00-18:00 (see Table C2).
The costs of the buyers and the revenues of the vendors in this market tier are summarized in Figures 24-25 and Tables 23-26, for all three available settlement policies (MCP, COP, POP).
(a) (b)
(c) (d)
Figure 24. The tariff access market cost for buyers: (a) hourly values, FCFS; (b) daily values for each consumer, FCFS; (c) hourly values, MO; (d) daily values for each consumer, MO.
Table 23. The daily cost for each consumer in the tariff access market, mu
Consumers C13 C17 C18 Total Total + 10% fee
F
CFS
MCP 1.14 1.47 1.01 3.61 3.98 COP 1.17 0.90 0.92 2.99 3.29 POP 1.14 1.47 1.01 3.61 3.98
MO
Table 24. The hourly cost for all buyers in the tariff access market, mu
Consumers h06 h07 h08 h09 h10 h11 h12 h13 h14 h15 h16 h17 h18 Total Total +
10% fee
F
CFS
MCP 0 0 0 0.65 1.00 0.87 0.32 0 0.78 0 0 0 0 3.61 3.98 COP 0 0 0 0.56 0.88 0.65 0.34 0 0.55 0 0 0 0 2.99 3.29 POP 0 0 0 0.65 1.00 0.87 0.32 0 0.78 0 0 0 0 3.61 3.98
MO
MCP 0.79 0.50 0.50 0.76 1.17 1.02 1.19 0.45 0.87 0.39 1.18 0.81 1.16 10.77 11.85 COP 0.75 0.45 0.42 0.56 0.88 0.65 0.88 0.38 0.55 0.33 0.95 0.65 0.95 8.39 9.23 POP 0.77 0.47 0.49 0.76 1.04 0.99 1.09 0.43 0.82 0.37 1.12 0.79 1.10 10.23 11.26
(a) (b)
(c) (d)
Figure 25. The tariff access market revenue for vendors: (a) hourly values, FCFS; (b) daily values for each consumer, FCFS; (c) hourly values, MO; (d) daily values for each consumer, MO.
Table 25. The daily revenue for each vendor in the tariff access market, mu
Vendors P21 P15 P6 P3 C5 C9 C11 C12 C16 C19 C20 C24 C26 Total
F
CFS
MCP 0.47 0 0.62 2.52 0 0 0 0 0 0 0 0 0 3.61
COP 0.26 0 0.63 2.10 0 0 0 0 0 0 0 0 0 2.99
POP 0.47 0 0.62 2.52 0 0 0 0 0 0 0 0 0 3.61
MO
MCP 2.66 2.07 0 0.27 2.97 0 0 1.35 0.74 0.71 0 0 0 10.77 COP 1.65 1.65 0 0.23 2.55 0 0 1.05 0.56 0.70 0 0 0 8.39 POP 2.66 1.81 0 0.23 2.87 0 0 1.33 0.74 0.59 0 0 0 10.23
Table 26. The hourly revenue in the tariff access market for all vendors, mu
Prosumers h06 h07 h08 h09 h10 h11 h12 h13 h14 h15 h16 h17 h18 Total
F
CFS
MCP 0 0 0 0.65 1.00 0.87 0.32 0 0.78 0 0 0 0 3.61 COP 0 0 0 0.56 0.88 0.65 0.34 0 0.55 0 0 0 0 2.99 POP 0 0 0 0.65 1.00 0.87 0.32 0 0.78 0 0 0 0 3.61
MO