Article
1
Is equilibrium modelling outdated for recent
2
challenges in river management?
3
Arianna Varrani 1,*, Michael Nones 2
4
1 Department of Hydrology and Water Resources Management, Brandenburg University of Technology,
5
Cottbus, Germany; [email protected]
6
2 Research Centre for Constructions – Fluid Dynamics Unit, University of Bologna, Bologna, Italy;
7
8
* Correspondence: [email protected]; Tel.: +49 0355 69 4577
9
Abstract: To date, several different approaches are available to study sediment dynamics at reach
10
or watershed scale, based on very different hypothesis. One of such assumptions, the so-called
11
“morphodynamic equilibrium hypothesis” is becoming little unpopular for its embedded
12
simplifications. The aim of this work is to demonstrate how this approach proves yet effective in
13
modelling landscape morphodynamics at the watershed scale, for what concerns the longitudinal
14
profile of a river and the sedimentary aspects. The application of a 1-D model based on the
15
equilibrium hypothesis has been implemented for several large rivers worldwide.
16
Geomorphological parameters have been analysed, which describe the evolution of longitudinal
17
profile (concavity) and sediments characteristics (aggrading and fining), and the results show a
18
reasonably good correspondence with qualitative estimation of the same parameters. At the scale of
19
analysis and for the chosen systems, which show high inertia to geomorphological changes likely
20
owing to their longitudinal extension, the model can detect where the present conditions reflect a
21
big disturbance to the “natural equilibrium” thus allowing water managers to identify present
22
issues to be addressed.
23
Keywords: 1D modelling; large rivers; morphodynamic equilibrium, river concavity, bottom fining
24
25
1. Introduction
26
Nowadays, long-term configurations of natural systems are the result of intrinsically coupled
27
natural, social and economic feedbacks that have only begun to be explored and therefore needs
28
additional research. In this context, studies focussed on the equilibrium of natural riverine systems,
29
free of anthropogenic interventions, should be considered as a basis for palaeohydrological research
30
[1] as well as a powerful tool to understand the long-term effects of localized interventions that can
31
cause a larger scale impact [2]. In this sense, the research can be performed by either a direct
32
observation of geological records and modelling techniques.
33
In the last years, the development of advanced modelling techniques permitted to model
34
sediment transport and morphodynamics in river assuming non-equilibrium conditions, thus
35
involving the non-stationarity of the boundary conditions and accounting for all the grainsize. In fact,
36
although ordinarily applied in engineering practice, the hypothesis of local equilibrium hardly holds
37
for the fine fractions of material found in the bottom of most natural streams [3] and should be
38
removed for every grainsize fraction, either transported as bedload or in suspension, with no
39
distinction between bed material and wash load.
40
Despite such approaches, the hypothesis of long-term longitudinal equilibrium profile is still
41
very popular, since it permits to describe large watershed in a quite simplified manner, frequently
42
observed through laboratory experiments [4], indirect analysis of field data [5], numerical and
43
analytical runs [see, among others, 6-9]. Moreover, alluvial sedimentary systems, which evolve under
44
the combination of geological (sedimentology and morphology) and hydrological (hydrodynamics)
45
components, are prone to attain a long-term configuration which sees the (dynamic if short-scaled)
46
balance of external and internal processes, thus allowing for models assuming equilibrium conditions
47
[2]. Indeed, on the one part, field observations suggest that, on a relatively small temporal scale
48
(years or decades depending on the river size) and in the absence of major anthropogenic effects, the
49
average longitudinal profile may be in quasi-equilibrium conditions [7]. On the other part,
50
considering the inertia of large river systems to adapt to changing boundary conditions, at the
long-51
term alluvial rivers tend to evolve towards a quasi-equilibrium state, under the assumptions of
52
stationary boundary conditions, i.e. climate remaining sufficiently stable and absence of anthropic
53
pressures [10]. Generally, in water management quasi-equilibrium conditions are assumed, since
54
common numerical models account for short-term dynamics and only in a few cases long-term
55
changes are considered. Depending on the scale of interest, and the processes involved, equilibrium
56
modelling can be a good simplification of the actual behaviour of the river system.
57
2. Materials and Methods
58
The 1D model applied here, firstly presented by [11] and then developed by various authors
59
[9,10] assumes that only two grain-size classes composing the bottom characterize the solid phase
60
evolution. Morphological changes are described via the sediment continuity [12] and the mass
61
balance [13] equations, while an Engelund-Hansen type formula [10] describes the sediment
62
transport, given the geometrical, hydrological and sedimentological constraints. Assuming two
63
representative grain-sizes classes (coarse c and fine f fractions), d=df/dc represents the diameter ratio,
64
which gives an indication of the bed sorting.
65
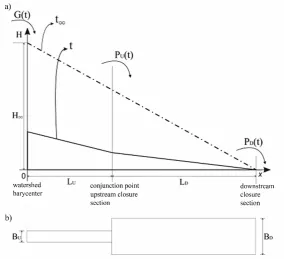
The river is schematized in two connected uniform-slope channels representing, from a physical
66
point of view, respectively the highland reach with steeper slopes and coarser grain-size, and the
67
lowland reach, characterized by milder slope and finer sediments. The upstream reach, indicated
68
with the subscript U, starts from a point where one can locate the barycentre of the watershed, feeding
69
solid and liquid supply to the main course, while the downstream reach (subscript D) ends at the
70
river outlet, assumed as fixed. The two reaches are connected in the point where the watershed area,
71
from a surface source of sediments, becomes an alluvial depositional surface (Figure 1). The mountain
72
reach measures LU and has a constant valley width BU, while the lowland part is long LD and large BD.
73
The sediment input G is concentrated at the upstream end, while PU and PD indicate the sediment
74
transport from the upstream reach and the sediment flow that comes out from the river, respectively.
75
76
77
79
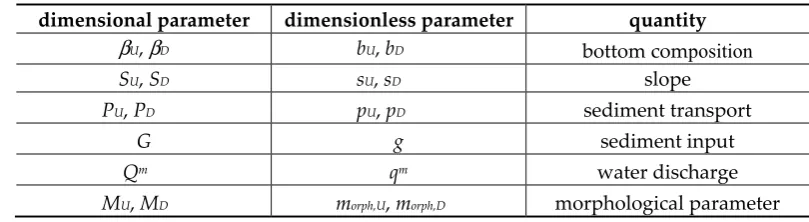
As suggested by [11], the model can be written in a dimensionless form (Table 1).
80
Table 1. Dimensional and dimensionless morphometric characteristics of the river.
81
dimensional parameter dimensionless parameter quantity
βU, βD bU, bD bottom composition
SU, SD sU, sD slope
PU, PD pU, pD sediment transport
G g sediment input
Qm qm water discharge
MU, MD morph,U, morph,D morphological parameter
82
Integrating the above reported equations over the two reaches LU and LD [10] and accounting for
83
the filling time of the two reaches [14], one can obtain three morphometric parameters necessary to
84
characterize the evolution of a watercourse towards its morphological equilibrium:
85
−
=
−
=
−
=
−
=
Φ
−
=
−
=
Χ
∞ ∞ ∞ U orph U orph D U u D U D D U D Um
m
M
t
M
t
M
t
A
b
b
t
t
t
s
s
I
t
S
t
S
t
, ,)
(
)
(
)
(
)
(
)
(
)
(
)
(
)
(
)
(
β
β
β
(1)where the longitudinal profile concavity Χ(t) represents the ratio between the upstream and
86
downstream slopes with respect to the long-term equilibrium slope reached at t=
∞
. Bed sediment87
fining Φ (t) and bottom aggrading Α(t) give information about the long-term sediment composition,
88
showing how far the bed grainsize of the two reaches is from equilibrium.
89
An analysis of the available sources of input data [14-17] suggested that, besides the geometry,
90
there are several uncertainties regarding the sedimentological parameters of the large rivers studied,
91
as observed by [10], pointing out the uncertainties. Moreover, given that the used input data referred
92
to the actual conditions, they are not representative of the pristine state of the river basin but rather
93
of a state already affected by human drivers, therefore, the results here presented refer to a future
94
long-term equilibrium, eventually attained assuming stationary boundary conditions.
95
The difficulty in finding up-to-date sediment parameters, beyond the geometrical
96
schematization of two extensive reaches representing the highland and lowland channel for which
97
static sediment classes were to be chosen, required a sensitivity analysis on the two sedimentological
98
input parameters. Therefore, the fine composition αG and the dimeter ratio d of the input material
99
were chosen spanning respectively between 0.75-0.99 and 0.10-0.50, neglecting larger differences
100
between the two grainsize classes (namely, without considering possible washload).
101
3. Results
102
To point out the different behaviour between rivers deeply affected by the human presence and
103
watercourses closer to their pristine state, the model was applied to the Orinoco River, representing
104
non-affected conditions, and two highly impacted rivers, namely the Congo and the Mississippi
105
rivers. As presented in the next sections, the river behaviour is schematized by means of the
106
maximum values of the time-variable morphometric parameters (eq. 1), evaluating them for a
107
changing diameter ratio d of the sediments and fine input αG, since these parameters can be largely
108
variable along the stream and are deeply affected by anthropogenic drivers [10]. Those maxima are
109
conditions which relate to the current situation, shows a tendency towards a quasi-equilibrium state,
111
either stable or dynamic.
112
By analysing the present conditions at varying sedimentological parameters, two different
113
behaviours are to be noticed: a clear and smooth trend shown by less impounded rivers, such as the
114
Orinoco, and a fuzzier tendency, indicating a sort of dynamic conditions proper of highly impacted
115
rivers such as the Congo and Mississippi. A detailed analysis of each watercourses is reported in the
116
following.
117
3.1. Orinoco River
118
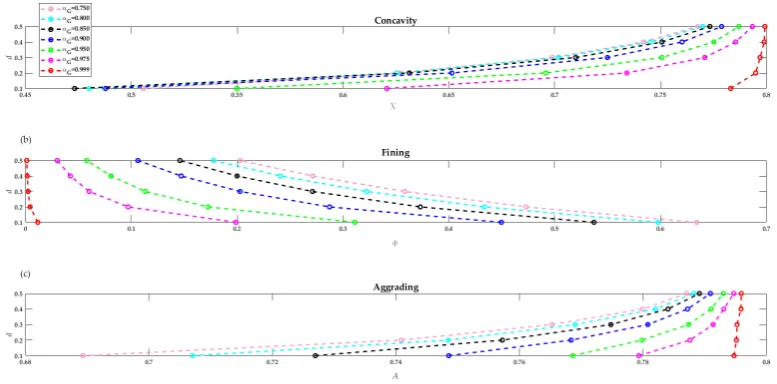
For large watercourses having a high inertia and poorly impacted by large-scale anthropogenic
119
activities (e.g., dams, bottom mining, etc.), the maximum concavity Χ (Figure 2a) increases with the
120
sediment ratio d, covering a larger range for lower sediment input αG: the higher the fine input, the
121
more constant the maximum concavity, showing a quasi-independent evolution of this parameter
122
from the sediment ratio, namely from the sorting of the bed material.
123
The maximum fining Φ (Figure 2b) shows a similar behaviour, but, in this case, higher fine input
124
αG corresponds to lower values of fining, because sediments in input are already fine and therefore
125
the adaptation process is very rapid.
126
Maximum aggrading A (Figure 2c), as it can be expected, has a trend like the concavity, but
127
spanning a narrower range (0.69-0.79 for aggrading with respect to 0.47-0.80 for concavity). In this
128
case, for high values of sediment ratio d (well-sorted material), the trend has some small irregularities,
129
especially for very fine sediments imposed as input (αG=0.999).
130
131
Figure 2. Maximum values simulated for the Orinoco River: (a) concavity; (b) fining and (c)
132
aggrading. y-axis represents the diameter ratio d, and the maximum values of the parameters
133
computed for each percentage of fine input αG are on the x-axis.
134
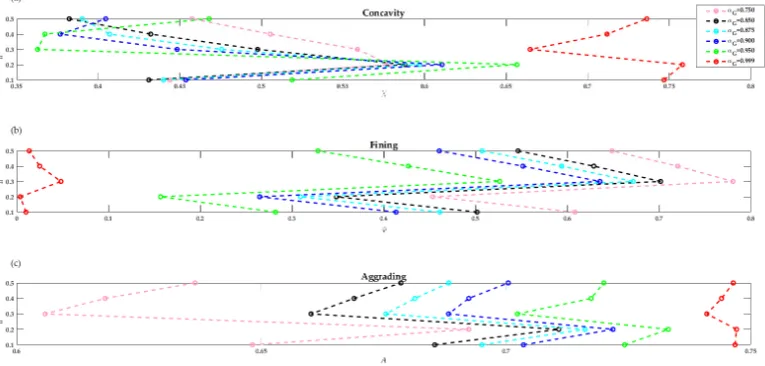
3.2. Congo River
135
The basin of the Congo River, in Africa, is highly dammed, and therefore the river cannot be yet
136
considered in quasi-equilibrium conditions like the Orinoco described above. As visible from Figure
137
3, in fact, the trend of the morphometric parameters is not smooth, in particular in the case of
138
aggrading A (Figure 3c), indicating that the used input values are not representative of a stable state.
139
Differently from the Mississippi River reported in the following, however, the maxima for the
140
concavity and fining are representative of a relatively stable behaviour, which could be related to the
141
large inertia of the river to the changes that allows for an adaptation of the grainsize composition and
142
144
Figure 3. Maximum values simulated for the Congo River: (a) concavity; (b) fining and (c) aggrading.
145
y-axis represents the diameter ratio d, and the maximum values of the parameters computed for each
146
percentage of fine input αG are on the x-axis.
147
3.3. Mississippi River
148
The Mississippi River has in all the three graphs several irregularities, when compared to the
149
results obtained for the Orinoco River and even for an anthropized watercourse like the Congo. This
150
indicates that probably other forcing terms strongly related to human pressure or also to large scale
151
drivers like climate change should be considered in a future revision of this application.
152
Using the input data corresponding to the present configuration, the river does not reach stable
153
quasi-equilibrium conditions neither at short- or long-time scale, but shows a very dynamic
154
behaviour, evidently in the maximum values reported in Figure 4, as well as observing the temporal
155
variations of the three morphometric parameters [10]. Despite the irregularities, a general behaviour
156
is clearly discernible: the finer the input αG, the lower the influence of the sediment sorting d on all
157
the morphometric parameters.
158
159
Figure 4. Maximum values simulated for the Mississippi River: (a) concavity; (b) fining and (c)
160
aggrading. y-axis represents the diameter ratio d, and the maximum values of the parameters
161
computed for each percentage of fine input αG are on the x-axis.
162
4. Discussion
164
Generally, large alluvial rivers show a concave profile, having a slope of the upstream
165
(mountain) reach higher that the downstream (lowland) one, accompanied by a longitudinal fining
166
of the bottom composition and an aggradation downstream. As discussed by many researchers since
167
several decades, this configuration may be explained by a variety of mechanisms, like abrasion,
168
distributed input of finer sediments and increase of the active river width [see, among others,
9,18-169
28]. At the same time, often, such a behaviour is disproven by geological constraints called
170
knickpoints (e.g., rocky gorges) or localized fed material (e.g. bank failure), which evidence a
171
coarsening of the bed composition, but also human drivers (e.g., dams) can alter this natural
172
mechanism. The present application of a schematic 1D model suggests a further justification for this
173
behaviour, basically consisting in the notion of quasi-equilibrium conditions, which apply to most of
174
the present alluvial large rivers worldwide.
175
As observed comparing a few case studies, particularly significant for the scope of this work is
176
the evolution of three dimensionless morphometric quantities; profile concavity Χ(t), bottom fining
177
Φ (t) and bed aggrading Α(t), functions of the non-dimensional long-term time t. Moreover, this time
178
is a function of the river filling (or response) time Tfill, frequently used to characterize the response
179
velocity of the phenomena involved in fluvial morphodynamics [9,14,16,17,29].
180
The application to real data of large river systems more or less anthropized, characterized by a
181
high inertia and therefore a moderately slow morphological evolution towards quasi-equilibrium
182
conditions, carried out in this research, has proven reasonable results for the scale of analysis and the
183
adopted assumptions. It must be considered that the simplifications adopted hold only for large
184
systems, having a particularly high inertia to changes triggered by external forcings, in favour of
185
attaining a morphological steady state, which can mean a quasi-equilibrium state. Watercourses
186
characterized by much smaller dimensions are more prone to abrupt variations induced by
187
oscillations in their boundary and initial conditions, thus not allowing for being adequately modelled
188
at long-term using the hypotheses here proposed.
189
The evaluation of the trend of the maximum values represents an indicator of the perturbations
190
to which these systems are subjected with respect to their equilibrium conditions, eventually reached
191
at the very long-term t=∞, but a thorough analysis of the spatial validity of the used data and the
192
temporal evolution of the morphometric parameters (concavity, fining and aggrading) is required to
193
corroborate the results reported here and completely characterize the long-term evolution of the
194
watercourses studied.
195
Focusing on the more anthropized basins, on the one part it is interesting to notice that, in the
196
case of the Congo River, fining and concavity have a relatively stable trend, while aggrading is
197
fuzzier. This behaviour could be related to the sediment trapping exerted by the dams located along
198
the watercourse, which causes a reduction of the variance of the grainsize, giving rise to sediment
199
ratio like the once adopted in this research. On the other part, it is evident that more research on the
200
morphology of the Mississippi River is required, since this watercourse is clearly not yet in
201
equilibrium and, therefore, very sensitive to external human-induced forcing like dams. In fact, this
202
watercourse is highly dammed and, therefore, the present condition, here used as input, could be
203
very far from the equilibrium one.
204
The management of large rivers sees the implementation of strategies typically based on the
205
results of models and simulations, in that the final state is assumed as related to some equilibrium
206
condition, usually considered as stable. Indeed, natural river systems can show a more complicated
207
behaviour, referred here as dynamic equilibrium, presenting oscillations from an assumed mean
208
trend. Relating to cases of the Congo and the Mississippi rivers, the model here implemented shows
209
that both rivers are not able to attain an equilibrium state given the present conditions, thus giving
210
an indication of a potential problem when managing such watercourses at the basin scale.
211
5. Conclusions
212
The paper proposed the application of a simplified 1D model to evaluate the long-term evolution
213
anthropized with more natural watercourses. In the case of rivers poorly affected by the human
215
pressure like the Orinoco River, the studied parameters shown a consistent general pattern, while the
216
presence of many dams can clearly alter such behaviour, giving rise to a very fuzzy trend as visible
217
in the case of the Mississippi River. On these bases, it may be assumed that the conditions obtained
218
by the model portray the present pattern of the watercourses and, therefore, depend on the
non-219
dimensional parameters describing each river basin.
220
For the future, specific aspects in the modelling procedure should be improved by: i) analysing,
221
in a systematic way, the relationship between the quasi-equilibrium configuration and the
222
morphometric parameters considered; ii) accounting for a more realistic description of alluvial rivers,
223
by introducing lithological discontinuities in the longitudinal profiles (knickpoints, waterfalls, lakes,
224
etc.) and changing water and sediment inputs; iii) considering other parameters that could affect river
225
concavity, bottom fining and bed aggrading processes; iv) consider additional, both natural (climate
226
change, extreme events, eustatism, etc.) and anthropic (levees, etc.) drivers acting at many scales.
227
Moreover, for a coherent application of the schematization here proposed, an evaluation of the
228
sensitivity of the model and its hypotheses to the scale is needed, aiming to assess the field of validity:
229
i.e. up to what scale (starting from the whole river and reducing the dimension) can this model be
230
valid and applied? This is meaningful because this 1D model is meant to be valid for the whole river,
231
but for practical uses it might be required to analyse the quasi-equilibrium at the local scale, via
232
application to a sub-system. Indeed, the very simple altimetric configuration with two reaches points
233
might be not enough appropriate for small-scale problems, yielding to inconsistency of the results.
234
Equilibrium long-term modelling of large rivers can indicate criticalities in the present situation,
235
like the one clearly evidenced here for the Mississippi River. For highly anthropized watercourses, it
236
is clear how the changes imposed alter the system, which adapts to such disturbances, but only
237
occasionally is able to reach an equilibrium. The temporal scale of such process of self-adjustment
238
should be considered when planning any further activity on disturbed watercourses, but not always
239
estimates on this time are available.
240
Acknowledgments: The authors would like to thank Prof. Giampaolo Di Silvio and Dr. Mariateresa Franzoia
241
for their fruitful comments on the background of the model and the proposed approach.
242
Author Contributions: Arianna Varrani performed the simulations and analysed the data, while Michael Nones
243
developed the numerical model. Both authors contributed in equal manner to the writing of the manuscript.
244
Conflicts of Interest: The authors declare no conflict of interest.
245
References
246
247
1. Oguchi, T., Saito, K., Kadomura, H., Grossman, M. Fluvial geomorphology and paleohydrology in Japan.
248
Geomorphology2001, 39(1-2), 3-19. doi: 10.1016/S0169-555X(01)00048-4
249
2. Zhou, Z.; Coco, G.; Townend, I.; Olabarrieta, M.; Van Der Wegen, M.; Gong, Z.; D’Alpaos, A.; Gao, S.; Jaffe,
250
B.E.; Gelfenbaum, G.; He, Q.; Wang, Y.; Lanzoni, S.; Wang, Z.; Winterwerp., H.; Zhang, C. Is
251
“morphodynamic equilibrium” an oxymoron? Earth-Science Reviews 2017, 165, 257-267. doi:
252
10.1016/j.earscirev.2016.12.002
253
3. Armanini, A., & Di Silvio, G. A one-dimensional model for the transport of a sediment mixture in
non-254
equilibrium conditions. Journal of Hydraulic Research1988, 26(3), 275-292.
255
4. Wilcock, P.R., Kenworthy, S.T., Crowe, J.C. Experimental study of the transport of mixed sand and gravel.
256
Water Resources Research2001, 37(12), 3349-3358. doi: 10.1029/2001WR000683
257
5. Wilcock, P.R., DeTemple, B.T. Persistence of armor layers in gravel-bed streams. Geophysical Research Letters
258
2005, 32(8), L08402. doi: 10.1029/2004GL021772.
259
6. Viparelli, E., Gaeuman, D., Wilcock, P., Parker, G. A model to predict the evolution of a gravel bed river
260
under an imposed cyclic hydrograph and its application to the Trinity River. Water Resour. Res.2011, 47,
261
W02533. doi: 10.1029/2010WR009164.
262
7. Bolla Pittaluga, M., Luchi, R., Seminara, G. On the equilibrium profile of river beds. J. Geophys. Res. Earth
263
8. Blom, A., Arkesteijn, L., Chavarrías, V., Viparelli, E. The equilibrium alluvial river under variable flow and
265
its channel-forming discharge. J. Geophys. Res. Earth Surface 2017, 122(10), 1924-1948. doi:
266
10.1002/2017JF004213.
267
9. Franzoia, M.; Nones, M. Morphological reactions of schematic alluvial rivers: long simulations with a 0-D
268
model. Int. Journal of Sediment Research2017, 32(3), 295-304. doi: 10.1016/j.ijsrc.2017.04.002
269
10. Varrani, A. 0-D modelling of long-term morphological evolution of rivers. MSc thesis, Brandenburg
270
University of Technology, Cottbus, Germany, 2017. doi: 10.13140/RG.2.2.31210.00964
271
11. Franzoia, M. Sediment yield in rivers at different time-scales. PhD Thesis, University of Padova, Italy, 2014.
272
Available at paduaresearch.cab.unipd.it/6382
273
12. Exner, F.M. Zur Physik der Dunen. Sitzber Akad. Wiss Wien 1920, Part IIa, Bd. 129. in German
274
13. Hirano, M. River bed degradation with armouring. Trans. of Jpn. Soc. Civ. Eng. 1971, 3(2), 194-195
275
14. Di Silvio, G.; Nones, M. Morphodynamic reaction of a schematic river to sediment input changes: analytical
276
approaches. Geomorphology2014, 215, 74-82, doi: 10.1016/j.geomorph.2013.05.021.
277
15. Latrubesse, E.M., Patterns of anabranching channels: The ultimate end-member adjustment of mega rivers.
278
Geomorphology2008, 101(1-2), 130-145. doi: 10.1016/j.geomorph.2008.05.035
279
16. Gupta, A. Large Rivers: Geomorphology and Management. John Wiley & Sons 2007, Chichester, 712 pp
280
17. Castelltort, S., Van Den Driessche, J. How plausible are high-frequency sediment supply driven cycles in
281
the stratigraphic record? Sedimentary Geology2003, 157(1-2), 3-13. doi: 10.1016/S0037-0738(03)00066-6
282
18. Sternberg, H. Untersuchungen über längen-und Querprofil geschiebeführender Flüsse. Z. Bauwesen1875,
283
25, 483–506. in German
284
19. Richter, J. P. The Literary Works of Leonardo da Vinci. Vol. 2, 438 pp., Oxford Univ. Press 1939, New York
285
20. Shulits, S. Rational equation of river-bed profile. Eos Trans. AGU1941, 22(3), 622–630
286
21. Leopold, L.B., Maddock, T. The hydraulic geometry of stream channel and some physiographic
287
implications. Prof. Pap. 1953, 252, U.S. Geol. Surv., Washington D. C.
288
22. Miller, J.P. High mountain streams: Effects of geology on channel characteristics and bed material. Mem. 4
289
1958, 53 pp., State Bur. of Mines and Miner. Resour., N.M. Inst. of Min. and Technol., Socorro, N.M.
290
23. Snow, R.S., Slingerland, R.L. Mathematical modeling of graded river profiles. The Journal of Geology1987,
291
95(1), 15–33
292
24. Parker, G. Selective sorting and abrasion of river gravel. I: Theory. J. Hydraulic Engineering1991, 117(2),
131-293
149. doi: 10.1061/(ASCE)0733-9429(1991)117:2(131)
294
25. Rice, S.P., Church, M. Longitudinal profiles in simple alluvial systems. Water Resources Research2001, 37(2),
295
417–426. doi: 10.1029/2000WR900266
296
26. Fedele, J.J., Paola, C. Similarity solutions for fluvial sediment fining by selective deposition. J. Geophysical
297
Research - Earth Surface2007, 112(F2), F02038. doi:10.1029/2005JF000409
298
27. Frings, R.M. Downstream fining in large sand-bed rivers. Earth-Science Reviews 2008 87, 39-60. doi:
299
10.1016/j.earscirev.2007.10.001
300
28. Ferrer-Boix, C., Chartrand, S.M., Hassan, M.A., Martin-Vide, J.P., Parker, G. On how spatial variations of
301
channel width influence river profile curvature. Geophysical Research Letters2016, 43(12), 6313-6323. doi:
302
10.1002/2016GL069824
303
29. Paola, C., Heller, P. L., Angevine, C.L. The large-scale dynamics of grain-size variation in alluvial basins,
304
1: Theory. Basin Research1992, 4, 73–90. doi: 10.1111/j.1365-2117.1992.tb00145.x