VISUALIZATION OF POOL BOILING FROM COMPLEX SURFACES
WITH INTERNAL TUNNELS
Robert PASTUSZKOxAbstract: The paper presents experimental investigations of boiling heat transfer for a system of connected narrow horizontal and vertical tunnels. These extended surfaces, named narrow tunnel structure (NTS), can be applied to electronic element cooling. The experiments were carried out with ethanol at atmospheric pressure. The tunnel external covers were manufactured out of 0.1 mm thick perforated copper foil (hole diameters 0.5 mm), sintered with the mini-fins, formed on the vertical side of the 10 mm high rectangular fins and horizontal inter-fin surface. Visualization studies were conducted with a transparent structured model of joined narrow tunnels limited with the perforated foil. The visualization investigations aimed to formulate assumptions for the boiling model through distinguishing boiling types and defining all phases of bubble growth.
N
OMENCLATUREd – diameter, m,
h –height, m,
p – pitch, m,
q – heat flux, W/m2, s – gap between fins, m w – width, m,
Greek symbols
'T – superheating, K
G
– thickness, mm Subscriptsf – fin
p – pore (mesh) tun – tunnel
1. I
NTRODUCTIONHeat transfer to boiling liquid on enhanced surfaces is widely used for cooling purposes in technical equipment that generates high heat fluxes and where it is critical that none of the elements or integrated circuits of the device reaches the temperature higher than acceptable for its working life, reliability and correct performance.
x Kielce University of Technology, Chair of Mechanics
al. Tysiclecia P.P.7, PL-25-314 Kielce, Poland, [email protected]
The identification of processes taking place inside a limited space creates an indispensable requirement for the theoretical description of boiling in subsurface tunnels, from incipience through fully developed nucleate boiling to the boiling crisis. In order to analyze nucleate boiling in a complex system of subsurface tunnels, it is necessary to identify the sites of vapor bubble nucleation, growth and departure, supply of liquid for the tunnels, and to determine all the phases of the boiling cycle.
Most researchers have dealt with external visualization only [1 – 5].
Nakayama et al. [6] were among the first to conduct boiling visualization in horizontal structural surfaces (subsurface tunnels limited by foil with triangular holes), using a section of the structure, limited by transparent walls. Their visualization study of boiling R-11, water and nitrogen suggested an important role of evaporation inside the tunnel in heat transfer enhancement.
Arshad and Thome [7] built a similar set-up for the observation of the boiling process on the plane, which was perpendicular to the axis of the tunnels with triangular, rectangular and circular cross-sections. They confirmed, in part, the findings of Nakayama et al. [6], pointing to the fact that evaporation of a thin film is the basic condition that has to be satisfied to make vapor generation inside the subsurface structure possible.
Ayub and Bergles [8] constructed a single channel simulator with side walls fabricated from polycarbonate glass sheet. Their visual observations indicated a complex liquid-vapor exchange mechanism.
Also Pastuszko [9,10] presented high speed internal visualization of boiling heat transfer for system of connected tunnels, with external visualization added to it. The experiments were carried out with water at atmospheric pressure, at heat fluxes of 130 – 290 kW/m2. Diameter and frequency of departing bubbles were determined. Observations of internal and external visualizations confirmed most of the assumptions made for the semi-analytical model for boiling from enhanced structures composed of connected vertical and horizontal tunnels.
The objectives of the present study include the elucidation of the pool boiling mechanism in a system of connected horizontal and vertical narrow tunnels, and an attempt to define particular phases in bubble generation and growth.
2.
EXPERIMENTAL SET-
UPThe visualization studies were conducted with a transparent structured model of joined tunnels limited with perforated foil (Figs 1,2).
The applied structure, being a system of mini-fins and tunnels, is complicated and the classical visualization in this case should be complemented with an observation of a two-phase system in confined spaces. A set-up with a segment structure was used to conduct qualitative observations, defined as internal visualization.
Figure 1: Schematic diagram of the internal visualization system.
a) b)
Figure 2: The basic module of the internal visualization stand: a) photograph of the module – front view; b) close-up of the test section.
horizontal perforated wall
back light
glass wall vertical tunnel
vertical perforated wall
high speed CMOS
camera
vapor bubble
saturated
liquid
The design of the module made it possible to observe the vapor bubble nucleation, growth and migration, to determine the sites where the liquid was supplied to the tunnels, and to present the flow of liquid and gas phase within the horizontal and vertical tunnels, that is, inside two narrow tunnels in contact with the formed mini-fins.
A quantitative analysis required a camera recording images at the speed greater than 200 frames a second. The visualization images were obtained using a high speed digital monochrome camera with CMOS sensor PHOT MV-D1024-160-CL (Photonfocus) with 1024x1024 pixel resolution and maximum frame rate of 150 fps. The high speed camera EX-FH20 (Casio) with 480x360 resolution at 210 fps, 224x168 resolution at 410 fps and 224x56 resolution at 1000 fps was used as an auxiliary device.
Increasing the image acquisition speed to 1000 fps would decrease the resolution significantly. At the used range of wall superheat, the frequencies of bubble departure did not exceed 60 Hz, so the rate 493 fps (at resolution of 400 x 300 with PHOT camera) was sufficient for the visualization purposes.
Lighting was provided by a high power halogen lamp and, additionally, by another lamp with light pipes (front light and back light).
3. S
AMPLESThe enhanced structure, which was the focus of the investigations, is shown in Figure 3b. The sample with the tunnel structure formed a square of 27 mm-long side. It had three main fins withmini-fins cut in them and covered with perforated foil.
The visualization studies were conducted with a transparent structured model of joined narrow tunnels limited with the perforated walls. The surface area that corresponds to the segment for the internal visualization is shown in Fig. 3a. This does not mean that the visualization was conducted at the edge of the fin array, but it only shows the section which refers to the internal visualization module, i.e., 3 mini-fins with adjacent inter-fin areas. The width of the selected area is 3 mm and the length is 27 mm.
a) b)
Figure 3: a) Horizontal and vertical section of the segment for internal visualization. b) The sample with tunnel structure with the marked area of
internal visualization segment. f
segment for internal
The parameters of the structures discussed above with the notations as in Figure 3 are shown in Table 1.
Table 1. Sample codes and specifications.
sample code dp, mm pp, mm h tunH,
mm wtun, mm ptun, mm hf, mm
Gf=s,
mm
NTS-10-1.0-0.5 0.5+0.1 1.0±0.1 1.6 1.0 2.00 10 5
4. R
ESULTS4.1. I
NTERNAL VISUALIZATIONFigures 4 – 6 present the visualization of boiling inside the space limited by the dimensions of the segment (Fig. 3a).
At the superheat of 6.0 K(Fig. 4), vapor bubbles generated above the horizontal tunnel pores are imperceptible, allowing the assumption that all the holes supply the whole system of tunnels with liquid. With the same values of 'T in the vertical tunnel, vapor bubbles are appeared initially inside the horizontal tunnel. A growing bubble gradually fills the space of neighboring vertical tunnels. When the bubble occupies nearly the whole space of the vertical tunnel, it bursts allowing the initial inflow of liquid into the tunnel. The bubbles shift to the bottom part of the vertical tunnel, move up towards the tunnel exit, become bigger and then depart at the outlet of the tunnel. The subpressure created at the bubble departure contributes to the liquid supply in the tunnel and aids the growth of another bubble in the vertical tunnel. Flooding is the predominant boiling mode.
Increasing the superheat to about 8.3 K activates principally one pore in each space between the main fins, which is confirmed by single vapor bubbles emerging over this tunnel (Fig. 5). The bubbles linger in the inter-fin spaces. One can observe that horizontal tunnels are cyclically filled with vapor and that they transfer from the flooding mode to the suction-evaporation mode, whereas the vertical tunnels are extensively flooded following the bubble departure. Departing bubbles have irregular shapes and are much bigger.
Figure 4: Ethanol boiling internal visualization,'T=6.0 K;frames every 10.14 ms.
Figure 5: Ethanol boiling internal visualization,'T=8.3 K;frames every 10.14
ms.
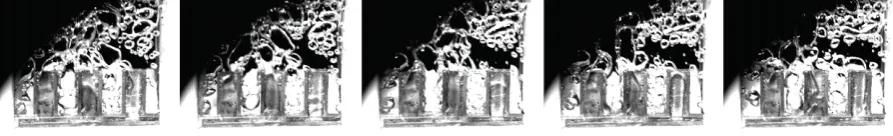
Figure 6: Ethanol boiling internal visualization,'T=13 K;frames every 10.14 ms.
4.2. B
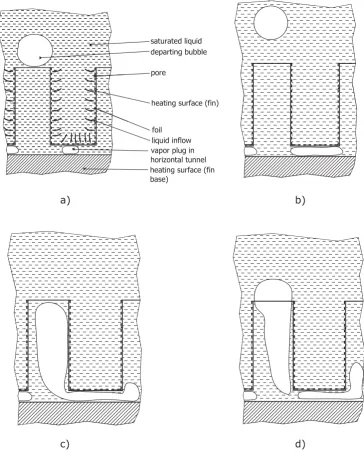
OILING CYCLEThe phases of bubble formation at small superheats, that is, for the flooding mode of boiling, are presented in Fig. 7. The following phases can be distinguished:
x the extension of a vapor plug in the horizontal tunnel up to the length corresponding to the horizontal tunnel length – Fig. 7a-b,
x vapor fills at least one of the adjacent tunnels – Fig. 7 b-c,
x the growth of the bubble at the fin tip (vertical tunnel outlet), and the burst of the vapor plug in the corner between the horizontal and vertical tunnel – Fig. 7 c-d, x the departure of the bubble; the pressure drop causes the liquid to be sucked in;
departing bubble
pore
heating surface (fin)
foil
vapor plug in horizontal tunnel
liquid inflow saturated liquid
heating surface (fin base)
a) b)
c) d)
Figure 7: Phases of bubble growth for NTS surface (flooding mode).
5. C
ONCLUSIONSThe visualization experiments allow drawing the following conclusions:
x Internal visualization allowed reconstruction of the basic boiling features relating to the confined regions of the interconnected subsurface tunnels.
x Observations of the horizontal tunnel showed that the classic mode of suction-evaporation may occur in both tunnels only at large superheats, i.e. above 13 K. x Pores in the perforated foil of the horizontal tunnel are inactive at small superheats
(about 6 K).
x Considering the occurrence of the flooding mode of boiling at small and medium superheats, four phases of bubble formation were distinguished for the analyzed complex surface with internal tunnels.
x Reduced dimensions of the heating surface can skew the heat flux values in pool boiling, which affects the change in the heat transfer coefficient value, thus the superheat values given above have no reference to the real surface area of 27 x 27 mm.
R
EFERENCES[1] Chien L.H., Webb R.L.: Visualization of pool boiling on enhanced surfaces, Experimental Thermal and Fluid Science, 16 (1998), 332-341.
[2] Chien L.H., Webb R.L.: Measurement of bubble dynamics on an enhanced boiling surface, Experimental Thermal and Fluid Science, 16 (1998), 177–186. [3] Chen Y., Groll M., Mertz R., Kulenowic R.: Visualization and mechanisms of pool
boiling of propane, isobutane and their mixtures on enhanced tubes with reentrant channels, Int. J. Heat Mass Transfer, 48 (2005), 2516–2528.
[4] Ramaswamy C., Joshi Y., Nakayama W., Johnson W. B.: High-speed visualization of boiling from an enhanced structure, Int. J. Heat Mass Transfer, 45 (2002), 4761-4771.
[5] Ghiu C.-D., Joshi Y.K.: Visualisation study of pool boiling from thin confined enhanced structures, Int. J. Heat Mass Transfer, 48 (2005), 4287-4299.
[6] Nakayama W., Daikoku T., Kuwahara H., Nakajima T.: Dynamic Model on Enhanced Boiling Heat Transfer on Porous Surfaces. Part I – Experimental Investigation, ASME Journal of Heat Transfer, 102 (1980), 445-456.
[7] Arshad J., Thome J.R.: Enhanced boiling surfaces: Heat Transfer mechanism and Mixture boiling, proc. ASME-JSME Thermal Eng. Joint Conf., vol.1 (1983), 191-197.
[8] Ayub Z.H., Bergles A.E.: Pool boiling from GEWA surfaces in water and R-113, Wärme- und Stoffübertragung, 21 (1987), 209-219.
[9] Pastuszko R.: Pool boiling visualization for surfaces with narrow tunnels limited by porous structure, proc. 5th European Thermal-Sciences Conference, 18-22 May 2008, Eindhoven, the Netherlands, TPF_23.