Article
1
Machine Learning Approaches for Designing
2
Meso-scale Structure of Li-ion battery Electrode
3
Yoichi Takagishi 1*, Takumi Yamanaka 1 and Tatsuya Yamaue 1
4
1 Kobelco Research Institute Inc., Kobe 6512271, Japan; [email protected];
5
[email protected]; [email protected]
6
* Correspondence: [email protected]; Tel.: +81-78-992-5976
7
8
Abstract: We have proposed a data-driven approach for designing mesoscale porous structures of
9
Li-ion battery electrode with three-dimensional virtual structures and machine learning techniques.
10
Over 2,000 artificial 3D structures assuming positive electrode composed of random packed spheres
11
as active material particles are generated, and charge/discharge resistance has been evaluated using
12
simplified Physico-chemical model. In this model, resistance from Li diffusion in active material
13
particles (diffusion resistance), transfer resistance of Li+ in electrolyte (electrolyte resistance) and
14
reaction resistance on the interface between active material and electrolyte are simulated based on
15
mass balance of Li, Ohm’s law in and linearized Butler-Volmer equation, respectively. Using these
16
simulation results, regression models via Artificial Neural Network (ANN) have been created in
17
order to predict charge/discharge resistance from porous structure features. In this study, porosity,
18
active material particle size and volume fraction, pressure in the compaction process, electrolyte
19
conductivity, and binder/additives volume fraction are adopted as features, associated with
20
controllable process parameters for manufacturing battery electrode. As results, the predicted
21
electrode resistance by ANN regression model is good agreement with the simulated values.
22
Furthermore, sensitivity analysis and optimization of the process parameters have been carried out.
23
The proposed data-driven approach could be a solution as a guiding principle for manufacturing
24
battery electrode.
25
Keywords: Li-ion battery, electrode, porous structure, virtual structure, machine learning,
26
simulation, physico-chemical model, optimization
27
28
29
1. Introduction
30
Li-ion secondary batteries have been receiving increasing attention because they have been used
31
in various products including Laptop PC and Electric Vehicles [1]. In spite of their remarkable
32
advancements for the past decades, a higher energy and power density, safer electrodes and
33
electrolytes, and longer durability are still required [2]. In order to satisfy these demands, designing
34
of battery electrodes plays a key role in addition to developing new materials for the electrodes and
35
electrolytes [3,4].
36
Numerical simulation techniques are powerful tool for prediction of the battery performance
37
from the process parameters of the electrodes. The one-dimensional Physico-chemical simulation
38
models have been used widely in order to predict not only the battery performance [5-6], but also
39
durability [7-9] and safety [10,11]. Although the calculation load is lower in these models, the
meso-40
scale porous structures of the electrodes are not reflected because these structures are approximated
41
as homogeneous solid and liquid state. On the other hand, the three-dimensional extended
42
simulations using 3D-SEM tomography data [12,13] or artificial structure [14,15] based on the
43
Physico-chemical model have been developed and reported recently. Since the meso-scale structures
44
of the porous electrodes are taken into account and three-dimensional distribution of the
45
electrochemical reaction and Li/Li concentration are estimated in these detailed model, more accurate
46
prediction of battery performance are expected.
47
Recently, parametric studies and sensitivity analyses of the process parameters using Artificial
48
Neural Networks (ANNs) combined with the Physico-chemical models have been carried out
49
[16,17]. In these papers, it has been proved that ANNs are useful tool for regression of the battery
50
performance and analysis of the importance features. However, in most cases the one-dimensional
51
homogeneous model has been used because these studies need a large amount of simulation cases.
52
Therefore, it is still unclear the sensitivity and the optimized three-dimensional meso-scale structure
53
of the electrode and process parameters for the battery performance.
54
In this study, we propose the prediction and optimization scheme of three-dimensional porous
55
electrode of Li-ion battery using high-throughput simulation model and machine learning
56
techniques. First, the high-throughput Physico-chemical modeling based on particles aggregated
57
structures assuming positive electrode are developed and the database of the relationship between
58
the process parameters and the battery performance are construct. Next, development of the
59
regression model of the battery resistance and capacity are created using controllable condition
60
parameters (Active material volume fraction, size etc.) via ANN. Finally, the optimized electrode
61
structures and the process parameters are searched by Bayesian optimization.
62
63
2. Simulation Method
64
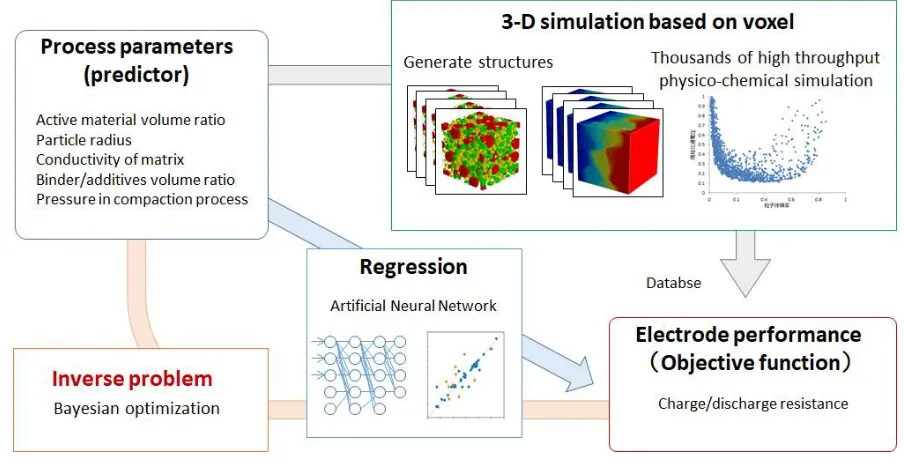
2.1. Simulation scheme
65
Figure 1 illustrates the proposed prediction and optimization scheme of Li-ion battery porous
66
electrode. In the first step, high-throughput Physico-chemical modeling based on particles
67
aggregated structures are developed and the database of the relationship between the process
68
parameters including particle volume fraction, particle radius etc. and the battery performance
69
represented by charge/discharge resistance and capacity are construct. In the second step, the
70
regression model in order to predict the charge/discharge resistance is developed using process
71
parameters as predictors via Artificial Neural Network (ANN). The optimized electrode structures
72
and the process parameters are searched by Bayesian optimization in the final step.
73
74
75
76
77
Figure 1. Proposed prediction and optimization scheme of Li-ion battery porous electrode.
78
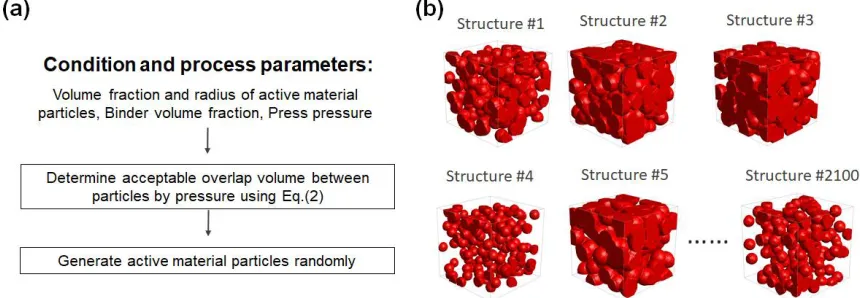
Total 2,100 three-dimensional artificial electrode structures composed of hundreds of
80
aggregated particles are generated for evaluation of battery electrode resistance. Fig.2 (a) shows the
81
flow chart to generate artificial structures with parameters based on random packed method [18]
82
using MATLAB code. The active material particle radius (2.5 – 12.5 [um]) is extracted randomly with
83
uniform distribution, and spheres are generated in a 50 x 50 x 50 [um3] box until the volume fraction
84
reaches the randomly specified value. Compaction process of electrode (calendaring) affects
meso-85
scale structure of pore region and active material particles. Here, maximum overlap lengthδbetween
86
active material particles is estimated from compaction pressure P and the number of active material
87
particle using theoretical model [19],
88
31
4
3
Fr
E
a
(1)2 2
a
r
r
(2)where a, r and E means the radius of contact area, the radius of the particle and Yong’s modulus
89
(assuming 1.0 [GPa]), respectively. The force between the particles F is estimated as 3 1 /Nap
PS where
90
S and Nap indicates the cross section area of the system and the number of particles, respectively. The
91
generated meso-porous structures of the electrode are shown in Fig.2 (b).
92
93
94
Figure 2. (a) The flow chart to generate the artificial structure with controllable process parameters.
95
(b) The generated meso-porous structures of the electrode.
96
97
2.3. Estimation of surface area of pore region and volume fraction of active material
98
In manufacturing process of electrode, binder and conductive aid are added in active material
99
particles in order to improve its adhesion and conductivity. Although the prediction technique of 3D
100
binder structure in porous materials has been proposed [20], it is still difficult to reproduce the
101
accurate structure of them. In this study, binder and additive region are not modeled explicitly in 3D
102
structure but assumed to be completely mixed and homogeneous in order to estimate the effective
103
porosity and surface area of active material. The volume fraction of homogeneous binder/additives
104
regionθb is estimated by the volume fraction of pore regionθp and Nap. The effective volume fraction
105
of pore region θp,eff and the effective surface area Sp,eff are estimated as
106
ap
p b p eff
p
N
, 1 (4)eff p eff p p eff
p S
S ,
,
, (5)107
Using generated structures described in Section 2.2, the simplified Physico-chemical model has
109
been applied in order to evaluate the resistance and capacity in each structure. The effective
110
conductivity of electrolyte is evaluated Poisson equation in 3D structure,
111
0
l
l (6)where σl and φl means the bulk electrolyte conductivity and potential, respectively. The electrolyte
112
resistance Rl is estimated from the effective conductivity of electrolyteσl,eff,
113
1.5
1 , 1
leff b
l
R (7)
The calculation has been performed using GeoDict (Math2Market GmbH) [21].
114
The reaction resistance Rreac between the active material and the electrolyte is evaluated by
115
linearized Butler-Volmer equation:
116
RT F i RT F RT F ii 0 exp exp 0 2
(8)
I
L
R
reac
(9)where i0 , i,η,α, F, R and T denotes the exchange current density, current density per surface area of
117
active material overpotential, transfer coefficient, Faraday constant, Gas constant and temperature,
118
respectively. I and L means current density per cross section and system length, respectively.
119
Li diffusion in the active material is described as steady state diffusion equation using diffusion
120
coefficient Ds,
121
0
D
sc
s (10)where cs indicates Li concentration in the active material. In this study, Eq. (9) is simplified assuming
122
single sphere particle
123
s s
s i r D
c 2 2
(11)
where Δcs means concentration polarization. Therefore, Li diffusion resistance can be estimated as
124
c c c
I L
Rdiff
ocv 0
ocv 0 s (12)using average Li concentration in active material c0 and Open Circuit Voltage (OCV) function
125
i
i i
ocv c0 p c0/cmax
(13)
where cmax means coefficient and maximum Li concentration of active material. pi indicates coefficient
126
of polynomial OCV function showed in Table 1. These simplifications make it possible to reduce the
127
calculation load in three-dimensional complex structures.
128
Table 1. Coefficients of polynomial OCV function [9].
129
Coefficient Value
p6 -43.8299
p5 109.273
p4 - 99.9523
p3 39.8270
p2 - 5.52739
p1 - 1.00539
p0 4.19987
In order to evaluate charge/discharge resistance and capacity, typical electrochemical
131
parameters are employed of so called NCM, lithium nickel manganese cobalt oxide, positive
132
electrode which is one of oxide material, as shown in Table 1.
133
Table 1. The parameters for the simplified Physico-chemical model.
134
Parameter Value
Exchange current density, i0 0.10 [A/m2] *
Temperature, T 298 [K]
Transfer coefficient, α 0.50*
Diffusion coefficient in active material, Ds 5.0×10⁻¹³ [m2/s] *
Current density, i 20 [A/m2]
Maximum Li concentration of active material, cmax 26400 [mol/m3]*
135
* Assumed value
136
137
138
2.5. Machine learning model
139
Based on the simulation results described in Section 2.3, ANN models are created as a regression
140
model of the battery resistance using the controllable condition parameters (Active material volume
141
fraction, size etc.). Table 2 shows the dataset for learning and testing including predictors and
142
descriptors. 70% of the data has been taken at random for training, and remaining data has been used
143
for validation of the ANN using R2 value.
144
145
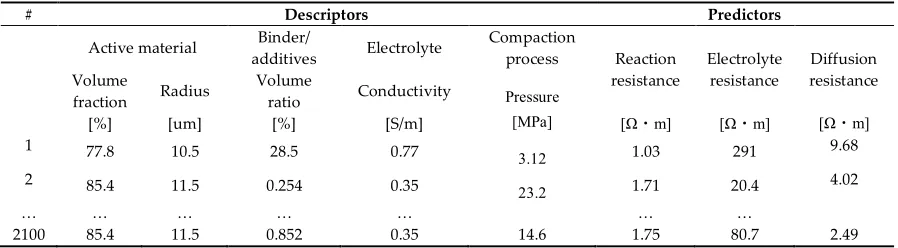
Table 2. The dataset for learning and testing including the predictors and descriptors.
146
# Descriptors Predictors
Active material Binder/
additives Electrolyte
Compaction
process Reaction
resistance
Electrolyte resistance
Diffusion resistance Volume
fraction Radius
Volume
ratio Conductivity Pressure
[%] [um] [%] [S/m] [MPa] [Ω・m] [Ω・m] [Ω・m]
1 77.8 10.5 28.5 0.77
3.12 1.03 291 9.68
2 85.4 11.5 0.254 0.35
23.2 1.71 20.4 4.02
… … … …
2100 85.4 11.5 0.852 0.35 14.6 1.75 80.7 2.49
147
148
Although there is a lot of machine learning models such as LASSO [22] and Ridge regression
149
[23] based on linear regression techniques, ANN based on nonlinear regression is one of the useful
150
tools in order to predict complex relationships between inputs and outputs or to find some patterns
151
in datasets [24]. In this study, the ANN model are constructed with three hidden layers between the
152
input and the output and 20 neurons with sigmoid transfer function. The 70% of the dataset are
153
sampled randomly for training, and remaining 30% are used for testing.
154
Furthermore, inverse analysis of the process parameters from the total resistance has been
155
carried out using ANN and Bayesian optimization. In this model, the process parameters are
156
initialized randomly and implemented the next candidate with Maximum Likelihood Estimation
157
(MLE). Expected improvement method is adopted as acquisition function with Matern 5/2 kernel
158
function.
159
ANN modeling and Bayesian optimization have been performed using Scikit-learn [25] and
160
GPyopt [26] of Python Machine Learning library.
161
3. Results and Discussion
163
3.1. Sensitivity Analysis of each resistance
164
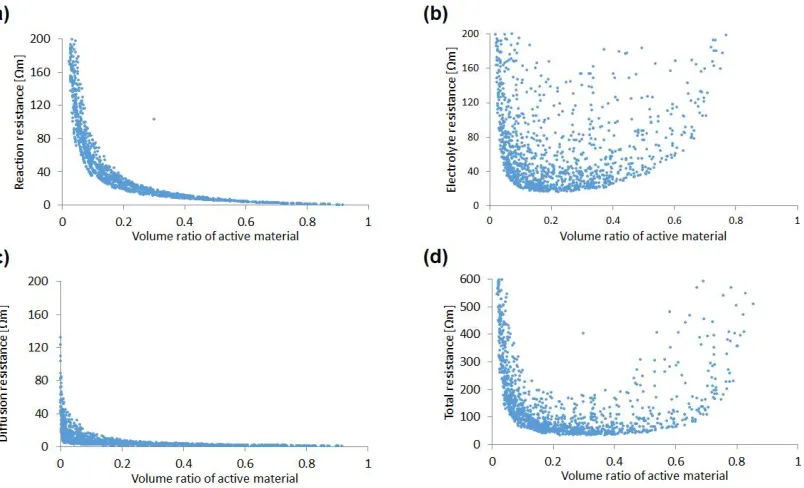
The sensitivity analysis of the charge/discharge resistance to the process parameters has been
165
carried out. Fig.3 shows the sensitivities of the reaction resistance, the electrolyte resistance and the
166
Li diffusion resistance to the volume ratio of the active material with total 2,100 simulation results.
167
As the volume ratio increases the reaction resistance decreases dramatically because the effective
168
surface area and the capacity itself increase. On the other hand, the electrolyte resistance increases
169
with the volume ratio exponentially since the electrolyte conductive region, which is pore region,
170
decreases with volume fraction of the active material. The Li diffusion resistance is relatively low in
171
all condition of this study without vicinity of volume fraction 0. Therefore, the total resistance, which
172
is sum of these four resistances, has minimum value to the volume ratio of the active material
173
particles. Thus, there exists the optimum value of the volume ratio of the active material.
174
175
176
Figure 3. Sensitivities of (a) reaction resistance, (b) electrolyte resistance, (c) Li diffusion resistance,
177
and (d) total resistance to the volume ratio of the active material with total 2,100 simulation results.
178
179
180
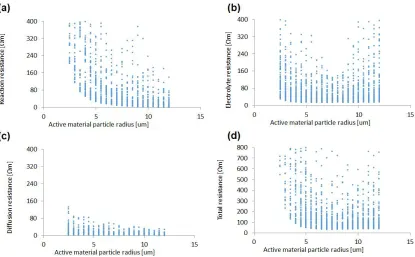
In the same manner, the sensitivity analysis has been performed to the active material particle
181
size. As shown in Fig.4, the reaction resistance decreases gradually as the particle size increases. This
182
result is unexpected since the larger particle has smaller surface area and the reaction resistance is
183
supposed to increase as the particle size increases. The reason of this is that the systems composed of
184
smaller particles have larger amount of particles and binder/additives to connect between particles,
185
therefore the effective surface area of the active material particles of the system decreases. Similarly,
186
the electrolyte resistance has higher value in the region under 4 [um] of the particle size. In this region,
187
the effective electrolyte conductivity decreases since the pore space is occupied by binder/additives
188
according to Eq. (2). As a result, the smaller particles are not always effective to decrease the reaction
189
resistance in this study. On the other hands, the diffusion resistance is relatively small to other
190
resistances in each particle size. Therefore, the total resistance has also minimum value to the active
191
material particle size. In other words, there exists optimum value of the particle size as well as the
192
194
Figure 4. Sensitivities of (a) reaction resistance, (b) electrolyte resistance, (c) Li diffusion resistance,
195
and (d) total resistance to the radius of the active material with total 2,100 simulation results.
196
197
Fig.5 shows the sensitivity of each resistance to the pressure in compaction process. The reaction
198
resistance decreases exponentially as the pressure increases. This results from the fact that in the
199
condition of higher pressure (larger overlap width) the volume fraction of the active material raises,
200
thus the total surface area also increases. On the other hands, the electrolyte resistance increases in
201
the system with higher volume fraction of the active material (lower volume fraction of pore). The
202
diffusion resistance is relatively small to other resistances in each particle size in this study.
203
204
205
Figure 5. Sensitivities of (a) reaction resistance, (b) electrolyte resistance, (c) Li diffusion resistance,
206
and (d) total resistance to the pressure with total 2,100 simulation results.
207
The binder/additives volume sensitivity of each resistance is illustrated in Fig.6. The reaction
209
resistance increases linearly since the total surface area decreases with the ratio. Sigillary,
210
approximately linear dependency of the binder/additives volume ratio is observed in the electrolyte
211
resistance and the total resistance.
212
213
214
Figure 6. Sensitivities of (a) reaction resistance, (b) electrolyte resistance, (c) Li diffusion resistance,
215
and (d) total resistance to the binder/additives volume ratio with total 2,100 simulation results.
216
217
218
3.2. Neural Network Regression
219
Various ANNs with different hyperparameters including number of neurons and hidden layers
220
have been compared in order to determine the network configuration. The correlation coefficients R2
221
for the validation data are listed in Table 3. R2 values of ANNs which consists of two hidden layers
222
is higher than the ones which consist of single layer, and saturates around 16 neurons.
223
Table 3. The correlation coefficients R2 for the validation data.
224
Number of hidden layers
Number of neurons
2 4 6 8 10 12 16 20
1 0.326 0.788 0.834 0.810 0.790 0.978 0.937 0.979 2 0.330 0.795 0.822 0.863 0.827 0.845 0.990 0.990
225
226
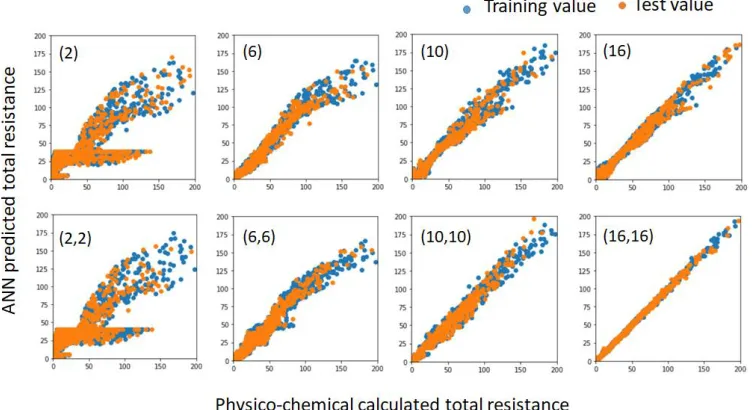
Fig.7 shows the scatter plots of both training and test data between the resistances calculated by
227
the simplified Physico-chemical models and the values predicted by various ANN models. As can be
228
seen in this figures, the accuracy of prediction improves with the number of neurons and hidden
229
layers. Although the ANN model which consists two hidden layers with 16 neurons (indicated as
230
16,16) predicts the both training and test data of the resistances accurately, the model was not suitable
231
for the inverse problem by Bayesian optimization due to its instability. Therefore, we adopted the
232
234
Figure 7. Scatter plots between the resistances calculated by the simplified Physico-chemical models
235
and predicted by various ANN models with training data and test data.
236
237
It is useful to evaluate the effect of each design parameter, which includes volume ratio of the
238
active material particles, radius of the active material particles, pressure in the compaction process
239
and volume ratio binder/additives, on the total resistance as a guiding principle for manufacturing
240
battery electrode. One of the simplest approaches for this purpose is to evaluate the weight
241
coefficients of neurons on the first hidden layer of the ANN [27]. Here, we evaluate the summation
242
of the weight coefficient magnitude |w| of the first layer neurons for each input process parameter,
243
shown in Fig.8. The graph shows that volume ratio of the active material particles has the largest
244
impact on the total resistance although the effects of pressure and particle radius are relatively small.
245
Note that these impact evaluations assume the physical parameters listed in Table.1. In other words,
246
these values may change in other conditions.
247
248
249
Figure 8. Comparison of summations of the weight coefficient magnitudes on the first layer neurons
250
for various design parameter.
251
252
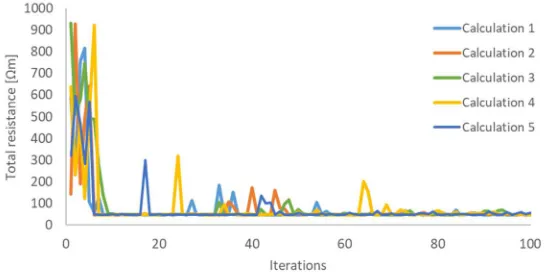
3.3. Process parameters optimized by Bayesian optimization
253
Optimized process parameters have been inferred from the total resistance using Bayesian
254
optimization with the constructed ANN model. In order to confirm validation of optimization, five
255
calculations have been performed with different initial conditions. Fig. 9 indicates the convergence
256
plot of each initial condition with optimization. Each calculation almost come to converge within 100
257
259
Figure 9. Convergence plot of five different initial conditions within 100 iterations.
260
261
The optimized process parameters for the total resistance is shown in Table 4. The results suggest
262
that the active material composed of small size particles should be packed near 50% with small
263
amount of binder/additives. The highest ionic conductivity in range of this study is suggested since
264
the higher ionic conductivity of electrolyte is, the more total resistance of the electrode decreases. The
265
proposed compaction pressure 459 [MPa] is within the typical range in actual process [28]. Note,
266
however, that negative effect of applying pressure is not taken into account in this model, such as
267
damage of foil and active materials.
268
Fig. 10 (a) shows the packing structure of the active material particles in the condition of the
269
optimized process parameters. Radar chart of each normalized resistance in various process
270
parameters is shown in Fig. 10 (b). The red triangle indicates the optimized (the smallest total
271
resistance) parameter set and other colors indicate other combinations. Note that the reaction
272
resistance in the optimized parameters is smaller than the values in other parameters although the
273
diffusion and the electrolyte resistance are not the smallest in the optimized process parameters.
274
It should be emphasized that these optimized parameters strongly depend on assumed physical
275
parameters including diffusion coefficient in active material, exchange current density etc.
276
Nevertheless, we believe that the proposed scheme for prediction of electrode resistance and
277
optimization is also useful in various physical parameters.
278
279
Table 4. Optimized process parameters for the total resistance.
280
Active material Binder/ additives Electrolyte Compaction
Volume fraction Radius Volume ratio Conductivity Pressure
[%] [um] [%] [S/m] [MPa]
50.4 6.00 0.0820 1.00 590
281
282
Figure 10. (a) Packing structure of the active material particles and (b) radar chart of each resistance
283
factor in the condition of the optimized process parameters.
284
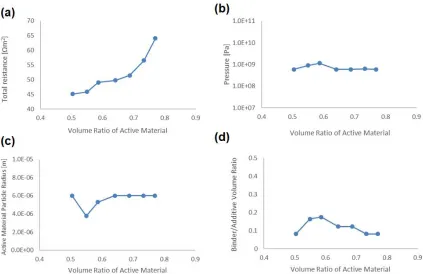
3.4. Optimized process parameters in higher capacity
286
In order to predict the optimized process parameters for higher capacity electrode, we have
287
conducted further calculations using the ANN model and optimization scheme described in section
288
3.3. The discharge resistances have been predicted in the condition that the active material volume
289
fraction are fixed from 0.5 to 0.8. Fig.11 shows the dependence of (a) Resistance, (b) Pressure in
290
compaction process, (c) Active material radius and (d) Binder/additives on the volume ratio of the
291
active material, respectively. One can see that the total resistance increases exponentially with the
292
volume ratio of the active material (see Fig.11 (a)). On the other hand, the process parameters are
293
almost unchanged from the values of active material volume fraction 0.5 although the active material
294
particle radius and the binder/additives volume ratio slightly fluctuate. This result indicates that the
295
optimized process parameters in the global condition (the volume ratio of the active material is not
296
fixed, listed in Table.4) are the best values also in the higher capacity conditions.
297
298
299
300
301
Figure 11. Dependences to the volume ratio of the active material of (a) Total resistance, (b) Pressure
302
in compaction process, (c) Active material radius and (d) Binder/additives.
303
304
305
5. Conclusions
306
In this study, the prediction and optimization scheme of battery porous electrode has been
307
proposed as a guiding principle for manufacturing process. First, High-throughput simulation model
308
based on simplified Physico-chemical equations with artificial 3D structures composed of random
309
packed spheres has been constructed and over 2000 calculations were conducted. The sensitivity
310
analyses for the calculation results indicate that the total resistance, which is summation of the
311
reaction, electrolyte and diffusion results, has minimum value to the volume ratio of the active
312
Next, the regression models via Artificial Neural Network have been created in order to predict
314
charge/discharge resistance by various process parameters including the active material volume ratio,
315
their particle radius, pressure in compact process and binder/additives volume ratio, using
316
simulation results of these artificial 3D structures. The accuracy of prediction improves with the
317
number of neurons and hidden layers, and the ANN model which consists two hidden layers with
318
16 neurons predict the both training and test data of the resistances accurately.
319
Finally, optimized process parameters have been inferred from the total resistance using
320
Bayesian optimization with the ANN model. The results indicated that the active material composed
321
of small size particles should be packed near 50% with small amount of binder/additives. As results
322
of further calculations in the conditions that the active material volume fraction is fixed from 0.5 to
323
0.8, this parameter set is the best also in the higher capacity conditions.
324
Although the optimized parameters strongly depend on assumed physical parameters including
325
diffusion coefficient in active material, exchange current density etc. Nevertheless, the proposed
326
scheme for prediction of electrode resistance and optimization is also useful in various physical
327
parameters and conditions.
328
329
330
References
331
332
1. Etacheri,V.; Marom,R.; Elazari, R.; Salitra, G.; Aurbach, D. Challenges in the development of advanced
Li-333
ion batteries: a review. Energy & Environmental Science 2011, 4 (9), pp. 3243-3262.
334
2. Lu, L.; Han, X.; Li, J.; Hua, J.; Ouyang, M. Journal of Power Sources 2013, 226, 15, pp. 272-288.
335
3. Long, W. J; Dunn, B.; Rolison, R. D.; White, S. H. Three-Dimensional Battery Architectures, Chemical Reviews
336
2004, 104, No. 10, pp. 4463-4492.
337
4. Arthur, S. T.; Bates, J. D.; Cirigliano, N.; Johnson, C. D.; Malati, P.; Mosby, M. J.; Perre, E.; Rawls, T. M.;
338
Prieto, L. A.; Dunn, B. Three-dimensional electrodes and battery architectures. MRS BULLETIN 2011, 36,
339
pp. 523-531.
340
5. Doyle, M.; Newman, J. Comparison of modeling predictions with experimental data from plastic Lithium
341
Ion cells. Journal of Electrochemical Society 1996, 143, No.6, pp. 1890-1903.
342
6. Fang, W.; Kwon, J. O.; Wang, Y. C. Electrochemical–thermal modeling of automotive Li-ion batteries and
343
experimental validation using a three-electrode cell. International Journal of Energy Research 2010, 34, pp.
344
107-115.
345
7. Ning, G.; Popov N. B. Cycle Life Modeling of Lithium-Ion Batteries. Journal of the Electrochemical Society
346
2004, 151 (10) pp. A1584-A1591.
347
8. Ramadass, P.; Haran, B.; Gomadam, M. P.; White, R.; Popov, N. B. Development of First Principles Capacity
348
Fade Model for Li-Ion Cells. Journal of the Electrochemical Society 2004, 151 (2), pp. A196-A203.
349
9. Takagishi, Y.; Yamaue, T. Predicgtion of Li-ion Battery Module Performance under Running Condition
350
Based on "Multifactorial Degradation Model". International Journal of Automotive Engineering 2017, 8, 3, pp.
351
137-142.
352
10. Melcher, A.; Ziebert, C.; Magnus, R.; Seifert, J. H. Modeling and Simulation of the Thermal Runaway
353
Behavior of Cylindrical Li-Ion Cells—Computing of Critical Parameters. Energies 2016, 9, 292.
354
11. Abada, S.; Marlair, G.; Lecocq, A.; Petit, M.; Sauvant-Moynot, V.; Safety focused modeling of lithium-ion
355
batteries: A review. Journal of Power Sources 2016, 306, pp.178-192.
356
12. Less, G. B.; Seo, H. J.; Han, S.; Sastry, M. A.; Zausch, J.; Latz, A.; Schmidt, S.; Wieser, C.; Kehrwald, D.; Fell,
357
S.; Micro-Scale Modeling of Li-ion Batteries: Parameterization and Validation. Journal of The Electrochemical
358
Society 2012, 159 (6) pp. A697-A704.
359
13. Gelb, J.; Finegan, P. D.; Brett, L. J. D.; Shearing, R. P. Multi-scale 3D investigations of a commercial 18650
360
Li-ion battery with correlative electron- and X-ray microscopy. Journal of Power Sources 2017, 357, 31, pp.
361
77-86.
362
14. Trembacki, L. B.; Mistry, N. A.; Noble, R. D.; Ferraro, E. M.; Mukherjee, P. P.; Roberts, A. S. Mesoscale
363
Analysis of Conductive Binder Domain Morphology in Lithium-Ion Battery Electrodes. Journal of The
364
15. Danner, T.; Singhc, M.; Hein S.; Kaiserc, J.; Hahn, H.; Latz, A. Thick electrodes for Li-ion batteries: A model
366
based analysis. Journal of Power Sources 2016, 334, 1, pp. 191-201.
367
16. Hosseinzadeh, E.; Marco, J.; Jennings, P. Electrochemical-Thermal Modelling and Optimization of
Lithium-368
Ion Battery Design Parameters Using Analysis of Variance. Energies 2017, 10, 1278.
369
17. Dawson-Elli, N.; Lee,S. B.; Pathak, M.; Mitra, K.; Subramanian R. V. Data Science Approaches for
370
Electrochemical Engineers: An Introduction through Surrogate Model Development for Lithium-Ion
371
Batteries. Journal of The Electrochemical Society 2018, 165 (2) pp. A1-A15.
372
18. Bertei, A.; Nucci, B.; Nicolella, C. Effective Transport Properties in Random Packings of Spheres and
373
Agglomerates. CHEMICAL ENGINEERING TRANSACTIONS 2013, 32, pp. 1531-1536.
374
19. Persson, J. N. B. Contact mechanics for randomly rough surfaces. Surface Science Reports 2006, 61, pp. 201–
375
227
376
20. Schneider, M.; Hofmann, T.; Andrä, H.; Lechner, P.; Ettemeyer, F.; Volk, W.; Steeb, H. Modelling the
377
microstructure and computing effective elastic properties of sand core materials. International Journal of
378
Solids and Structures 2018, 143, pp. 1-17.
379
21. GeoDict, Math2Market GmbH, Kaiserslautern, Germany. Accessed: -09-01 http:// www.geodict.de . 2017.
380
22. Tibshirani, R.; Regression shrinkage and selection via the lasso. Journal of the Royal Statistical Society: Series
381
B (Statistical Methodology) 1996, vol. 58, no. 1, pp. 267-288.
382
23. Hoerl, E. A.; Kennard, W. R.; Ridge Regression: Biased Estimation for Nonorthogonal Problems.
383
Technometrics. 1970, 12, No. 1, pp. 55-67.
384
24. Donato, R. H. T.; Quiles, G. M. Machine learning systems based on xgBoost and MLP neural network
385
applied in satellite lithium-ion battery sets impedance estimation. Advanced Computational Intelligence: An
386
International Journal. 5, No.1, pp. 1-20.
387
25. Pedregosa, F.; Varoquaux, G.; Gramfort, A.; Michel, V.; Thirion, B; Grisel, O.; Blondel, M.; Prettenhofer, P.;
388
Weiss, R.; Dubourg, V.; Vanderplas, J.; Passos, A.; Cournapeau, D.; Brucher, M.; Perrot, M.; Duchesnay, E.;
389
Scikit-learn: Machine Learning in Python. JMLR 2011, 12, pp. 2825-2830.
390
26. Hensman, J.; Fusi, N.; Andrade, R.; Durrande, N.; Saul, A.; Lawrence, N.D. (2012). GPy.
391
github.com/SheffieldML/GPy.
392
27. Wu, B.; Han, S.; G. K. Shin.; Lu, W. Application of aritificial neural network in design of lithium-ion
393
batteries. Journal of The Electrochemical Society 2018, 395, pp. 128-136.
394
28. Trana, Y. H.; Grecoa, G.; Täubert, C.; Wohlfahrt-Mehrens, M.; Haselrieder, W.; Kwade, A. Influence of
395
electrode preparation on the electrochemical performance of LiNi0.8Co0.15Al0.05O2 composite electrodes for
396
lithium-ion batteries. Journal of Power Sources 2012, 210, pp. 276–285.
![Table 1. Coefficients of polynomial OCV function [9].](https://thumb-us.123doks.com/thumbv2/123dok_us/7899456.1311256/4.595.110.481.634.745/table-coefficients-polynomial-ocv-function.webp)