Detecting Malicious False Frame Injection Attacks on
Video Surveillance at the Edge using Electrical
Network Frequency Signals
Deeraj Nagothu1, Yu Chen1,* , Erik Blasch2 , Alexander Aved2and Sencun Zhu3
1 Dept. of Electrical and Computer Engineering, Binghamton University, Binghamton, NY 13902, USA;
{dnagoth1, ychen}@binghamton.edu
2 The U.S. Air Force Research Laboratory, Rome, NY 13441, USA; {erik.blasch.1, alexander.aved}@us.af.mil
3 Dept. of Computer Science and Engineering, Penn State University, University Park, PA 16802, USA;
1
2
3
4
5
6
7
8
9
10
11
12
13
14
15
16
17
18
19
20
* Corresponding author: [email protected]
Abstract: Overthepastfewyears,theimportanceofvideosurveillanceinsecuringthenational critical infrastructurehas significantlyi ncreased,w hosea pplicationsi ncluded etectingfailures andanomalies. Accompaniedbyvideoproliferationistheincreasingnumberofattacksagainst surveillancesystems.Amongtheattacks,falseframeinjection(FFI)attacksthatreplayvideoframes fromapreviousrecordingtomaskthelivefeedhasthehighestimpact.Whilemanyattemptshave beenmadetodetectFFIframesusingfeaturesfromthevideofeeds,videoanalysisiscomputationally toointensivetobedeployedon-siteforrealtimefalseframedetection.Inthispaper,weinvestigatethe feasibilityofFFIattacksoncompromisedsurveillancesystemsattheedgeandproposeaneffective techniquetodetecttheinjectedfalsevideoandaudioframesbymonitoringthesurveillancefeed usingtheembeddedElectricalNetworkFrequency(ENF)signals. AnENFoperatesatanominal frequencyof60Hz/50Hzbasedonitsgeographicallocationandmaintainsastablevalueacrossthe entirepowergridinterconnectionwithminorfluctuations.Forsurveillancesystemvideo/audio recordingsconnectedtothepowergrid,theENFsignalsareembedded.Thetime-varyingnature of theENFcomponent isused asaforensicapplicationfor authenticatingthesurveillance feed. ThepaperhighlightstheENFsignalcollectionfromapowergridcreatingareferencedatabaseand ENFextractionfromtherecordingsusingconventionalshort-timeFourierTransformandspectrum detectionforrobustENFsignalanalysisinthepresenceofnoiseandinterferencecausedindifferent harmonics.TheexperimentalresultsdemonstratetheeffectivenessofENFsignaldetectionand/or abnormalitiesforFFIattacks.
Keywords: VideoSurveillance;VisualLayerAttack;ElectricalNetworkFrequency(ENF)Signal; FalseFrameInjection(FFI)Attack.
21
1. Introduction 22
Physical infrastructure security and human safety rely on surveillance systems to monitor 23
activities with minimal human intervention. A common example is audio-video systems for detecting 24
human trespassing [1]. Some methods also provide safety by alerting first responders with emergent 25
events to improve safety [2], [3]. On the other hand, the proliferation of smart surveillance systems 26
has made them attractive to physical-layer, network-based visual data attacks [4]. These attacks 27
are primarily designed to compromise the audio-video feed to disguise malicious activities or 28
prevent detection. Among them, visual data attacks are a special dimension that only exists in 29
video surveillance systems [5]. 30
Frame duplication attacksis one type of visual data attacks. It pre-records idle events and upon 31
triggering, replays the pre-recorded video and audio frames to mask the current events. Frame 32
duplication attacks result in compromised alarms, which are solely dependent on the surveillance feed 33
received. Even with human intervention to monitor the surveillance data, the malicious activity can go 34
unnoticed. An attacker’s actions could be catastrophic in case of government or banking infrastructure 35
break-ins, where physical security has extremely high priority. Many algorithms have been proposed to 36
detect frame duplication or mirroring attacks [6], but most of these detection techniques are performed 37
on previously stored media files that can be delayed from event occurrence. 38
With the proliferation of edge computing and the Internet of Things (IoT) technology, Smart Cities 39
envision the public safety surveillance as an edge service. The capability of instant, on-site detection 40
of visual layer attacks, i.e., false frame injection attacks (FFI), becomes essential to keep cities and 41
communities safe [7]. 42
TheElectric Network Frequency(ENF) is an instantaneous frequency in power distribution networks, 43
which varies across its nominal frequency 50/60Hz based on the power supply demand from the 44
consumers. The fluctuation in ENF is typically desired to be close to the nominal frequency [8], 45
and the deviation of ENF from its nominal frequency in the United States is between 59.90Hz 46
and 60.10Hz, whereas in Asian and European countries it is between 49.90Hz and 50.10Hz. The 47
instantaneous behavior of the ENF is useful because the fluctuations are the same within a power 48
grid. The instantaneous values of varying power supply frequency across the nominal frequency 49
are represented as the ENF signal. It has been observed that the surveillance feed contains traces of 50
ENF in both audio and video recordings. The source of ENF in video recording is a light source, like 51
a fluorescent lamp, and in case of audio recording, it could be either from the electromagnetic field 52
interference, mechanical vibrations of electrical powered devices, or the audible hum from powered 53
devices [8]. 54
In this paper, we propose an online authentication system using ENF signal to quickly detect 55
the malicious false frame injection attacks (also referred to asframe duplication attacksorreplay attacks). 56
Specifically, our work is focused on the ENF signal extracted from the audio recordings from the 57
surveillance feed due to its high reliability and efficiency as compared to video recordings that need a 58
powered light source [9]. The embedded ENF traces are extracted using signal processing techniques 59
like STFT (Short Time Fourier transform), which exploit the presence of ENF signals in multiple 60
harmonics [10]. To establish the extracted signal reliability, the ENF signal is collected directly from 61
the power supply and stored as a reference database. The database includes ENF signal variation w.r.t 62
time and zone of extraction. The major contributions of this work are: 63
• The feasibility of frame duplication attacks at the edge has been investigated, and an attack with 64
smart adaptability to environment and automatic triggering mechanism is implemented and 65
tested; 66
• The authenticity of the ENF signals is validated using signal traces collected at multiple locations 67
within the same power grid; 68
• A robust method is proposed to extract the fluctuations in the audio recordings and to compare 69
with the reference ENF power signal using the cross-correlation factor; 70
• The relationships between the strength of the acoustic mains hum and the signal to noise ratio 71
(SNR) of the ENF signal are verified; and 72
• The effectiveness and correctness of the proposed detection scheme are validated through an 73
experimental study using real-world ENF signal traces. 74
The rest of the paper is organized as follows. Section2provides the background knowledge 75
of ENF and the related work regarding the attacks on a surveillance system. Section3illustrates 76
the feasibility of launching a frame duplication attack at the edge through an actual implementation. 77
Section4introduces our method to detect false frame injection attacks utilizing the ENF signals 78
embedded in the recorded audio and provides available techniques on video recordings. Section 79
5presents the experimental results that verify the effectiveness of the proposed method. Section6 80
2. Background Knowledge and Related Work 82
2.1. Attacks on a Surveillance System 83
Nowadays, video surveillance systems are arguably the most popular measure for the safety and 84
security of physical facilities and residents of our communities. The emergence of more sophisticated 85
attack tools and methods has brought deep concerns to researchers and stakeholders. Network-based 86
attacks like Cross-site Scripting, buffer overflow, SQL Injection, and boot loader or firmware attacks 87
give privileged access to unauthorized people. Gaining root access allows attackers to impair the 88
normal function of a surveillance system by conducting more attacks, such as blinding cameras, 89
disabling video sensors, eavesdropping, as well as data exfiltration and infiltration oriented visual-data 90
layer attacks. These suspicious activities could escape from detection, and the attacker may even gain 91
the command and control over the surveillance network [5]. 92
In this paper, we focus ondata infiltration based visual-data layer attacks. Frame duplication attacks 93
are one of the most frequently encountered forgery attacks on a live video feed. Once the attacker has 94
gained access over the surveillance cameras through network attacks, the attack code can control the 95
surveillance output. By inserting previously recorded video and audio frames with normal scenarios, 96
the on-going suspicious activities, personnel, or objects may go undetected. Many methods have 97
been proposed to detect the replay attacks using the spatial and temporal domain similarities by 98
extracting features from the video frames and analyzing these features to detect the frame forgery 99
[11]. These algorithms mostly extract features from a video sub-sequence and compare them with 100
other sub-sequences for similarity [12]. A number of correlation techniques [6], [13], [14] have also 101
been adopted to identify frame duplication and region duplication in a video. All these similarity 102
detection techniques require a stored surveillance recording database, and hence they require much 103
computation time to process each video frame. In the case of surveillance systems, the late discovery 104
of such forgery after the event does not afford intervention, incident capture, or property anti-theft. 105
Real-time detection and alarm indication is a top priority. 106
In order to launch a false frame duplication attack, the attack code works in a controlled 107
environment. It is recognized that the environmental factors change continuously, like the light 108
intensity of the surrounding due to daytime or nighttime, an object’s position in the point of view 109
(POV) of the camera, or the introduction of new objects [7]. If there are visible differences between 110
the pre-recorded frames used for attack and the current genuine frames, the security personnel may 111
beware of it immediately. Hence the attack code continually looks for any change in the camera’s 112
POV and updates the pre-recorded frames with the new changes made in the environment. The 113
environment monitoring allows the attacker to always have up-to-date recorded frames which can be 114
triggered at any instant. For example, using a simple facial recognition software in the attack code, an 115
attacker can launch the attack upon detecting a specific face (or as simple as a quick response (QR) 116
code). In this paper, for demonstration we will use a face detection based trigger to launch the attack, 117
and collect the surveillance feed for analysis (discussed further insection 3). 118
2.2. Electrical Network Frequency Signals 119
ENF signals can be extracted using various techniques from both audio and video recordings. The 120
collection of ENF signals is also affected by many factors including the environment of recording, and 121
the recording device itself. Initially, ENF traces were found in recorders that were directly connected 122
to a power grid, and other researchers showed that ENF signals are also present in battery powered 123
devices [15], [16]. The source of ENF in such battery powered devices is the audible hum from any 124
electrical device running on power from the main grid and generating noise, where the noise carries 125
the time-varying nature of the ENF traces [16], [17]. For battery-powered devices, a device in motion 126
can have high noise and interference caused due to air friction in the ENF frequency zone and hence 127
In this paper, ENF signals are extracted from audio recording made by the surveillance cameras, 129
which are connected to the power grid. Audio signals are recorded at a sampling rate of 8 KHz. This 130
sampling rate provides room to capture the ENF traces in multiple harmonics including the nominal 131
frequency of 50/60Hz and consumes less storage. Meanwhile, the high video frame rate of surveillance 132
cameras makes it difficult to capture the ENF that varies with high time resolution. Some earlier 133
research has extracted the ENF signal by capturing changes in light intensity using optical sensors, 134
aliasing frequency, rolling shutter, and a super-Pixel based approach [9], [19], [20]. However, these 135
techniques are computation intensive, which makes them not practical for edge devices. 136
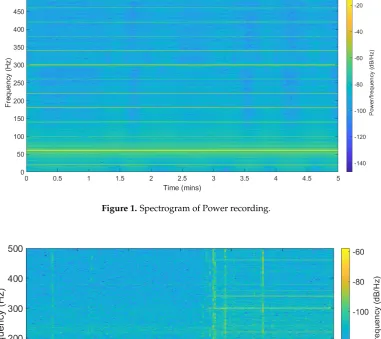
Figure 1.Spectrogram of Power recording.
Figure 2.Spectrogram of Audio recording with noise source after 3.5 minutes.
The ENF signals can be collected using a circuit consisting of a step-down transformer and a 137
voltage divider circuit. Figure1shows a spectrogram of the collected power recordings with the ENF 138
traces embedded in it. The Signal to Noise (SNR) ratio is high around the nominal frequency zone. 139
The example is recorded at Binghamton University in the United States, so the nominal ENF frequency 140
is around 60Hz and it varies in the range of±0.02Hz. The range of variation changes per the location; 141
±0.8Hz. The ENF variations are observed to appear in many harmonic bands along with the nominal 143
frequency band [10]. These harmonic bins have different signal strengths as compared to the nominal 144
bin. 145
Figure2represents the audio recording spectrogram. The recording was made in an android 146
phone connected to the power supply for six minutes, where the first 3.5 minutes were recorded 147
without main power electrical devices like computers or speakers operating nearby. Then, after 3.5 148
minutes the electrical devices around the recorder were powered on. The ENF traces are available 149
in the nominal frequency along with its harmonics for the second part of the recording. In the first 150
part of the recording, the ENF traces are captured as a result of direct power grid connection. It is 151
also possible that the traces were captured due to low-energy ambient noise from devices running 152
farther away from the recorder. The recordings show that ENF traces can be captured in the presence 153
of acoustic hum or from devices directly connected to the power grid. 154
2.3. ENF Signal Applications 155
ENF signals have been adopted in digital forensics to authenticate digital media recordings [8], 156
[17]. The use of ENF technique was firstly demonstrated to authenticate media recordings as proof 157
for legal jurisdiction purposes to verify whether or not an evidence was tampered with. The ENF 158
authentication technique was introduced and multiple extraction processes have been discussed [8]. 159
Many forgeries as false evidences were detected using the instantaneous ENF signal. Robust extraction 160
of the ENF signals has been an active research topic, and multiple signal extraction and tracking 161
algorithms have been proposed [8], [21], [22], [23]. The signal extraction experiments on alternating 162
current (AC) powered recording devices and battery powered devices reveal the source of ENF in a 163
battery powered device is the acoustic hum generated by the electrical devices connected to a main 164
power source [16], [17]. These experiments show that the main power noise source in the proximity of 165
the recording devices can result in capturing ENF traces. 166
A high precision phase analysis technique was introduced, which checks for sudden changes in 167
the phase and amplitude of the extracted ENF signal [23]. This technique does not rely on a pre-built 168
reference database, but there were cases where the deleted or added video clip could have the same 169
phase as the proceeding clip. Hence, there are not any observable phase or amplitude changes to 170
utilize. As the ENF signals are embedded in multiple harmonics along with the nominal frequency 171
range, a multi-estimator model could enable a more robust extraction of ENF signals from a weak 172
spectral component [10], [21]. The estimator model states that the frequency variations of the harmonic 173
spectral range have larger variance compared to the nominal frequency. It has also been observed 174
that for different types of recording environments, recording devices with different microphones like 175
dynamic or electric microphones result in ENF traces with high SNR in specific harmonic ranges as 176
compared to rest of the spectra. The extraction process includes combining multiple spectral frequency 177
ranges, resulting in a robust signal with a low computational requirement. 178
These previous studies demonstrate the usefulness of the ENF, so we adopt this technique 179
to extract the ENF signals from our surveillance recordings. Various environmental factors and 180
device-related scenarios, like wave interference, Doppler effect and movement of the recording device 181
with respect to the noise source, could affect ENF capture in audio [18]. For instance, due to the 182
different types of microphones used, the ENF signals are embedded in multiple harmonics. Figures 183
3and4represent two ENF instances recorded at the same time in two different rooms and different 184
buildings. The ENF signals are very similar throughout a power grid, and the slight shift might be due 185
to the oscillator error in two different device recorders. 186
Algorithms to extract the ENF signals from video recordings along with the audio samples can be 187
developed simultaneously. For example, ENF traces can be detected in video recordings using optical 188
sensor measurements with indoor lighting [9]. A light source was required during the video recordings, 189
and the availability of ENF traces in surveillance camera video recordings made using CCD camera 190
from CMOS camera recordings uses rows from each video frame leveraging a rolling shutter technique 192
[24]. This technique cannot be universally applied to all cameras since the number of rows exposed to 193
light in each image sensor changes with the manufacturers. A Super-Pixel based approach divides 194
a video frame into a group of pixels with similar pixel intensity as known assuper-pixels[20]. The 195
instantaneous light condition variations in these super-pixels are used to detect the presence of ENF in 196
a given video file without investing a lot of processing power and time on video files with no ENF 197
traces. 198
Figure 3.ENF captured in Adjacent rooms
Figure 4.ENF captured in Adjacent Buildings
3. Real-time Frame Duplication Attack Implementation 199
Before introducing our ENF based detection mechanism, this Section investigates the feasibility 200
of an automated real-time frame duplication attack at the network edge by an experimental case study. 201
3.1. Overview 203
To launch a real-time frame duplication attack, we assume that the edge based surveillance 204
systems have been compromised through network attacks. This allows the attacker to gain complete 205
access to the live video feed along with the manipulation of the output stream as required. The 206
algorithm devised includes two modules, monitoring for audio-video replay and deploying an attack. 207
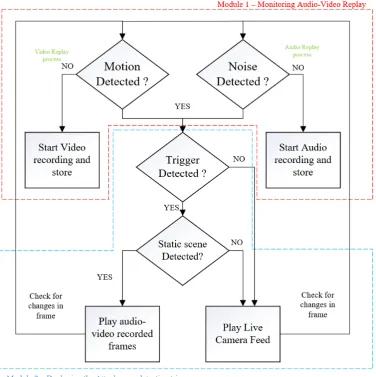
Figure5represents the algorithm flow diagram. In the first module "monitoring audio-video 208
replay", it consists of collecting duplicate recording in two parallel processes where video and audio 209
streams are monitored independently. The video monitoring process constantly checks for any motion 210
in the frame, and when a static scene is detected, an automated recording of the static scene is started 211
in the background process. The motion detection algorithm in the video process performs Gaussian 212
blur on the frames to smooth out edges and minimize errors due to noise, and then changes in pixel 213
intensities are compared with a threshold to detect any motion. The audio monitoring process detects 214
noise in the environment and records audio samples when there is no background noise. With the 215
"monitoring audio-video replay", a recent recording of the video and audio are collected and stored. 216
The second module "deploying an attack" represents detecting a trigger and launching the attack. The 217
mechanism used as a cue is the face recognition algorithm. When the trigger event is detected, the 218
video frames and audio samples are combined and deployed to mask the live video feed. 219
3.2. Attack Algorithm Functionality 220
The monitoring audio-video replay module discussed earlier consists of two parallel processes, 221
for video and audio, running independently to collect replay recording. The termreplay recording 222
represents a pre-recorded video frames or audio samples to be used later by the algorithm when the 223
attack is triggered. The motion detection algorithm in the video process is used to detect an occurrence 224
of a static scene by comparing the pixels in consecutive frames. The changes in pixel intensity are 225
compared with a threshold, where different environments have different sensitivity to pixel changes 226
and hence different threshold values. 227
For our test-bed, we consider indoor environments where the changes in pixel values are more 228
stable compared to outdoor environments. The changes which occur indoors are people walking, 229
gradual changes in natural light intensities and artificial light changes. The algorithm is tuned to 230
detect these changes in the frames by using a Gaussian blur on incoming frames. The Gaussian blur 231
performs convolution on the image, acting as a low pass filter and therefore attenuating high-frequency 232
components more than the lower-frequency components. Since human movement in the camera 233
view appears as a low-frequency change while noise is a high-frequency change, removing the noise 234
helps the algorithm better distinguish human motions from noise. Below is the Gaussian function for 235
calculating the transformation to apply to each pixel in the image 236
G(x,y) = 1 2πσ2e
−x2+y2
2σ2
whereσ2is the variance of the Gaussian distribution, and x and y are the distances from the origin in 237
the horizontal axis and the vertical axis, respectively. 238
In visual replay attacks, a duplicated streaming video out of synchronization with its audio could 239
potentially raise suspicions to people monitoring the surveillance. Hence, the second parallel process, 240
where the audio process is running to detect static noise in the environment and collect audio replay 241
recording. For example, when a static video is replayed in the live feed if the audio in the background 242
has surrounding noise which is independent of video, then it would raise suspicions. So, the video 243
frames and audio samples are recorded independently and replayed together to represent a static 244
scene with no background noise. The audio replay recording is collected when there is no noise 245
detected. A Fast Fourier Transform (FFT) is performed on the samples to obtain a frequency domain 246
representation of the input audio stream. Noise detection is performed by taking the mean volume 247
across all frequencies and comparing it to a threshold. The threshold for audio is also decided based 248
on different environmental settings of the camera. 249
The trigger detection in the “deploying attack module” is responsible for detecting a 250
pre-determined event and using the audio-video replay recording as pseudo-live feed. In this paper, 251
face detection (of the attacker) module is used as a triggering event. For modern surveillance cameras, a 252
high-quality video stream is captured with decent frames per second (FPS) compared to the surveillance 253
cameras a decade ago. For the face detection module, the FPS processed is lower, but a single frame 254
with the required face model detected is enough to trigger the attack and makes the processing speed 255
irrelevant. In the face detection module, we use Histogram of oriented gradients (HOG) for fast 256
human/face detection [25], [26]. The gradients of human faces are trained using a machine learning 257
algorithm, where each face has a unique encoding. The perpetrator’s face encoding was generated 258
beforehand and embedded in the algorithm. When the perpetrator shows up in the camera view, the 259
encoding vector is detected, and this event is used as a trigger mechanism for the replay attack. To 260
avoid suspicions by deploying the attack as soon as the face is detected, the attack is instead placed on 261
hold until a static scene appears again, and then the frames are replayed to mask the live feed. 262
The face detection model is used as an example to demonstrate the remote triggering capabilities 263
of malicious algorithms. The trigger mechanism could also be performed manually using a command 264
and control server to communicate with all the compromised surveillance cameras, or using a naturally 265
event could be a specially designed QR-code on a T-shirt, unique hand gesture or even voice-activated 267
trigger. 268
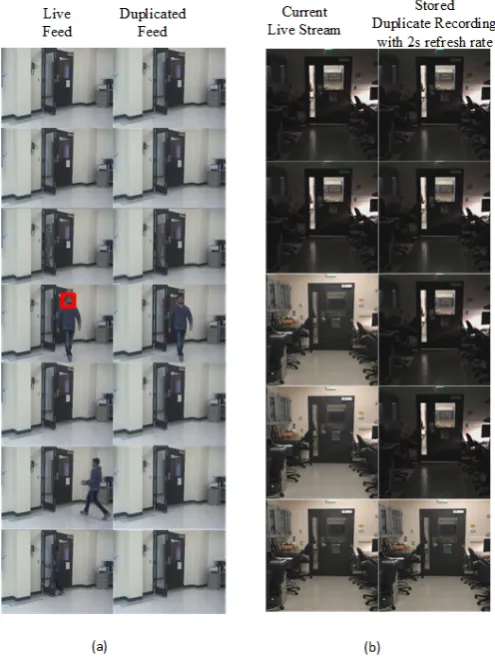
Figure6shows the frames observed by the camera (i.e., "live feed") and frames captured or 269
delivered by the camera (i.e., "duplicated feed") when the attack is launched. In Fig. 6.a, the face 270
encoding of a user (i.e., perpetrator) has been stored in the algorithm. When the perpetrator enters 271
the scene, the camera detects the face along with other faces in the scenario. The perpetrator could 272
walk into the scene with a group or individually, as long as the camera can detect the face and match 273
it with the embedded face encoding. The HOG encoding is unique for different face structures, and 274
hence it is faster to deploy facial recognition algorithm at the edge. Once a static scene is detected, the 275
duplicated frames are replayed. Here, we opt to deploy the attack once a static scene appears again 276
instead of immediately launching the attack. Deploying the attack with static scene avoids suspicious 277
artifacts like sudden disappearance of a person from frame, and detecting duplicated frames in a 278
static scene is harder than frames with objects in motion [14]. In Fig.6.b, the periodic changes in the 279
environment is reflected in the replay recording. The algorithm checks for changes in environment 280
every two seconds and updates the stored recording accordingly. The second column represents the 281
recording stored for future deployment of attack. The duration of the recording made is also modified 282
based on the indoor-outdoor requirements. The capability of the attack algorithm to adapt to the 283
changes in real-time shows the reliability of the algorithm in fooling a human perception and reduce 284
suspicious behavior when a camera does not reflect the changes according to the environment. For 285
example, a replay recording made at noon is used at night time; this can easily raise suspicion and 286
alarm the authorities. 287
Figure 7. Original audio masked by replay recording of noiseless background recording. The top recording represents the original audio recording and the bottom recording is the duplicated recording after the attack is launched.
Along with the video frame duplication, the audio samples are also masked. Figure7represents 288
masking noise made during the replay attack with its pre-recorded audio samples with no or less 289
background noise. The allowed noise depends on the threshold used to compare the frequencies in 290
FFT. For an indoor application, the noise level is assumed to be minimal, so higher frequency noise is 291
eliminated from the replay recordings. 292
4. Detecting Malicious Frame Injection Attacks using ENF Signals 293
Inspired by the characteristics of the ENF signals, this work explores the feasibility of applying 294
it to detect malicious frame injection attacks at the edge. In order to obtain a reliable ENF signal 295
from the surveillance systems, we opt to use audio records as the source, which is insensitive to 296
light conditions. A reliable database for authenticating the extracted ENF is created utilizing robust 297
extraction techniques like the spectral combination of multiple harmonics. Acorrelation coefficient 298
threshold basedmethod is introduced to detect the existence of duplicated frames inserted by the 299
attacker. 300
4.1. Applied Model 301
ENF traces occur around the nominal frequency range 50/60 Hz asfENF= fo+f∆, where fois
302
the nominal frequency and f∆is the instantaneous frequency fluctuations from the nominal value. For 303
power recordings, Fig.1shows the ENF traces at odd multiples of harmonic, with a strong signal at 304
60Hz. In case of audio recording, Fig. 2shows that the traces occur more around even harmonics 305
depending upon the type of microphone used. 306
For the spectrogram calculation of the recorded signal, we used a frame size of 1 second and nFFT 307
= 8192, which gives a frequency resolution of 0.122 Hz for a signal with a sampling rate of 1000 Hz. The 308
length of recorded signal used for each instance is six seconds. The power spectral density (PSD) of the 309
ENF carrying signal is used to extract certain spectral bandss(f), where the PSDS(ω)is computed 310
from the fast Fourier transform (FFT) of the signal and f ∈k[fo−fv,fo+fv]. fvis the variation width
311
of the ENF signal, fois the nominal frequency andkrepresents the harmonic frequency band.
312
The PSDSNXX(f)is
SNXX(f) =
1
N|XN(f)| 2
whereXN(f)is the Fourier transform of the signal
XN(f) =
∞
∑
wherew =2πf, T is the period of the signal duration, and n is the number of samples 1≤n ≤ N. 313
Sampling at discrete timesxn=x(n∆t)for a periodT=N∆t, the PSD is
314
SXX(ω) =
(∆t)2 T
N
∑
n=1
xne−jωn∆t
2
From the obtained spectral band, the instantaneous frequency for each frame window used is estimated by the maximum value in each power density vector obtained for that time instant. The period of signal duration represents the number of vectors obtained from PSD and instantaneous ENF values. Quadratic interpolation is used to obtain its dominant frequency from the maximum value in each vector. In Quadratic interpolation of the spectral peak, the peak location is given as
∆= 1
2 ∗
α−γ
α−2∗β+γ
whereαis the previous bin of the max spectral bin,βis the max spectral peak andγis the next bin. Ifk∗is the bin number of the largest spectral sample at the peak, where 1≤k∗≤Kfor K bins, then
k∗+∆is the interpolated peak location of the bins and the final interpolated frequency estimate is
f∆= (k∗+∆)fs
N
here fsis the sampling frequency andNis the number of FFT bins used. The instantaneous frequency
315
estimate of the ENF signal is then given as fENF= fo+f∆. 316
4.2. Robust Extraction of ENF signals 317
Figure 8.Different Harmonics of Power Recording shifted to 60Hz for comparison.
ENF traces appear in different harmonics with increasing frequency variations at different spectral bands. Figure8shows similar ENF fluctuations at odd/even harmonics. The power recordings are not affected by any noise since it is directly extracted from the power outlet, but in case of audio recordings, external noise could be captured and interfere with the ENF frequency ranges. The noise could lead to an inaccurate estimate of the ENF signal. A more robust technique was proposed to combine the spectral frequency bins from different harmonic bins based on the SNR [10]. The SNR is represented as the weight of spectral band, computed by the mean of the PSD in the ENF frequency range to the mean of spectral bin of that harmonic frequency.
wk= ∑
L
k=1s(fo−fc,fo+fc) ∑L
where fc is the range of ENF variations, and it is typically 0.02Hz in US and varies in European
318
and Asian countries. fvis the spectral band of interest in each of thekharmonics and fois nominal
319
frequency. The weight obtained from each spectral bin is normalized and combined with different 320
spectral bins to compute a combined spectrum of all harmonics containing ENF. 321
S(f) =
L
∑
k=1 wks(f)
The normalized weight represents the SNR of harmonic frequency in different bands. The noise 322
in some frequency band can be eliminated for the spectral bands with very low SNR. The approach is 323
computationally more intensive for edge devices; therefore, a fog node is used to perform a second 324
pass on ENF estimation on the audio recordings with more robust extraction by eliminating the false 325
alarms produced by the edge devices. The discussion of the edge-fog-cloud hierarchy is beyond the 326
scope of this paper – interested readers may find the architecture description in our related publications 327
[27], [28], [29]. 328
4.3. Correlation Coefficient for Extracted ENF Signals 329
ENF signal estimated from both power recording and audio recording for a small duration are 330
compared to check for the similarity using a correlation coefficient between the two signals [30]. The 331
ENF signal from powerPENFand audioAENFis given as,
332
ρ(l) = ∑
N
n=1[fPENF(n)−µPENF][fAENF(n−l)−µAENF] var(PENF)∗var(AENF)
fPENFand fAENFare the frequency estimation of the ENF signal from power and audio recordings, 333
respectively.µandvarare the mean and variance of the frequency signal.lis the lag between the two 334
signals. Even though the recordings are made at the same time, due to the oscillator error between the 335
two devices the signals are not in sync. The lag is used to match the signals and a threshold decides the 336
similarity between the two signals. If the difference between the reference and the current detection 337
goes beyond a certain threshold, the system considers that a false frame injection attack is detected. 338
5. Experimental Results 339
5.1. Testbed Setup 340
A Raspberry Pi Model B is used as an edge device where the surveillance system is operating. An 341
additional module with a sound card is added to record the power recording at the same time as the 342
audio recordings. Python based code is used for the implementation and estimation algorithm of the 343
ENF signal. The Python’s parallel threading enables capturing and estimating the power ENF and the 344
audio ENF simultaneously. The recordings are stored as a file in the common database. A laptop is 345
used as a fog node to estimate the same ENF signals to verify the signal correlation in the second pass. 346
Power recordings are made using a step-down transformer and a voltage divider circuit [8] and given 347
as an input through 3.5mm audio jack. To reserve the computational power, the recordings are made 348
in mono channel instead of a stereo channel. The signals are recorded at the sampling frequency of 8 349
KHz and it is down sampled to 1000 Hz for estimating the signals. 350
5.2. Implementation and Results 351
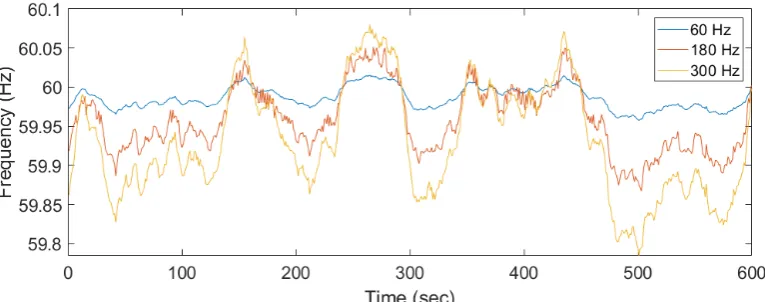
Both power and audio recordings with ENF traces are made simultaneously and the estimated 352
ENF signals are compared based on the correlation coefficient obtained. We have implemented a 353
visual-data layer replay attack and collected both the original and attacked audio recording along with 354
the power recording simultaneously. Strong ENF traces were observed at 300Hz for both power and 355
audio recording, respectively. The attacked audio includes pre-recording a selected period of time and 357
it is replayed to mask the current original recording. The attack is launched at 300 seconds and a clear 358
deviation between the original recording (green signal) and the attacked recording (red signal) can be 359
observed. The part of the recording which is replayed is clearly seen from the signal comparison as the 360
ENF estimates do not match, which indicates the possibility of forgery attacks on previously recorded 361
media files. The correlation coefficient between the power ENF signal and the attacked ENF signal 362
will be lower for the replayed part of the recording. Figure9conceptually validates the idea that ENF 363
traces to distinguish an anomaly incurred by the injected frames. 364
Figure 9.ENF estimated from the power and original audio recording.
Figure 10.Window Sizes for Power and Original Audio.
In practice, a responsive surveillance system has to provide alerts instantly rather than help 365
discern the problem from a delayed forensic analysis. Therefore, a sliding window based approach 366
is introduced to extract and estimate the ENF from online records. A thorough study has been 367
conducted for better understanding on different setup and overlap times between each ENF estimates. 368
Comparisons were made with the correlation coefficient between those estimated ENF signals. Figures 369
10and11show different window sizes used at the initial process. Based on the comparison between 370
different shifting step lengths, it is clear that a window size of 25-30 seconds is the minimum to obtain 371
ENF signal estimations. Figure10is the correlation coefficient between the power signal and original 373
audio signal. Figure11is estimated between power and attacked audio signal. It is clear that the 374
correlation is higher for original audio signal compared to attacked audio. 375
Figure 11.Window Sizes for Power and Attacked Audio.
Figures12is a detailed comparison between different window sliding step sizes. It is clear that 376
with a smaller step size a higher correlation coefficient value is obtained compared to larger step 377
sizes. However, the experimental study also shows that the computational overhead is higher with the 378
smaller sliding window step sizes. A balanced point is that a window step size of five seconds allows 379
a real-time response in case of mismatching signals. Taking multiple factors into consideration, our 380
experimental results suggest a threshold for a correlation coefficient between two signals to be 0.8. A 381
correlation coefficient above the threshold value of 0.8 means the video/audio stream is normal, while 382
below 0.8 implies the possible existence of injected false frames. The lower the value is, the higher 383
probability of attack. 384
Figure 12.Shifting Lengths comparing Power with Original and Attacked Audio.
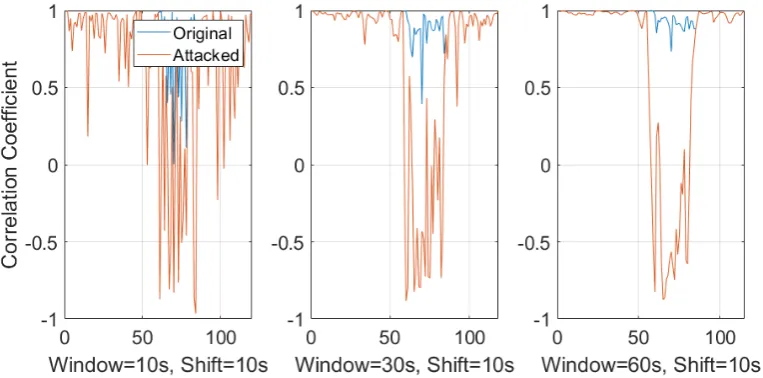
Figure13is the comparison between different window sizes with a sliding window shift step 385
size of five seconds. Even though the window size of ten seconds has smaller initialization delay, it 386
is susceptible to a high false positive rate. The fluctuations in the correlation can be seen for original 387
recording where some windows are not similar. In case of a 30 second or 60 second window size, the 388
detection of frame duplication attack is similar. The 60 second window has less fluctuations between 389
scenarios with the actual normal recording. Comparing with Fig.14, which represents a window shift 391
step size of ten seconds, it is clear that the shift step size has lower impact compared to the window 392
sizes. 393
Figure 13.Correlation Coefficient with 10sec,30sec and 60sec sliding window with a shift step size of 5 seconds.
Figure 14.Correlation Coefficient with 10sec,30sec and 60sec sliding window with a shift step size of 10 seconds.
In summary, the collected data and the experimental results conclude that it is worthy to having 394
a higher initialization setup delay with a better performance with an average shifting length of five 395
seconds. In order to reduce the false alarm rate, a consecutive lower correlation coefficient detected by 396
the system can be treated as an immediate alert to a challenging situation. In addition, a second pass 397
performed by the fog layer can also be used as a reassurance for the the alert. 398
6. Conclusions 399
Increasing number of attacks on smart surveillance systems present more concerns on security. In 400
this paper, we discussed a visual-data layer attack on video surveillance systems and introduced a 401
novel detection method leveraging the Electrical Network Frequency (ENF) signals. ENF fluctuations 402
are inferred to be similar at different locations at the same time instant, and these ENF traces are 403
audio recordings are estimated simultaneously, and a correlation coefficient is used to evaluate the 405
signal similarity. A low correlation coefficient indicates that the signals are not similar, which in turn 406
implies the potential existence of maliciously injected duplicated frames. A sliding window-based 407
approach is proposed for online detection, and different parameter values are investigated to obtain a 408
best setting. 409
While the proposed system is focused on audio recording to detect frame duplication attacks using 410
ENF fluctuations at edge devices at a low computational cost, it is also possible that the ENF harmonics 411
are contaminated due to other electromagnetic interference and affect the ENF signal estimation. To 412
establish a secondary reliable system, our ongoing work includes developing lightweight estimating 413
method using the ENF from the video recordings, and using the proposed technique to achieve more 414
robust real-time authentication method for smart surveillance. 415
Abbreviations 416
The following abbreviations are used in this manuscript: 417
418
ENF Electrical Network Frequency FFI False Frame Injection
STFT Short Time Fourier Transform FFT Fast Fourier Transform NFFT Number of FFT bins SNR Signal to Noise Ratio POV Point of View QR Quick Response Code AC Alternating Current CCD Charge Couple device
CMOS Complimentary Metal Oxide Semiconductor FPS Frames per second
HOG Histogram of Oriented Gradients PSD Power Spectral Density
419
420
1. Nikouei, S.Y.; Xu, R.; Nagothu, D.; Chen, Y.; Aved, A.; Blasch, E. Real-time index authentication for 421
event-oriented surveillance video query using blockchain. arXiv preprint arXiv:1807.061792018. 422
2. Nikouei, S.Y.; Chen, Y.; Song, S.; Xu, R.; Choi, B.Y.; Faughnan, T. Smart Surveillance as an Edge Network 423
Service: From Harr-Cascade, SVM to a Lightweight CNN. 2018 IEEE 4th International Conference on 424
Collaboration and Internet Computing (CIC). IEEE, 2018, pp. 256–265. 425
3. Nikouei, S.Y.; Chen, Y.; Song, S.; Xu, R.; Choi, B.Y.; Faughnan, T.R. Real-time human detection as an edge 426
service enabled by a lightweight cnn. 2018 IEEE International Conference on Edge Computing (EDGE). 427
IEEE, 2018, pp. 125–129. 428
4. Hampapur, A.; Brown, L.; Connell, J.; Pankanti, S.; Senior, A.; Tian, Y. Smart surveillance: applications, 429
technologies and implications. Information, Communications and Signal Processing, 2003 and Fourth 430
Pacific Rim Conference on Multimedia. Proceedings of the 2003 Joint Conference of the Fourth International 431
Conference on. IEEE, 2003, Vol. 2, pp. 1133–1138. 432
5. Costin, A. Security of CCTV and video surveillance systems: threats, vulnerabilities, attacks, and 433
mitigations. Proceedings of the 6th International Workshop on Trustworthy Embedded Devices. ACM, 434
2016, pp. 45–54. 435
6. Ulutas, G.; Ustubioglu, B.; Ulutas, M.; Nabiyev, V. Frame duplication/mirroring detection method with 436
binary features.IET Image Processing2017,11, 333–342. 437
7. Nagothu, D.; Schwell, J.; Chen, Y.; Blasch, E.; Zhu, S. A Study on Smart Online Frame Forging Attacks 438
against Video Surveillance System. arXiv preprint arXiv:1903.034732019. 439
8. Grigoras, C.; Smith, J.; Jenkins, C. Advances in ENF database configuration for forensic authentication of 440
9. Garg, R.; Varna, A.L.; Hajj-Ahmad, A.; Wu, M. “Seeing” ENF: power-signature-based timestamp for digital 442
multimedia via optical sensing and signal processing.IEEE Transactions on Information Forensics and Security 443
2013,8, 1417–1432. 444
10. Hajj-Ahmad, A.; Garg, R.; Wu, M. Spectrum combining for ENF signal estimation.IEEE Signal Processing 445
Letters2013,20, 885–888. 446
11. Wang, W.; Farid, H. Exposing digital forgeries in video by detecting duplication. Proceedings of the 9th 447
workshop on Multimedia & security. ACM, 2007, pp. 35–42. 448
12. Singh, V.K.; Pant, P.; Tripathi, R.C. Detection of frame duplication type of forgery in digital video using 449
sub-block based features. International Conference on Digital Forensics and Cyber Crime. Springer, 2015, 450
pp. 29–38. 451
13. Wahab, A.W.A.; Bagiwa, M.A.; Idris, M.Y.I.; Khan, S.; Razak, Z.; Ariffin, M.R.K. Passive video forgery 452
detection techniques: a survey. 2014 10th International Conference on Information Assurance and Security. 453
IEEE, 2014, pp. 29–34. 454
14. Fadl, S.M.; Han, Q.; Li, Q. Authentication of surveillance videos: detecting frame duplication based on 455
residual frame.Journal of forensic sciences2018,63, 1099–1109. 456
15. Brixen, E.B. ENF; Quantification of the magnetic field. Audio Engineering Society Conference: 33rd 457
International Conference: Audio Forensics-Theory and Practice. Audio Engineering Society, 2008. 458
16. Chai, J.; Liu, F.; Yuan, Z.; Conners, R.W.; Liu, Y. Source of ENF in battery-powered digital recordings. 459
Audio Engineering Society Convention 135. Audio Engineering Society, 2013. 460
17. Fechner, N.; Kirchner, M. The humming hum: Background noise as a carrier of ENF artifacts in mobile 461
device audio recordings. IT Security Incident Management & IT Forensics (IMF), 2014 Eighth International 462
Conference on. IEEE, 2014, pp. 3–13. 463
18. Hajj-Ahmad, A.; Wong, C.W.; Gambino, S.; Zhu, Q.; Yu, M.; Wu, M. Factors Affecting ENF Capture in 464
Audio. IEEE Transactions on Information Forensics and Security2019,14, 277–288. 465
19. Garg, R.; Varna, A.L.; Wu, M. Seeing ENF: natural time stamp for digital video via optical sensing and 466
signal processing. Proceedings of the 19th ACM international conference on Multimedia. ACM, 2011, pp. 467
23–32. 468
20. Vatansever, S.; Dirik, A.E.; Memon, N. Detecting the Presence of ENF Signal in Digital Videos: A 469
Superpixel-Based Approach. IEEE Signal Processing Letters2017,24, 1463–1467. 470
21. Bykhovsky, D.; Cohen, A. Electrical network frequency (ENF) maximum-likelihood estimation via a 471
multitone harmonic model. IEEE Transactions on Information Forensics and Security2013,8, 744–753. 472
22. Ojowu, O.; Karlsson, J.; Li, J.; Liu, Y. ENF extraction from digital recordings using adaptive techniques and 473
frequency tracking. IEEE Transactions on Information Forensics and Security2012,7, 1330–1338. 474
23. Rodríguez, D.P.N.; Apolinário, J.A.; Biscainho, L.W.P. Audio authenticity: Detecting ENF discontinuity 475
with high precision phase analysis. IEEE Transactions on Information Forensics and Security2010,5, 534–543. 476
24. Su, H.; Hajj-Ahmad, A.; Garg, R.; Wu, M. Exploiting rolling shutter for ENF signal extraction from video. 477
Image Processing (ICIP), 2014 IEEE International Conference on. Citeseer, 2014, pp. 5367–5371. 478
25. Dalal, N.; Triggs, B. Histograms of oriented gradients for human detection. international Conference on 479
computer vision & Pattern Recognition (CVPR’05). IEEE Computer Society, 2005, Vol. 1, pp. 886–893. 480
26. Zheng, Y.; Blasch, E.; Liu, Z.Multispectral Image Fusion and Colorization; SPIE Press, 2018. 481
27. Chen, N.; Chen, Y.; Song, S.; Huang, C.T.; Ye, X. Smart urban surveillance using fog computing. Edge 482
Computing (SEC), IEEE/ACM Symposium on. IEEE, 2016, pp. 95–96. 483
28. Nagothu, D.; Xu, R.; Nikouei, S.Y.; Chen, Y. A microservice-enabled architecture for smart surveillance 484
using blockchain technology. arXiv preprint arXiv:1807.074872018. 485
29. Xu, R.; Nikouei, S.Y.; Chen, Y.; Polunchenko, A.; Song, S.; Deng, C.; Faughnan, T.R. Real-Time 486
Human Objects Tracking for Smart Surveillance at the Edge. 2018 IEEE International Conference on 487
Communications (ICC). IEEE, 2018, pp. 1–6. 488
30. Blasch, E. NAECON08 grand challenge entry using the belief filter in audio-video track and ID fusion. 489
Aerospace & Electronics Conference (NAECON), Proceedings of the IEEE 2009 National. IEEE, 2009, pp. 490