1 Public domain image
Automated Hertbeat Abnormality Detection Using
Realtime R-Assisted Lightweight Feature Extraction
Algorithm
Diptangshu Pandit
Computational Intelligence Research Group
Northumbria University Newcastle, United Kingdom
Chengyu Liu
School of Instrument Science and Engineering,
Southeast University Nanjing, China
Li Zhang
Computational Intelligence Research Group
Northumbria University Newcastle, United Kingdom
Abstract—Automated Electrocardiogram (ECG) processing is
an important technique which helps in identifying abnormalities in the heart before any formal diagnosis. This research presents a real-time and lightweight R-assisted feature extraction algorithm and a heartbeat classification scheme which achieves highly accurate abnormality detection. In the proposed algorithm, we extract fifteen features from each heartbeat taken from raw Lead-II ECG signals. The features carry medically valuable information such as locations, amplitude and energy of ECG waves (P, Q, R, S, T waves) which are then used for detection of any abnormality that might be present in the heartbeat using various classification algorithms. We have used four popular databases from Physionet and extracted ten thousand ECG signals from each for training the models and benchmarking results. Four classification models i.e. Naïve Bays, k-Nearest Neighbor, Neural Network, Decision Tree were used for abnormality detection validating the efficiency of the system.
Keywords—abnormal ECG; ECG processing, feature extraction; heart beat classification, abnormality detection.
I. INTRODUCTION
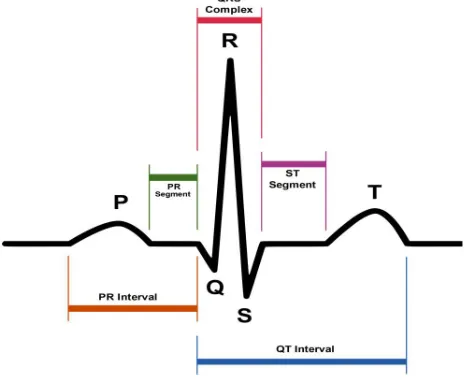
Electrocardiogram (ECG) represents electronic activities of myocardium. The ideal representation of a heartbeat on a Lead II ECG signal is shown in Figure 1. Horizontal axis represents time and the vertical axis is amplitude of the signal. The positions and shapes of these waves are analysed by physicians to detect and diagnose abnormalities which may be present in the heart. This process can be automated using computer programs, helping the physicians quickly find the region of the ECG where problems might persist.
Cardio vascular disease is a leading cause of death worldwide. It results in around 17.3 million fatalities per year which is predicted to rise rapidly with around 23.6 million deaths per year expected by 2030 [1]. Because of this there is a rapid increase in heart problem diagnosis related hardware. There are more than 120 ECG monitoring systems designed especially for older adults trying to tackle this problem [2], Numerous studies about automated ECG processing algorithms can be found in the literature. In recent works [3], [4], advantages and limitations of various ECG processing methods are discussed. Automated ECG processing generally consists of four main stages; 1) Noise reduction, 2) Feature extraction, 3)
Feature generation or optimization, 4) Classification. Various noise reduction methods can be applied to ECG signals such as wavelet transform [5]–[8], adaptive filters [9]–[11] etc. Although they seem to help the removing errors in early stage, the complex methods add more computational load and are not suitable for lightweight analysis. The next stage is feature extraction. There are numerous methods of ECG feature extraction available in the literature. Some of the methods are
summarised in the following surveys [3], [12], [13] The most popular and widely used feature extraction technique is wavelet transform [14]. There are many other accurate and computationally expensive methods such as Fast Fourier Transform [15]–[17], Linear Prediction [18], [19], and Independent Component Analysis [20]–[22]. Spectral Analysis [23], [24] , Hilbert transform [25] etc.
In the final phase, extracted features are classified using various statistical classification techniques. The most common classification methods used in ECG analysis are Neural Networks (NN), Support Vector Machine (SVM), and Decision Tree (DTree) [26].
Figure 1: Standard features1
A Lead II ECG signal consists of P, Q, R, S and T waves [27]. The standard extractable features are marked in Figure 1. The most commonly used features in abnormality detection are the location and duration of each of the waves in each heartbeat, and their shapes. Locating exact start and end regions of a wave is a highly difficult task. Because of this, extraction of features such as PR-Segment, PR-Interval, ST-Segment and QT-Interval, are not suitable for lightweight analysis. However, finding peaks and minima locations are relatively easy and can be used to construct position-based features. Therefore, we propose a lightweight scheme using this idea to find pseudo locations of the mentioned ECG waves and construct non-standard features. The constructed features convey a subset of medically important information which are used for identification of abnormal heartbeats. Previously, we have proposed multiple standalone ECG processing schemes such as [28], [29], however, in this work, we intend to propose a lightweight system and benchmark it using multiple databases and classification techniques.
The remainder of the paper is organised as follows. In Section II we describe the various methodologies used during the experiments. Section III discusses the experimental setup along with the databases used and classification model configurations. In Section IV experimental results are explained. Finally, the paper is concluded with remarks and future works in Section V.
II. METHODOLOGY
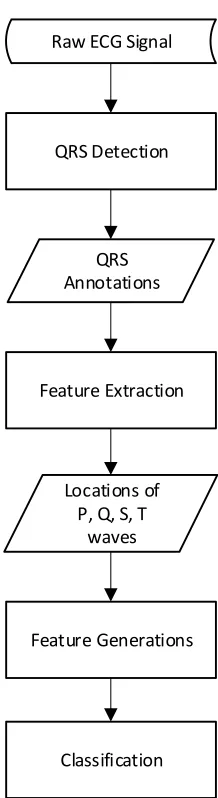
In this section we discuss the methodologies used in all the experiments. Figure 2 represents a complete heartbeat abnormality detection system from ECG signals. In the first stage, a QRS detector locates the position of a heartbeat. Next, ECG features are extracted for the corresponding heartbeat. To improve accuracy some extra features are calculated in the following stage. Finally, all the features are fed to the classifiers for abnormality detection. The proposed system does not use any conventional noise reduction process. Instead, a moving window average filter is used during pre-processing to reduce spikes. In addition to that, our proposed system does not include its own QRS detector as it assumes that the signal to be processed is already R-annotated by other lightweight QRS detectors such as [30]–[32] etc. Feature extraction and generation are included along with multiple classification techniques for benchmarking. Especially, feature extraction and feature generation are elaborated in the following.
A. Feature Extraction
The proposed algorithm takes the raw Lead II ECG signal and the R wave locations as inputs and outputs the relative locations of the rest of the waves for the corresponding heartbeat. The feature extraction algorithm only extracts pseudo locations of P, Q, S, and T waves. ‘Pseudo’ is used in the sense that the waves might not be present or even be inverted, however, the algorithm will always return assumed locations which might not represent the exact locations of the corresponding wave. The algorithm is real-time and requires at least three R locations to compute outputs. The pseudo-code of the proposed algorithm is given below.
Algorithm: R Assisted feature extraction
Input:
Y(x) //Raw ECG signal
loR’’ //Previous R location
loR //R Location
loR’ //Next R location
Output:
locP // P Peak location
locQ // Q Peak location
locS // S Peak location
locT // T Peak location
locTM // T Peak (Min) location
QRS Detection
QRS Annotations
Feature Extraction
Feature Generations Locations of
P, Q, S, T waves
Classification Raw ECG Signal
Begin
1. Search the left-hand side of the R location for the minimum value within the half QRS distance threshold range
locQ = location of minimum in Y(locR - Round(qrsT/2) : locR);
2. Search the right-hand side of the R location for the minimum value within the half QRS distance threshold range
locS =location of minimum in Y(locR : locR + Round(qrsT/2));
3. Search the designated left-hand side of the Q location for the maximum value within the P distance threshold range
locP = location of maximum in Y(R-pT : R- Round(qrsT/2));
4. Search the right-hand side of the S location for the maximum value within the T distance threshold range
locT = location of maximum in Y(R+pT : R+ tT);
5. Search the right-hand side of the S location for the minimum value within the T distance threshold range
locT = location of minimum in Y(R+pT : R+ tT);
End
As discussed earlier, the algorithm is sliding window based. The working window consists of three R wave locations. First, the locations of Q and S waves are searched based on the lowest value on the left and right sides of the current R wave location. The search window threshold is calculated based on the fraction (e.g. 0.05) of previous RR distance for Q wave. The corresponding region is marked in blue in Figure 3. Similarly, S wave is searched from the right side of R wave. In this case, the search region (Green in Figure 3) is calculated based on the fraction of next RR distance. Next, P wave is searched as the maximum value in P wave region which is marked in red in Figure 3. pT is a fraction (e.g. 0.33) of previous RR distance. Finally, T minimum and maximum are searched in the purple region in Figure 3. The region is calculated based on the next RR distance starting from right side of R wave (e.g. 0.05*RR to 0.67*RR). The algorithm returns the pseudo locations of the corresponding waves. For further processing we also calculate baseline of the corresponding heartbeat ampB by smoothing and averaging the regions between T wave and P wave locations.
B. Feature Generation
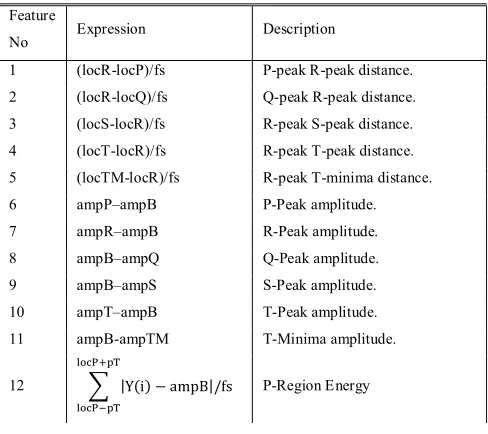
In our experiments we have used a total of 15 features including relative locations and amplitudes of wave peaks and wave
energy. All the used features are summarized in Table 1. The first four features are the pseudo locations of P, Q, S, and T waves. The fifth feature is minima in T region. This feature is important because T waves comes in different shapes and sometimes the curve might come with upside down. Feature six to Feature eleven are amplitudes of the corresponding waves relative to the baseline of the signal. The last three features are P, QRS and T region energy relative to the baseline. These features indirectly carry information about approximate durations and shapes of the waves without having to know their corresponding exact boundaries. Energy for each of the region is calculated using the formula shown in Table 1. The mentioned features are also illustrated on top of an ideal Lead II ECG signal in Figure 4. The numbers in the Figure represent the respective features described in Table 1.
Table 1: Description of fifteen features used in this study
Feature
No Expression Description
1 (locR-locP)/fs P-peak R-peak distance. 2 (locR-locQ)/fs Q-peak R-peak distance. 3 (locS-locR)/fs R-peak S-peak distance.
4 (locT-locR)/fs R-peak T-peak distance. 5 (locTM-locR)/fs R-peak T-minima distance. 6 ampP–ampB P-Peak amplitude. 7 ampR–ampB R-Peak amplitude. 8 ampB–ampQ Q-Peak amplitude. 9 ampB–ampS S-Peak amplitude.
10 ampT–ampB T-Peak amplitude. 11 ampB-ampTM T-Minima amplitude.
12 |Y(i) − ampB|/fs P-Region Energy
RR
Q R
S T P Q
R S
P T
T
Figure 3 : Feature search windows
locR locR’
pT
tT qrsT
13 |Y(i) − ampB| /
/
/fs
QRS- Region Energy
14 |Y(i) − ampB|/fs T- Region Energy
15 RR Distance of R-peak from previous one.
III. EXPERIMENTAL SETUP
A. Databases
We have employed raw ECG signals extracted from Physionet Databank [33]. Four popular databases were used during the evaluation including MIT-BIH Arrhythmia Database [34], QT Database [35], and European ST-T Database [36] and St.-Petersburg Institute of Cardiological Technics 12-lead Arrhythmia Database [ref]. The number of normal heartbeats is very high compared to the number of abnormal heartbeats in all the mentioned databases. To avoid this class imbalance problem, five thousand normal and abnormal heartbeats were randomly taken from each of the databases for evaluation.
B. Experimental Sequence
The sequence of operation for ECG abnormality detection is illustrated in Figure 2. However, we did not include a QRS detection algorithm, so, the corresponding stage is excluded. Instead, we used the R wave annotations directly from the databases. From the proposed the pseudo locations of P, Q, S
and T waves are extracted and used for construction of fifteen features as described in Table 1. The feature examples were fed to the four classifiers including k-Nearest Neighbours (KNN), Naive Bayes Classifier (N-Bayes), Decision Tree and Artificial Neural Network (ANN). The feature extraction algorithm is implemented using Matlab [37] software and the abnormality
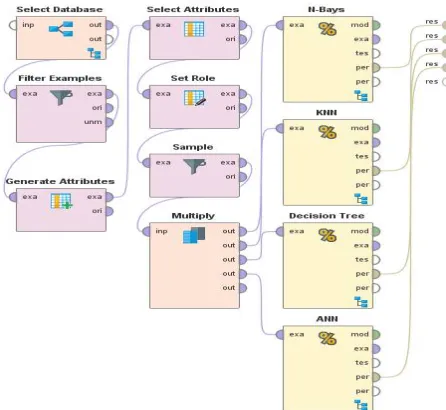
detection process is benchmarked using Rapidminer [38] visual scripting with default settings for each of the classifiers. The visual benchmarking process design used in Rapidminer is shown in Figure 5. 10-Fold cross validation is used for performance comparison using all the classifiers mentioned on each of the test databases.
IV. EXPERIMENTAL RESULTS
In this section, the classification results are described in detail. First, the performance metrices are discussed then the results obtained using multiple classifiers on mentioned databases are shown and explained.
A. Performance Metrices
During the benchmarking multiple performance metrices are used. The number of abnormal heartbeats which are truly identified by the classifiers is considered true positive (TP). On the other hand, the number of abnormal heartbeats which are classified as normal is considered as a false positive (FP). Similarly, the number of normal heartbeats which are truly identified by the classifiers is considered to be a true negative (TN) and the number of normal heartbeats which are classified as abnormal is considered as false negative (FN). Sensitivity (SN), Positive Predictivity (PP), and Overall Accuracy (OA) are used to evaluate the classifiers’ performance along with overall accuracy (OA) which can be defined as follows:
100
FN
TP
TP
SN
(i)100
FP
TP
TP
PP
(ii)= +
+ + + (iii)
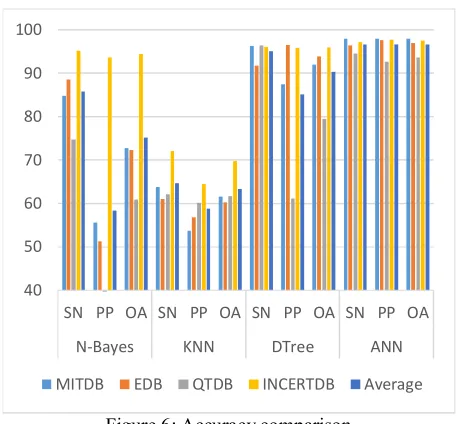
Table 2: Performances of classifiers
Classifiers MITDB EDB QTDB INCARTDB Average
N-Bayes
SN% 84.9 88.66 74.75 95.15 85.87
PP% 55.54 51.3 32.92 93.72 58.37
OA% 72.83 72.37 60.9 94.47 75.14
KNN
SN% 63.72 61.1 62.14 72.03 64.75
PP% 53.78 56.8 60.06 64.48 58.78
OA% 61.58 60.32 61.73 69.72 63.34
DTree
SN% 96.26 91.75 96.37 96.01 95.10
PP% 87.4 96.52 61.14 95.78 85.21
OA% 92 93.92 79.42 95.9 90.31
ANN
SN% 97.98 96.41 94.5 97.26 96.54
PP% 97.98 97.68 92.76 97.82 96.56
OA% 97.94 97.02 93.68 97.53 96.54
B. Results
90%. Database wise, the system worked the best on INCARTDB and poorly on QTDB. This might be because of proportional variation of abnormal heartbeats present in the QTDB. We have used only four types of abnormalities with most examples from EDB and MITDB which led to relatively highly accurate results. Furthermore, a detailed version of comparison results can be found in the appendix describing results on each of the mentioned databases.
V. CONCLUSION
In this research we presented a window-based lightweight real-time R-assisted feature extraction algorithm which can extract valuable information from raw Lead II ECG signals with the help of QRS detectors. Given the location of R waves, the proposed abnormality detection scheme extracts 15 features and passes them to diverse classifiers for diagnosis. The performance of the system is benchmarked using four popular ECG databases. One of the shortcomings of the system is that it cannot work without the assistance of a R-Peak detector. Furthermore, although it is a common strategy, the extracted features do not accurately represent the locations of the waves, especially, if the corresponding heartbeat is abnormal. Even though they are not accurate locations, the unconventional positioning of the expected wave locations produces feature value deviations which in turn, contributes to abnormality detection.
In future work, this algorithm can be embedded with lightweight QRS detectors to produce a complete heartbeat abnormality detection system. Due to its lower processing power requirement, it could be very useful for implementation in mobile or hand-held devices making an efficient real-time abnormality detection system while consuming a lesser amount of battery power.
REFERENCES
[1] D. Mozaffarian et al., “Heart Disease and Stroke Statistics – At-a-Glance Heart Disease , Stroke and other Cardiovascular Diseases
Heart Disease , Stroke and Cardiovascular Disease Risk Factors,”
Am. Hear. Assoc., no. 1, pp. 7–10, 2015.
[2] M. M. Baig, H. Gholamhosseini, and M. J. Connolly, “A comprehensive survey of wearable and wireless ECG monitoring systems for older adults,” Med. Biol. Eng. Comput., vol. 51, no. 5, pp. 485–495, 2013.
[3] E. J. da S. Luz, W. R. Schwartz, G. Cámara-Chávez, and D. Menotti, “ECG-based heartbeat classification for arrhythmia detection: A survey,” Comput. Methods Programs Biomed., vol. 127, pp. 144– 164, 2016.
[4] W. Ahmed and S. Khalid, “ECG signal processing for recognition of cardiovascular diseases: A survey,” in 2016 6th International Conference on Innovative Computing Technology, INTECH 2016, 2017, pp. 677–682.
[5] D. Pandit, L. Zhang, C. Liu, N. Aslam, S. Chattopadhyay, and C. P. Lim, “Noise Reduction in ECG Signals Using Wavelet Transform and Dynamic Thresholding,” Springer Singapore, 2017, pp. 193–206. [6] M. A. Kabir and C. Shahnaz, “Denoising of ECG signals based on noise reduction algorithms in EMD and wavelet domains,” Biomed. Signal Process. Control, vol. 7, no. 5, pp. 481–489, 2012.
[7] O. Sayadi and M. B. Shamsollahi, “ECG denoising with adaptive bionic wavelet transform,” in Annual International Conference of the IEEE Engineering in Medicine and Biology - Proceedings, 2006, pp. 6597–6600.
[8] W. Zhang, X. Wang, L. Ge, and Z. Zhang, “Noise Reduction in ECG Signal Based on Adaptive Wavelet Transform.,” Conf. Proc. IEEE Eng. Med. Biol. Soc., vol. 3, pp. 2699–2702, 2005.
[9] R. Sameni, M. B. Shamsollahi, C. Jutten, and G. D. Clifford, “A nonlinear Bayesian filtering framework for ECG denoising,” IEEE Trans. Biomed. Eng., vol. 54, no. 12, pp. 2172–2185, 2007.
[10] S. Poungponsri and X.-H. Yu, “An adaptive filtering approach for electrocardiogram (ECG) signal noise reduction using neural networks,” Neurocomputing, vol. 117, pp. 206–213, 2013.
[11] I. Sharma, R. Mehra, and M. Singh, “Adaptive filter design for ECG noise reduction using LMS algorithm,” 2015 4th Int. Conf. Reliab. Infocom Technol. Optim. (Trends Futur. Dir., pp. 1–6, 2015.
[12] N. K. Dewangan and S. P. Shukla, “A Survey on ECG Signal Feature Extraction and Analysis Techniques,” Int. J. Innov. Res. Electr. Electron. Instrum. Control Eng., vol. 3, no. 6, pp. 12–19, 2015. [13] A. E. Vincent, “A Survey on Approaches for ECG Signal Analysis
with Focus to Feature Extraction and Classification,” Int. Conf. Inven. Commun. Comput. Technol., no. Icicct, pp. 140–144, 2017. [14] P. S. Addison, “Wavelet transforms and the ECG: A review,”
Physiological Measurement, vol. 26, no. 5. 2005.
[15] H. Gothwal, S. Kedawat, and R. Kumar, “Cardiac arrhythmias detection in an ECG beat signal using fast fourier transform and artificial neural network,” J. Biomed. Sci. Eng., vol. 4, no. 4, pp. 289– 296, 2011.
[16] N. Suresh and T. Sasilatha, “Improved performance of FFT based cardiac analyzer using Advanced booth algorithm,” in Proceeding of IEEE - 2nd International Conference on Advances in Electrical, Electronics, Information, Communication and Bio-Informatics, IEEE - AEEICB 2016, 2016, pp. 656–659.
Figure 6: Accuracy comparison
40 50 60 70 80 90 100
[17] W. Karlen, C. Mattiussi, and D. Floreano, “Sleep and wake classification with ECG and respiratory effort signals,” in IEEE Transactions on Biomedical Circuits and Systems, 2009, vol. 3, no. 2, pp. 71–78.
[18] M. L. Talbi and P. Ravier, “Detection of PVC in ECG signals using fractional linear prediction,” Biomed. Signal Process. Control, vol. 23, pp. 42–51, 2016.
[19] K. P. Lin and W. H. Chang, “QRS feature extraction using linear prediction.,” IEEE Trans. Biomed. Eng., vol. 36, no. 10, pp. 1050– 1055, 1989.
[20] S. N. Yu and K. T. Chou, “Integration of independent component analysis and neural networks for ECG beat classification,” Expert Syst. Appl., vol. 34, no. 4, pp. 2841–2846, May 2008.
[21] S. N. Yu and K. T. Chou, “Combining independent component analysis and backpropagation neural network for ECG beat classification,” in Annual International Conference of the IEEE Engineering in Medicine and Biology - Proceedings, 2006, pp. 3090– 3093.
[22] M. Sarfraz, A. A. Khan, and F. F. Li, “Using independent component analysis to obtain feature space for reliable ECG Arrhythmia classification,” in Proceedings - 2014 IEEE International Conference on Bioinformatics and Biomedicine, IEEE BIBM 2014, 2014, pp. 62– 67.
[23] A. Van Oosterom, M. Lemay, and L. Kappenberger, “Full spectral analysis of the atrial components in the ECG during atrial fibrillation,” in Computers in Cardiology, 2008, vol. 35, pp. 817–820.
[24] L. S. Correa, E. Laciar, V. Mut, A. Torres, and R. Jané, “Sleep apnea detection based on spectral analysis of three ECG - Derived respiratory signals,” in Proceedings of the 31st Annual International Conference of the IEEE Engineering in Medicine and Biology Society: Engineering the Future of Biomedicine, EMBC 2009, 2009, pp. 4723–4726.
[25] D. Benitez, P. A. Gaydecki, A. Zaidi, and A. P. Fitzpatrick, “The use of the Hilbert transform in ECG signal analysis,” Comput. Biol. Med., vol. 31, no. 5, pp. 399–406, Sep. 2001.
[26] S. H. Jambukia, V. K. Dabhi, and H. B. Prajapati, “Classification of ECG signals using machine learning techniques: A survey,” in 2015 International Conference on Advances in Computer Engineering and Applications, 2015, pp. 714–721.
[27] W. F. Boron and E. L. Boulpaep, Medical Physiology, vol. 23, no. 2. Elsevier India, 2009.
[28] D. Pandit, L. Zhang, N. Aslam, C. Liu, A. Hossain, and S. Chattopadhyay, “An efficient abnormal beat detection scheme from ECG signals using neural network and ensemble classifiers,” in The 8th International Conference on Software, Knowledge, Information Management and Applications (SKIMA 2014), 2014, pp. 1–6. [29] D. Pandit, L. Zhang, N. Aslam, C. Liu, and S. Chattopadhyay,
“Improved abnormality detection from raw ECG signals using feature enhancement,” in 2016 12th International Conference on Natural Computation, Fuzzy Systems and Knowledge Discovery, ICNC-FSKD 2016, 2016, pp. 1402–1406.
[30] Y. C. Yeh and W. J. Wang, “QRS complexes detection for ECG signal: The Difference Operation Method,” Comput. Methods Programs Biomed., vol. 91, no. 3, pp. 245–254, Sep. 2008. [31] D. Pandit, L. Zhang, C. Liu, S. Chattopadhyay, N. Aslam, and C. P.
C. P. Lim, “A lightweight QRS detector for single lead ECG signals using a max-min difference algorithm,” Comput. Methods Programs Biomed., vol. 144, pp. 61–75, Jun. 2017.
[32] J. Pan and W. J. Tompkins, “A Real-Time QRS Detection Algorithm,” Biomed. Eng. IEEE Trans. DOI - 10.1109/TBME.1985.325532, vol. BME-32, no. 3, pp. 230–236, Mar. 1985.
[33] A. L. Goldberger et al., “PhysioBank, PhysioToolkit, and PhysioNet,” Circulation, vol. 101, no. 23, pp. E215-20, 2000. [34] G. B. Moody and R. G. Mark, “The impact of the MIT-BIH
arrhythmia database,” IEEE Eng. Med. Biol. Mag., vol. 20, no. 3, pp. 45–50, Jun. 2001.
[35] P. Laguna, R. Mark, A. G.-… in C. 1997, and undefined 1997, “A database for evaluation of algorithms for measurement of QT and other waveform intervals in the ECG,” ieeexplore.ieee.org.
[36] A. Taddei et al., “The European ST-T database: standard for evaluating systems for the analysis of ST-T changes in ambulatory electrocardiography.,” Eur. Heart J., vol. 13, no. 9, pp. 1164–72, Sep. 1992.
[37] MathWorks, “Makers of MATLAB and Simulink,” 2016. [Online]. Available: http://www.mathworks.com/. [Accessed: 28-Mar-2017]. [38] M. Hofmann; and R. Klinkenberg;, “RapidMiner: Data Mining Use
A
PPENDIX
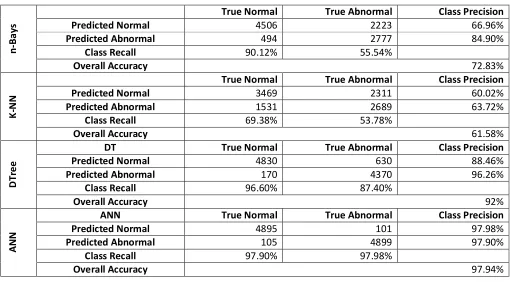
Table I: Classification results on MITDB
n
-B
a
ys
True Normal
True Abnormal
Class Precision
Predicted Normal
4506
2223
66.96%
Predicted Abnormal
494
2777
84.90%
Class Recall
90.12%
55.54%
Overall Accuracy
72.83%
K
-N
N
True Normal
True Abnormal
Class Precision
Predicted Normal
3469
2311
60.02%
Predicted Abnormal
1531
2689
63.72%
Class Recall
69.38%
53.78%
Overall Accuracy
61.58%
D
Tr
e
e
DT
True Normal
True Abnormal
Class Precision
Predicted Normal
4830
630
88.46%
Predicted Abnormal
170
4370
96.26%
Class Recall
96.60%
87.40%
Overall Accuracy
92%
A
N
N
ANN
True Normal
True Abnormal
Class Precision
Predicted Normal
4895
101
97.98%
Predicted Abnormal
105
4899
97.90%
Class Recall
97.90%
97.98%
Overall Accuracy
97.94%
Table II: Classification results on EDB
n
-B
ay
s
True Normal
True Abnormal
Class Precision
Predicted Normal
4672
2435
65.74%
Predicted Abnormal
328
2565
88.66%
Class Recall
93.44%
51.30%
Overall Accuracy
72.37%
K
-N
N
True Normal
True Abnormal
Class Precision
Predicted Normal
3192
2160
59.64%
Predicted Abnormal
1808
2840
61.10%
Class Recall
63.84%
56.80%
Overall Accuracy
60.32%
D
Tr
ee
DT
True Normal
True Abnormal
Class Precision
Predicted Normal
4566
174
96.33%
Predicted Abnormal
434
4826
91.75%
Class Recall
91.32%
96.52%
Overall Accuracy
93.92%
A
N
N
ANN
True Normal
True Abnormal
Class Precision
Predicted Normal
4818
116
97.65%
Predicted Abnormal
182
4884
96.41%
Class Recall
96.36%
97.68%
Table III: Classification results on QTDB
n
-B
ay
s
True Normal
True Abnormal
Class Precision
Predicted Normal
4444
3354
56.99%
Predicted Abnormal
556
1646
74.75%
Class Recall
88.88%
32.92%
Overall Accuracy
60.90%
K
-N
N
True Normal
True Abnormal
Class Precision
Predicted Normal
3170
1997
61.35%
Predicted Abnormal
1830
3003
62.14%
Class Recall
63.40%
60.06%
Overall Accuracy
61.73%
D
T
re
e
DT
True Normal
True Abnormal
Class Precision
Predicted Normal
4885
1943
71.54%
Predicted Abnormal
115
3057
96.37%
Class Recall
97.70%
61.14%
Overall Accuracy
79.42%
A
N
N
ANN
True Normal
True Abnormal
Class Precision
Predicted Normal
4730
362
92.89%
Predicted Abnormal
270
4638
94.50%
Class Recall
94.60%
92.76%
Overall Accuracy
93.68%
Table IV: Classification results on INCARTDB