Spatiotemporal dynamics of brightness coding in human visual cortex
revealed by the temporal context effect
Hao Zhou
a,b,c,d,*, Matthew Davidson
e, Peter Kok
f,g, Li Yan McCurdy
e,h, Floris P. de Lange
f,
Hakwan Lau
e,i,j,k,l, Kristian Sandberg
a,m,**aCenter of Functionally Integrative Neuroscience, Aarhus University, Aarhus, 8000, Denmark bSino-Danish College, University of Chinese Academy of Sciences, Beijing, 100049, China cSino-Danish Center for Education and Research, Beijing, 100190, China
dState Key Laboratory of Brain and Cognitive Science, Institute of Biophysics, Chinese Academy of Sciences, Beijing, 100101, China eDepartment of Psychology, Columbia University, New York, NY, 10027, USA
fDonders Institute for Brain, Cognition, and Behaviour, Radboud University, Kapittelweg 29, 6525, EN Nijmegen, the Netherlands g
Wellcome Centre for Human Neuroimaging, University College London, London, WC1N 3BG, UK hInterdepartmental Neuroscience Program, Yale University, New Haven, CT, 06520, USA iDepartment of Psychology, University of California, Los Angeles, Los Angeles, 90095, USA jBrain Research Institute, University of California, Los Angeles, Los Angeles, 90095, USA kDepartment of Psychology, The University of Hong Kong, Pokfulam Road, Hong Kong
lState Key Laboratory of Brain and Cognitive Sciences, The University of Hong Kong, Pokfulam Road, Hong Kong mHammel Neurorehabilitation and Research Centre, Aarhus University Hospital, 8450, Hammel, Denmark
A R T I C L E I N F O
Keywords: Vision Brightness Illusion
Temporal context effect Magnetoencephalography
A B S T R A C T
Human visual perception is modulated by both temporal and spatial contexts. One type of modulation is apparent in the temporal context effect (TCE): In the presence of a constant luminance patch (a longflash), the perceived brightness of a shortflash increases monotonically with onset asynchrony. The aim of the current study was to delineate the neural correlates of this illusory effect, particularly focusing on its dynamic neural representation among visual cortical areas. We reconstructed sources of magnetoencephalographic (MEG) data recorded from observers (6 male and 9 female human adults) experiencing the TCE. Together with retinotopic mapping, signals from different occipital lobe areas were extracted to investigate whether different visual areas have differential representation of the onset vs. offset synchronized shortflashes. From the data, TCE related responses were observed in LO and V4 in the time window of 200–250 m s, while neuronal responses to physical luminances were observed in the early time window at around 100 m s across early visual cortex, such as V1 and V2, also in V4 and VO. Based on thesefindings, we suggest that two distinct processes might be involved in brightness coding: one bottom-up process which is stimulus energy driven and responds fast, and another process which may be broadly characterized as top-down or lateral, is context driven, and responds slower. For both processes, we found that V4 might play a critical role in dynamically integrating luminances into brightness perception, afinding that is consistent with the view of V4 as a bottom-up and top-down integration complex.
1. Introduction
The human perceptual system employs a number of strategies for optimizing outputs when sensing and interpreting the physical world. It is widely observed that not only the physical properties of a stimulus, but also its embedded context, are essential to generatefinal percepts. Visual perception of a target, including brightness, orientation, size, or location
(Gibson, 1937;Holway and Boring, 1941;Adelson, 1993;Cavanagh and Anstis, 2013), depends strongly on its context in a scene both spatially and temporally (Schwartz et al., 2007). For instance, in the presence of a patch of constant luminance (a longflash), the brightness of a shortflash increases monotonically with onset asynchrony, a phenomenon referred to as the Temporal Context Effect (TCE) (Eagleman et al., 2004).
Brightness is the perceived absolute intensity of light in observer’s
* Corresponding author., 15 Datun Road, Chaoyang District, Beijing, China.
** Corresponding author., Palle Juul-Jensens Boulevard 82. building NBG/10G, 10G-4-06, 8200, Aarhus N, Denmark. E-mail addresses:[email protected](H. Zhou),[email protected](K. Sandberg).
Contents lists available atScienceDirect
NeuroImage
journal homepage:www.elsevier.com/locate/neuroimage
https://doi.org/10.1016/j.neuroimage.2019.116277
Received 5 July 2019; Received in revised form 18 September 2019; Accepted 11 October 2019 Available online 13 October 2019
eye (Gilchrist, 2007). Previous studies (Georgeson, 1987;Rieiro et al., 2012) have shown that the perceived brightness of a staticflash depends not only on its luminance intensity, but also on its duration. Asflash duration increases, subjective brightness reaches a plateau after 100–200 m s. This indicates that before generating a brightness percept, luminance information is collected and integrated across a time window. Beyond this integration time window, brightness of a visual object is assigned and kept. The neural activation pattern is characterized by an early, strong transient response of around 200 m s followed by a sus-tained response that decreases with adaptation (Kinoshita and Komatsu, 2001). In spite of a decrease in neural activation during continuous presentation, the perceived brightness is generally reported as stable although decreases in luminance are more frequently detected than in-creases (Eagleman et al., 2004). Thus, the longflash stimulus changes the overall state of the spiking pool over time (high overall spiking rate during the transient response, lower afterwards), and it could be hy-pothesized that the visual system computes differently the brightness of identical shortflashes with increasing onset asynchrony through com-parison with or thresholding to the overall spike pool. As a result, it is likely that relative timing changes the perceived brightness of the short
flash at the stage of integration.
But where does this integration happen in the human brain? Though disentangling the relationship between the physical luminance and perceptual brightness is one of the fundamental questions in visual neuroscience, it remains poorly understood, especially with respect to the underlying neural mechanisms. Neuronal responses to luminance take place along early visual processing pathway from retina, LGN, and striate cortex (Rossi and Paradiso, 1999; Kinoshita and Komatsu, 2001). Of these areas, only early visual cortex neuronal responses correlate with brightness perception (Rossi et al., 1996; Rossi and Paradiso, 1999; Kinoshita and Komatsu, 2001; Haynes et al., 2004; Roe et al., 2005; Boyaci et al., 2007;Pereverzeva and Murray, 2008;Ruff et al., 2018). Other studies show that higher visual cortex areas such as LO, IPS, and V4 might be specifically involved in brightness coding (Perna et al., 2005; Bushnell et al., 2011;Ruff et al., 2018), rather than early visual cortex (Cornelissen et al., 2006). Yet the locus of brightness perception remains controversial.
Using high-temporal resolution magnetoencephalography (MEG), we recorded neuronal responses directly from human observers who were experiencing the TCE. Sources were reconstructed to multiple regions of the visual cortex with a beamformer algorithm based on whole brain signals. Beamformer methods are becoming more and more prevalent in MEG signal source reconstruction because of their high spatial resolution, and because no prior selection of expected sources is required in this algorithm. Guided by fMRI retinotopic mapping data, signals from different occipital lobe areas were extracted to investigate whether different visual areas had differential representation of luminances under different temporal contexts.
2. Material and methods
2.1. Participants
23 healthy adult humans (9 male) with normal or corrected-to-normal vision gave written informed consent to participate in the behavioral experiment, and 15 of them (6 male) completed both MEG recording and MRI scanning sessions. The ages of the participants were between 23 and 33 years (mean¼26.53, SD¼2.70). The study was approved by the local ethics committee (Commisie Mensgebonden Onderzoek (CMO) Arnhem-Nijmegen, The Netherlands) under the gen-eral ethics approval (Imaging Human Cognition, CMO, 2014/288), and the experiment was conducted in accordance with these guidelines.
2.2. MEG procedure
MEG data was recorded in a magnetically shielded room with a 275
channel CTF Omega whole-head gradiometer system (VSM MedTech, Coquitlam, BC, Canada) with a 1200Hz sampling rate. Head localization was monitored continuously during the experiment using coils that were placed at the cardinal points of the head (nasion and left and right ear canals). An electro-oculogram (EOG) was recorded from the supraorbital and infraorbital ridge of the left eye, and an electrocardiogram (ECG) was recorded, both using 10-mm-diameter Ag–AgCl surface electrodes.
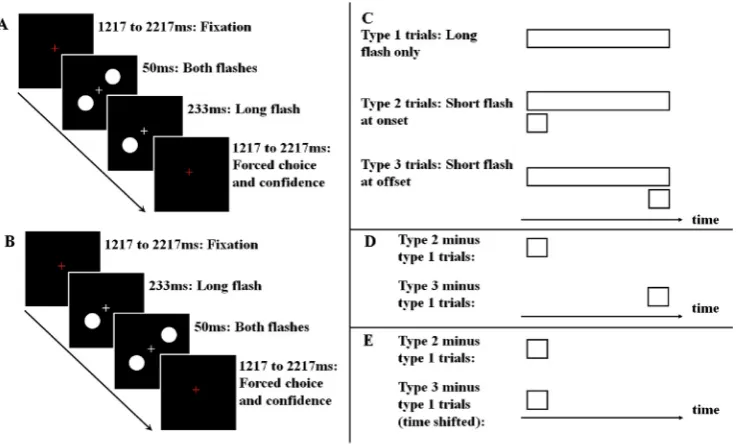
Stimuli were small bright discs on a black background. Stimulus size was 5 degrees of visual angle. The trial procedure is presented inFig. 1. On each trial, a red fixation cross appeared for between 1217 and 2217 m s. This was followed by a short (50 m s) and a long (283 m s)
flash, which were presented either with synchronized onset (Fig. 1A) or offset (Fig. 1B). Duringflash presentations, thefixation cross was white. Eachflash could appear in each of the four quadrants of the screen (with a distance of 3 degrees of visual angle from the centre), but on any given trial the twoflashes were always presented in opposite quadrants (i.e. if the longflash was in the lower right part of the screen, the shortflash would be in the upper left). Finally, atflash offset thefixation cross turned red again, which indicated to participants that they should make a judgment regarding the relative brightness of the twoflashes and report their confidence in this judgment. This was done using one of four response buttons: The left hand was used for report if the leftmostflash appeared brighter, and a response with the middlefinger indicated high confidence whereas a report with the indexfinger indicated low confi -dence. The right hand was used for report if the rightmostflash appeared brighter, and a response with the middlefinger again indicated high confidence whereas a report with the indexfinger again indicated low confidence. Reports of confidence were not used for analyses.
The shortflash was presented atfive different luminances (Fig. S1) for each hemifield: 0, 0.5, 5.8, 11.4, and 16.7 cd/m2respectively for the right hemifield, and 0, 0.5, 7.8, 11.4, and 16.7 cd/m2respectively for the left hemifield. The luminance of the longflash was kept constant during the entire experiment at 7.8 cd/m2for 17 participants and 5.8 cd/m2for the remaining 7. These individual and hemifield-specific calibrations of luminance were performed so that as many participants as possible experienced the brightest shortflash as brighter than the longflash both at onset and offset, and so that all participants experienced the darkest shortflash as darker than the longflash both at onset and offset.
The experiment was divided into blocks of 160 trials, and each participant completed 4-5 blocks (i.e. a total of 640–800 trials). Partici-pants were allowed to take a break between blocks. As shortflashes could be presented in each of four quadrants, have one offive luminances, and appear with either onset or offset synchronized with the longflash, the experiment contained a total of 40 conditions. Each of these conditions was presented four times in each block in pseudo-randomized order. The onset/offset stimuli were pseudo-randomly presented in same blocks.
Stimuli were generated using Psychtoolbox 3 for Matlab (http://www .psychtoolbox.org/) and were projected onto a 47.035.3 cm screen (resolution: 1024768 pixels; refresh rate: 60Hz). The viewing distance was approximately 79 cm.
2.3. MRI procedure
MRI data were acquired with a Siemens Avanto 1.5T MRI scanner (SIEMENS Heathineers Global) at the Donders Centre for Cognitive Neuroimaging, using a 12-channel receive head coil. A gradient echo planar imaging sequence was used to acquire functional images (3.5 mm isotropic voxels, 32 axial slices of 3.5 mm thickness, 128128 matrix
with 3.5 mm in-plane resolution, TR/TE¼2280/40 m s, flip
angle¼80). A high-resolution anatomical volume was obtained with a T1 MPRAGE sequence (1 mm isotropic voxels, 176 sagittal slices at 1 mm
thickness, 256256 matrix with 1 mm in-plane resolution, TR/
TE¼2290/2.95 m s,flip angle¼15).
reversing at 5 Hz, was centered on afixation point, cycling 15per TR across the full visualfield within 27.48 s clockwise in thefirst half scan and counter-clockwise in another half scan. In each direction, the wedge rotated 12 cycles in total.
Stimuli were presented by an MRI safe projector onto a 38.028.5 cm screen (resolution: 1024768 pixels; refresh rate: 60Hz). The viewing distance was approximately 80 cm.
2.4. MEG data preprocessing
Using the MNE-Python package (Gramfort et al., 2013), data were band-pass filtered at 0.1–40 Hz. Trials were epoched as data ranging between 200 m s before stimulus onset and 600 m s after stimulus onset. MEG time courses of these trials were visually inspected, and trials with signals exceeding standard threshold (Magnetometer>51012T) were rejected. Minimum 597 trials were retained among all the partici-pants. The epoched data were downsampled to 500 Hz and were baseline-corrected between200 and 0 m s.
2.5. Source reconstruction
Source-space activity time courses of each experimental condition were reconstructed with a unit-noise-gain linear constrained minimum variance (LCMV) beamformer (VanVeen et al., 1997; Sekihara and Nagarajan, 2008). This method creates a spatialfilter, which provides an estimate of source response at a given location while suppressing infl u-ence coming from other sources. No a priori selection of expected acti-vated sources is required, making it a well-suited method for multi-region brain source response reconstruction. Head model and forward compu-tation grid of 2 mm isotropic were calculated based on individual T1 weighted MRI data. Head position coils and biological landmarks in the nasion and auricular points allowed for alignment of the MEG and MRI data. Freesurfer (Fischl, 2012) and the MNE software package were co-utilized in anatomical segmentation and co-registration.
A common data shrunk-covariance matrix (Engemann and Gramfort, 2015) was estimated for all experimental conditions from the sensor space epoched data in the time interval of 0–600 m s after stimulus onset, and noise covariance matrix was estimated from the baseline period of 200 m s–0 m s before stimulus onset. Apart from the bandpassfiltering
during preprocessing, the data were not additionally filtered before beamforming. The covariance matrices were regularized with the factor of 0.05. A commonfilter with same potential leakage was used for each experimental condition or contrast in order to reconstruct time courses of evoked data by taking norm power of the three orientations.
The evoked data were derived from either long-flash-only or short
flash trials. The shortflashes were contrasts of shortflash subtracting long-flash-only trials before source reconstruction. Four non-zero levels of luminance as well as onset and offset synchronized shortflashes were reconstructed separately.
2.6. Retinotopic mapping
MRI data were analyzed with AFNI software package (Cox, 1996), Freesurfer, and customized Python code. Functional images were cor-rected for motion distortion. The high-resolution T1 volume was co-registered to the mean volume of the corrected functional images. A cross-correlation method embedded in AFNI @RetinoProc was used to
find the preferred polar angle position for each voxel. In addition to fMRI retinotopic mapping, a T1 anatomical based retinotopic mapping ( Ben-son et al., 2012,2014) was reconstructed as a reference. ROIs in the vi-sual cortex (V1, V2, V3, V3ab, V4, VO, MT, and LO) were defined according to the functional and anatomical retinotopic maps on indi-vidual subject’s inflated gray matter surface.
2.7. Statistical analysis
The differences between onset and offset synchronized shortflashes of different luminances in behavioral and MEG experiments were tested using two-tailed paired T-tests across subjects provided by Scipy package (Oliphant, 2007). Statistical effects of the MEG data were further cor-rected for multiple comparison with cluster-based permutation test (Maris and Oostenveld, 2007) across the time course and different visual areas.
3. Results
3.1. Behavioral results
For each participant, the mean proportion of trials for which the short
Fig. 1.Experimental paradigm. On each
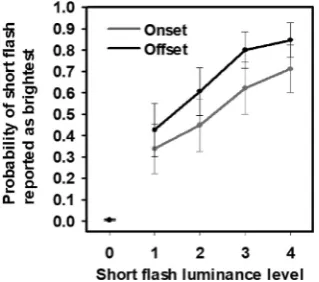
flash was reported to be brighter than the longflash was calculated across luminances and temporal position of the short flash (whether it was presented synchronized to the onset or offset of the longflash). The group means are plotted inFig. 2. A mean across all above-zero luminances was also calculated for the onset and offset conditions for all participants, and as expected the shortflash at offset was more frequently reported as brighter than the longflash (67.0%, 95% CI: 58.1–75.9%) compared to the shortflash at onset (53.0%, 95% CI: 42.0–64.0%). At-test confirmed that this difference of 14.0% (95% CI: 6.5–21.6%) was statistically sig-nificant (t(22)¼3.84, p<0.001).
3.2. Source analysis of the long and shortflash representations
MEG sources were reconstructed respectively from individual-participant averages for the three analysis conditions mentioned in Ma-terials and Method: long flash only (Figure S2A), onset synchronized shortflash minus longflash only (Figure S2B), and offset synchronized short flash minus longflash only (Figure S2C). Before source recon-struction on shortflash conditions, we subtracted longflash contribu-tions in sensor space (Fig. 1C, D). This on one hand minimized irrelevant signal contaminations, and on the other hand avoided potential multiple source correlation in time (a leading constraint in adaptive spatial
filtering method) (VanVeen et al., 1997). Time courses of the offset synchronized shortflashes were shifted backward by 233 m s, so that both shortflash conditions were temporally aligned (Fig. 1E). As shown in Fig. S3, cortical responses to onset and offset synchronized short
flashes at different luminance levels were plotted separately in different visual cortical areas.
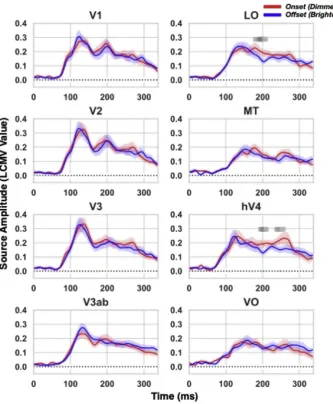
Source activity from the onset and offset synchronized shortflash conditions was compared to delineate the neural correlates of the illusory effect. As shown inFig. 3, significantly larger source activities from onset synchronized shortflashes were observed compared to those from offset synchronized shortflashes in LO and V4, peaking at 200 and 204 m s respectively (t(14)¼4.24, p¼0.00081; t(14)¼3.69, p¼0.0024). A later significant difference was observed only in V4, peaking at 250 m s (t(14)¼3.05; p¼0.0086), with activity being stronger for onset than for offset synchronized shortflashes. Somewhat surprisingly, compared to perceptually dimmer onset synchronized shortflashes, smaller responses in LO or V4 corresponding to perceptually brighter offset synchronized
short flashes were evident throughout the late time window of
200–250 m s (see also in Supplemental Fig. S4, hemisphere-specific analysis). Thisfinding nevertheless appears in line with some previous literature as we address in the Discussion.
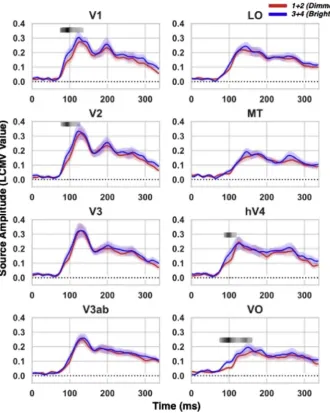
We further compared differential brightness representations induced by physical luminances in visual cortical areas. As shown inFig. S1, the physical luminances were divided into two groups: lower luminances consist of 0.5 cd/m2 and 5.8 cd/m2 (or 7.8 cd/m2) luminance short
flashes; and higher luminances consist of 11.4 cd/m2and 16.7 cd/m2 luminance shortflashes. From behavioral tests inFig. 2, we observed that the higher luminances were reported more frequently brighter than the longflash compared to the lower luminances, indicating that the increase of luminance intensity was a linear factor of subjective brightness enhancement within the spectrum of luminance levels in this study. Source activity from the two groups of luminances were compared to further examine the dynamic neuronal response differences driven by differential physical input. As shown in Fig. 4, significantly stronger source responses to higher luminance was observed in V1, V2, V4, and VO peaking at 98, 98, 104, and 104 m s respectively (t(14)¼8.26,
p¼0.00000094; t(14)¼6.15, p¼0.000025; t(14)¼5.41,
p¼0.000091; t(14)¼7.32, p¼0.0000037). Further linear regression was conducted in the time window of 100 m s, showing a strong corre-lation between the change of luminance intensities and MEG responses in V1, V3, V4, and VO (see inSupplemental Fig. S6).
Taken together, only V4 activity was statistically significantly different for changes in perceived brightness induced by both illusion and physical luminance change (with differences in latency in the two cases). We discuss how thisfinding might be interpreted and its signifi -cance below.
4. Discussion
We investigated how the human visual system differentially processes luminance depending on temporal context, specifically how bright a shortflash is perceived in the presence of a longflash, depending on whether the shortflash is onset or offset synchronized with the longflash. Our behavioral data replicated the Temporal Context Effect (TCE) (Eagleman et al., 2004) across different luminance levels, showing that the offset synchronized short flashes are more frequently rated as brighter than a longflash compared to equiluminant onset synchronized ones.
Source reconstructed MEG brain activity related to onset and offset synchronized shortflashes were compared to delineate the neural cor-relates of the illusory effect across selected occipital lobe areas. We observed strong TCE related responses in LO and V4 peaking at around 200 m s and 250 m s. No statistically significant differences were observed in other visual areas after correction for multiple comparisons. It is likely that during the early period of processing, neuronal responses to luminance are propagating from lower to higher visual areas. Since the two shortflashes were physically identical in luminance and duration, no differences in terms of neuronal responses should be expected–at least in an early time window–in early retinotopic areas of the visual hierarchy. Integration of the propagated information is likely to befinished later in LO and V4, where the TCE related differences were detected, showing that the context dependent integration happens in a rather late stage of visual processing both spatially and temporally. This is consistent with previousfindings showing that spatially higher visual areas are involved in illusory brightness representation (Perna et al., 2005;Bushnell et al., 2011;Ruff et al., 2018), but not the early visual cortex (Cornelissen et al., 2006).
But does this neural integration mechanism overlap temporally or spatially with physical luminance processing? We observed neuronal responses to physical luminances were mainly localized at around 100 m s across early visual cortex, such as V1, V2, and also in V4, VO. No statistically significant differences were observed in LO and V4 in the late time window of 200–250 m s. This indicates that a separate sensory process might account for brightness coding driven by physical energies,
Fig. 2. Temporal Context Effect (TCE), behavioral data. The probability of
reporting the shortflash as brighter than the longflash is plotted across par-ticipants as a function of shortflash luminance. The shortflash hasfive lumi-nance levels: 0, 0 cd/m2, 1, 0.5 cd/m2; 2, 5.8 or 7.8 cd/m2; 3, 11.4 cd/m2; 4, 16.7 cd/m2. The shortflash luminance level of zero corresponds to no shortflash
where early visual cortex as well as VO/V4 together compute luminance information into brightness percepts at an earlier stage of visual pro-cessing. These findings are broadly consistent with previous studies showing that brightness perception driven by physical luminance change correlates with neuronal responses in early visual cortex (Rossi et al., 1996;Rossi and Paradiso, 1999;Kinoshita and Komatsu, 2001;Haynes et al., 2004; Roe et al., 2005; Boyaci et al., 2007; Pereverzeva and Murray, 2008;Ruff et al., 2018). The current study uses subtraction logic to identify the neural correlate of the TCE brightness effect. One limita-tion of this subtraclimita-tion method is that it ignores non-linear neuronal interactions. Future research can address this by including, for instance, a parametric manipulation of the lag between the short and longflash. Note that, in the current study, we report a significant correlation be-tween participants’brightness reports and their MEG responses in the time window of 200–250 m s, suggesting that the MEG responses measured here did to some extent reflect brightness processing (See in Supplemental Fig. S5). Furthermore, linear regression was conducted in the representative time window of 100 m s, showing that a strong cor-relation of source amplitudes in V1, V3, V4, and VO (also noticeable in V2) with the increase of luminance levels.
The divergentfindings for physical and illusory effects may be un-derstood further in the context of theoretical work regarding V4 and in the context of the literature on M/EEG correlates of perceptual aware-ness, in particular the literature on Visual Awareness Negativity (VAN). According to Koivisto and Revonsuo (2010, p. 925), the VAN often starts
shortly after 100 m s after stimulus onset, typically peaks at 200–250 m s, but can in some cases occur as late as 400 m s. A number of EEG and MEG studies have observed activity in this time window related to perceptual experience more than to physical stimulus characteristics (Koivisto and Revonsuo, 2010;Sandberg et al., 2013,2014;Andersen et al., 2016). Particularly the MEG studies have shown clearly that the time window contains two peaks in the event related signal (e.g. bothSandberg et al. (2013) and Andersen et al. (2016) identified peaks at around 180–190 m s and 270–290 m s), but it is unclear what the role of each of those peaks are. It has also been difficult to establish whether one of the peaks is more consistently related to perceptual experience across para-digms than the other. For both peaks, however, it appears that activity in intermediate/higher stages of the visual processing hierarchy are the most predictive of perceptual experience at the single source level, yet lower stages of processing are equally predictive when multiple sources are combined in multivariate analyses (Sandberg et al., 2013). This last observation is consistent with ourfinding of V4 being related to the experience of brightness for both physical and illusion manipulations in the present study.
The stimulus driven differences in brightness perception coincide temporally with the earliest observations of thefirst VAN peak (often peaking 130–180 m s after stimulus onset) whereas the illusion driven differences coincide with the later part (often peaking 200–290 m s after onset). This is interesting when viewed in the context of recent theoret-ical work regarding the functional role of V4. Some recent evidences
Fig. 3.Time aligned comparison between onset and
indicate that V4 plays a role in brightness coding (Bushnell et al., 2011; Ruff et al., 2018), but also in integrating various visual information, such as color, shape, depth, motion (Roe et al., 2012).Roe et al. (2012) emphasize that V4 is an area of importance in mediating bottom-up and top-down effects, and propose that feature representation in V4 is tightly linked anatomically/functionally to feature-specific networks, thus becoming a modulator of domain networks and enabler of selective feature extraction. When viewed in this context, they point out, there may be surprisingly little difference between object-induced effects and what they refer to as attentionally induced effects. The“surprisingly little difference” in our stimulus driven and illusion driven brightness en-hancements could be thought of as the difference in timing: In thefirst case, the brightness modulation is established already in the part of the transient signal that is dominated by feedforward and local feedback signals whereas in the latter case, the brightness modulation is estab-lished slightly later when feedback from more distant areas are integrated.
That the temporally extended response correlates negatively with perceived brightness was surprising and contrary to our initial predic-tion. This result, however, is consistent with a previous electrophysio-logical study (Ruff et al., 2018) showing that V4 activity may, on average over an extended period, respond to subjectively brighter objects in a way that is opposite to early visual areas and opposite to the perceived brightness. One interpretation is that for more certain information, less
energy/activity is required to encode at higher processing stages. Given this surprising finding, we cannot rule out that ultimately brightness perception under the TCE may depend also on even higher-up areas, such as those in the temporal, parietal, and prefrontal cortices. Indeed, one of the features of the TCE was that the effect does not seem to be retinotopically specific;Eagleman et al. (2004)reported that the effect remained similar regardless whether the long and short flashes are spatially in the same quadrant or not. It should be noted that in order to get detailed information on distinct occipital areas, our MEG source reconstruction was guided by an fMRI localizer. This localizer we used is suitable for distinguishing occipital areas only, and our method thus limits us to examine these areas only, and not later, e.g. parie-tal/temporal, areas in the visual processing stream, or frontal areas. In order to examine areas higher up the stream, different localizers would have to be employed (Silver and Kastner, 2009). For this reason, we cannot conclude on the role of later areas such as the intraparietal sulcus (Perna et al., 2005), which might also be involved in brightness perception. Future studies may benefit from different experimental de-signs targeted for these higher regions.
Furthermore, it should be noted that, as always, the non-significance of the results in some of the examined occipital areas should not be interpreted as evidence of no involvement. It may indeed be that multiple areas are involved, but without significant results, our conclusions regarding V4 cannot be extended to these areas, and neither do we
Fig. 4. Time aligned differences between lower and
conclude that V4 is the only relevant area.
It may also be noted that the TCE and other effects like it are at least to some extent contrast effects rather than (purely) brightness effects as a similar, but smaller, effect is observed in the other direction when the luminance of stimulus and background are reversed (Claessens et al., 2015).
Finally, the influence on the results of a number of processes that might differ between conditions should be considered. Binding and attention might differ between conditions, but since the stimuli are presented above the threshold of awareness in all conditions, it would be reasonable to expect that these processes do not differ substantially across conditions. Working memory is another candidate given the small, but consistent difference of 200 m s between percept and report. In the terminology ofAru et al. (2012), we might thus identify an NCC-co (a consequence of consciousness). This would, nevertheless, be a somewhat surprising explanation, as the time window we examine is often dis-cussed in terms of whether it is an NCC or an NCC-pr (i.e. a prerequisite of consciousness) whereas typically later components like the P3a and P3b are discussed as potential NCC-cos. In addition, it is indeed a concern for future research to parametrically modulate the TCE to rule out con-founding from other perceptual effects.
5. Conclusions
Taken together, our data indicate that V4 plays a critical role in dynamically integrating luminance information into brightness percep-tion. We suggest that two distinct perceptual processes might be involved in brightness coding: one“low level process”which is energy driven; the other“high level process”which is context driven. The low level, energy driven process responds faster (dominated by lower visual cortices, such as V1/V2, also VO/V4), while the high level, context driven process re-sponds much slower (dominated by higher visual cortices, such as LO/ V4). Either process could alone (independently) have the capacity to influence subjective awareness of brightness. In a more complex natural scene, it is likely that both systems are working together in sensing and interpreting the physical world, possibly together with contribution from higher mechanisms in the temporal, parietal, and prefrontal.
Acknowledgements
This work was supported by the John Templeton Foundation Grant No. 21569 (to HL&FdL). This article is based upon work from COST Action CA18106, supported by COST (European Cooperation in Science and Technology).
Appendix A. Supplementary data
Supplementary data to this article can be found online athttps://doi. org/10.1016/j.neuroimage.2019.116277.
References
Adelson, E.H., 1993. Perceptual organization and the judgment of brightness. Science 262, 2042–2044.
Andersen, L.M., Pedersen, M.N., Sandberg, K., Overgaard, M., 2016. Occipital MEG activity in the early time range (<300 ms) predicts graded changes in perceptual consciousness. Cerebr. Cortex 26, 2677–2688.
Aru, J., Bachmann, T., Singer, W., Melloni, L., 2012. Distilling the neural correlates of consciousness. Neurosci. Biobehav. Rev. 36, 737–746.
Benson, N.C., Butt, O.H., Brainard, D.H., Aguirre, G.K., 2014. Correction of distortion in flattened representations of the cortical surface allows prediction of V1-V3 functional organization from anatomy. PLoS Comput. Biol. 10.
Benson, N.C., Butt, O.H., Datta, R., Radoeva, P.D., Brainard, D.H., Aguirre, G.K., 2012. The retinotopic organization of striate cortex is well predicted by surface topology (vol 22, pg 2081, 2012). Curr. Biol. 22, 2284-2284.
Boyaci, H., Fang, F., Murray, S.O., Kersten, D., 2007. Responses to lightness variations in early human visual cortex. Curr. Biol. 17, 989–993.
Bushnell, B.N., Harding, P.J., Kosai, Y., Bair, W., Pasupathy, A., 2011. Equiluminance cells in visual cortical area V4. J. Neurosci. 31, 12398–12412.
Cavanagh, P., Anstis, S., 2013. Theflash grab effect. Vis. Res. 91, 8–20.
Claessens, P.M.E., Pereira, L.O., Baldo, M.V.C., 2015. Modulation of perceived contrast in the brightness comparison of asynchronous stimuli. Atten. Percept. Psychophys. 77, 234–248.
Cornelissen, F.W., Wade, A.R., Vladusich, T., Dougherty, R.F., Wandell, B.A., 2006. No functional magnetic resonance imaging evidence for brightness and colorfilling-in in early human visual cortex. J. Neurosci. 26, 3634–3641.
Cox, R.W., 1996. AFNI: software for analysis and visualization of functional magnetic resonance neuroimages. Comput. Biomed. Res. 29, 162–173.
Eagleman, D.M., Jacobson, J.E., Sejnowski, T.J., 2004. Perceived luminance depends on temporal context. Nature 428, 854–856.
Engemann, D.A., Gramfort, A., 2015. Automated model selection in covariance estimation and spatial whitening of MEG and EEG signals. Neuroimage 108, 328–342. Fischl, B., 2012. FreeSurfer. Neuroimage 62, 774–781.
Georgeson, M.A., 1987. Temporal properties of spatial contrast vision. Vis. Res. 27, 765–780.
Gibson, J.J., 1937. Adaptation, after-effect, and contrast in the perception of tilted lines. II. Simultaneous contrast and the areal restriction of the after-effect. J. Exp. Psychol. 20, 553–569.
Gilchrist, A.L., 2007. Lightness and brightness. Curr. Biol. 17, R267–R269. Gramfort, A., Luessi, M., Larson, E., Engemann, D.A., Strohmeier, D., Brodbeck, C.,
Goj, R., Jas, M., Brooks, T., Parkkonen, L., Hamalainen, M., 2013. MEG and EEG data analysis with MNE-Python. Front. Neurosci. 7, 267.
Haynes, J.D., Lotto, R.B., Rees, G., 2004. Responses of human visual cortex to uniform surfaces. Proc. Natl. Acad. Sci. U. S. A. 101, 4286–4291.
Holway, A.H., Boring, E.G., 1941. Determinants of apparent visual size with distance variant. Am. J. Psychol. 54, 21–37.
Kinoshita, M., Komatsu, H., 2001. Neural representation of the luminance and brightness of a uniform surface in the macaque primary visual cortex. J. Neurophysiol. 86, 2559–2570.
Koivisto, M., Revonsuo, A., 2010. Event-related brain potential correlates of visual awareness. Neurosci. Biobehav. Rev. 34, 922–934.
Maris, E., Oostenveld, R., 2007. Nonparametric statistical testing of EEG- and MEG-data. J. Neurosci. Methods 164, 177–190.
Oliphant, T.E., 2007. Python for scientific computing. Comput. Sci. Eng. 9, 10–20. Pereverzeva, M., Murray, S.O., 2008. Neural activity in human V1 correlates with
dynamic lightness induction. J. Vis. 8, 8 1–10.
Perna, A., Tosetti, M., Montanaro, D., Morrone, M.C., 2005. Neuronal mechanisms for illusory brightness perception in humans. Neuron 47, 645–651.
Rieiro, H., Martinez-Conde, S., Danielson, A.P., Pardo-Vazquez, J.L., Srivastava, N., Macknik, S.L., 2012. Optimizing the temporal dynamics of light to human perception. Proc. Natl. Acad. Sci. U.S.A. 109, 19828–19833.
Roe, A.W., Lu, H.D.D., Hung, C.P., 2005. Cortical processing. of a brightness illusion. Proc. Natl. Acad. Sci. U.S.A. 102, 3869–3874.
Roe, A.W., Chelazzi, L., Connor, C.E., Conway, B.R., Fujita, I., Gallant, J.L., Lu, H., Vanduffel, W., 2012. Toward a unified theory of visual area V4. Neuron 74, 12–29. Rossi, A.F., Paradiso, M.A., 1999. Neural correlates of perceived brightness in the retina,
lateral geniculate nucleus, and striate cortex. J. Neurosci. 19, 6145–6156. Rossi, A.F., Rittenhouse, C.D., Paradiso, M.A., 1996. The representation of brightness in
primary visual cortex. Science 273, 1104–1107.
Ruff, D.A., Brainard, D.H., Cohen, M.R., 2018. Neuronal population mechanisms of lightness perception. J. Neurophysiol. 120 (5), 2296–2310.
Sandberg, K., Bahrami, B., Kanai, R., Barnes, G.R., Overgaard, M., Rees, G., 2013. Early visual responses predict conscious face perception within and between subjects during binocular rivalry. J. Cogn. Neurosci. 25, 969–985.
Sandberg, K., Barnes, G.R., Bahrami, B., Kanai, R., Overgaard, M., Rees, G., 2014. Distinct MEG correlates of conscious experience, perceptual reversals and stabilization during binocular rivalry. Neuroimage 100, 161–175.
Schwartz, O., Hsu, A., Dayan, P., 2007. Space and time in visual context. Nat. Rev. Neurosci. 8, 522–535.
Sekihara, K., Nagarajan, S.S., 2008. Adaptive Spatial Filters for Electromagnetic Brain Imaging. Springer, Berlin.
Silver, M.A., Kastner, S., 2009. Topographic maps in human frontal and parietal cortex. Trends Cogn. Sci. 13, 488–495.
![2,7,12 Tris(2 bromoethoxy) 3,8,13 trimethoxy 10,15 dihydro 5H tribenzo[a,d,g]cyclononaene](data:image/gif;base64,R0lGODlhAQABAIAAAP///wAAACH5BAEAAAAALAAAAAABAAEAAAICRAEAOw==)