Available Online at www.ijcsmc.com
International Journal of Computer Science and Mobile Computing
A Monthly Journal of Computer Science and Information Technology
ISSN 2320–088X
IMPACT FACTOR: 5.258
IJCSMC, Vol. 5, Issue. 6, June 2016, pg.320 – 330
Image Resolution Technique
Archana
World College of Technology and Management, Jhajjar, Haryana - India
Abstract
To study related to Image Resolution requires a lot no. of experimental work involving using software modeling and testing with many sets of images. This paper is presenting an overview of the fundamental steps of Image Resolution some description of the layouts and the working of an experimental software system that has been developed and executed using MATLAB is introduced. In this modeling system, a user friendly GUI is developed and some alternative methods for image acquisition are executed. Few algorithms based on computing operators for image Resolution are studied, programmed and examined. This research paper also includes an analysis and a software executed for an image comparing technique.
Key words – Image resolution, edge detection, smoothing, comparing, computing operators
1. INTRODUCTION
1.1 Image Resolution
Image resolution tells us about the detail an image can hold. More details require higher resolution of the image. Image resolution can be defined in many forms. As Resolution tells us how well we are able to identify two objects separately which are placed closely to each other.
The Image resolution can be expressed in many forms. (a)Pixel resolution
It is the sensor’s ability to observe a small object with clear details and distinct boundaries. It depends on the pixel size. The smaller size implies the higher resolution and the clearer image. Smaller pixel sizes shows that images consist of more number of pixels. Another way to represent the resolution as the total number of pixels, another way could include describing pixels/ unit length or pixels/unit area.
(b)Spatial resolution
It determines the clarity of the image. It refers to the number of pixels used for image construction. Higher spatial resolution is an indication of a greater number of pixels
(c) Resolution in Spectre
(d)Resolution in terms of Temporal
Temporal resolution (TR) is the ability of an image to measure precisely with respect to given time. Movie cameras are used to resolve events at different times. The time resolution vary from 24 to 48 frames per second (frames/s), or 50 to 300 frames/s, or even more.
(e)Intensity resolution
It shows how finely a system can represent different color intensities, and is usually expressed as number of bits, say 8 bits or 256 levels which is the most common scenario used for images. The higher the number of bits higher the radiometric resolution.
In the next section of this paper, some of the fundamental steps of image Resolution and analysis are briefly presented. Most of the algorithms and methods being executed as software programs in this paper are basically related to the theory described in this. The developed software is described in terms of its basic architecture and operation. Experimental results are used to illustrate the main functions performed by the software in section 3, and section 4, is dedicated for presenting results of those experimental examples with one input image being considered to form a case study. Obtained output images are tabulated under two headings to show the performance of different computing operators used for image edge detection. Further, in this section a discussion of the results is presented as well as performance evaluation. Section 5 includes concluding remarks about the material presented in this paper. Lastly, a list of references is appearing in section 6.
2. FUNDAMENTAL STEPS IN IMAGE RESOLUTION
Various techniques were proposed for
(i)
De-noising, and
(ii)
Image super resolution.
2.1
De-noising techniques -
Various algorithms for de-noising the images were proposed
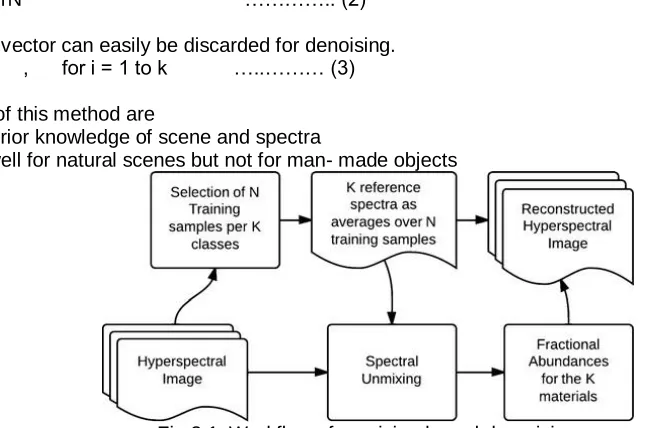
2.1.1 Noise Reduction Through Spectral Unmixing
For a given spectra any pixel can be represented in terms of combination of the spectral components. These components are calculated from the observed ground truth images. If noise is present it lies outside our class of interest, it contains unwanted influences and hence cannot be expressed as combination of reference spectra or we can say that it is expressed as residue vector. [2]
m = ∑ Xi*Si + r , for i = 1 to k …………. (1)
r = r1 + r2 + rN ………….. (2)
The residue vector can easily be discarded for denoising. m = ∑ Xi*Si , for i = 1 to k …..……… (3)
Drawbacks of this method are
(i) Require prior knowledge of scene and spectra
(ii)It works well for natural scenes but not for man- made objects
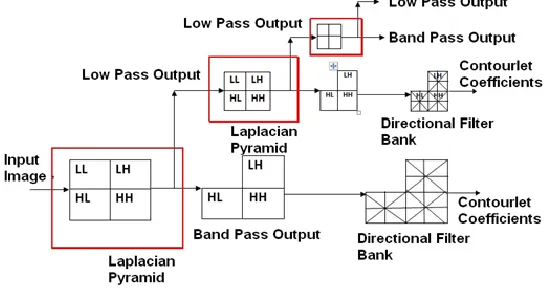
2.1.2. Image Denoising using Contourlet Transform
The main role of using transform for denoising is preserving the edges but earlier proposed wavelet transforms were not able to do so hence contourlet transform came into existence it not only maintains the edges but also connects if there is any discontinuity. Input image is passed through various banks of filters to produce contourlet coefficients.[3]
Fig 2.2 :Contourlet transform coefficient estimation
Now for the purpose of denoising these coefficients are compared against threshold. If pixels are corrupted the are discarded else they are preserved for image reconstruction
Drawback of this method is problem in estimation of threshold and the parameters used to decide the threshold.
2.1.3. Denoising Using Partial Differential Equations
Major advantage of this method is it used noise free image for denoising a corrupted image. Though ideally a complete noise free image can’t be obtained but in certain bands the signal to noise ratio is comparatively very high the images obtained from these bands can act as reference noise free images. [4]The variation between the edge direction and edge intensity of reference noise free image and corrupted image is used to remove the noise and conserve the details. As for multispectral images edges between the noisy image and reference noise free image are similar.
2.1.4. Denoising Using Spatial Preprocessing
This is an extended version of end-member extraction. Not only the abundant end-members but also the rare end-members are extracted using this approach. Abundant end-members can easily be estimated but for rare end-member end extraction variation with the background is estimated. These rare end-members are of great importance as they represent rare materials, military targets etcas they are different from the background their variance will be high. [5]Hence points showing variance greater than threshold are extracted, which represent rare end-members. Finally, these end-members are added with earlier extracted abundant end-members.
2.1.5. Legendre Fenchel Transformation for denoising
Fig 2.4 : Design methodology of Legendre Fenchel Transformation for denoising
2.2. Super Resolution Techniques -
Super resolution produces the HR image and overcome the limitations of image capturing device. The easiest and direct way to increase resolution is to reduce the pixel size. Other approach is recovering the HR image by fusing the LR images, on the basis of certain assumptions. The fundamental requirement is (i) recovered HR images should produce the same LR image when reverse process is applied. However, because limited number of LR images and unknown blurring the solution is not unique.
2.2.1 The SR algorithms are first classified based on their number of input images
(i) Super Resolution techniques using multi-image (ii) Super Resolution techniques using single-image.
(i)requires many LR images as inputs to produce the HR output While (ii) requires single low resolution image as inputs to produce the high resolution output
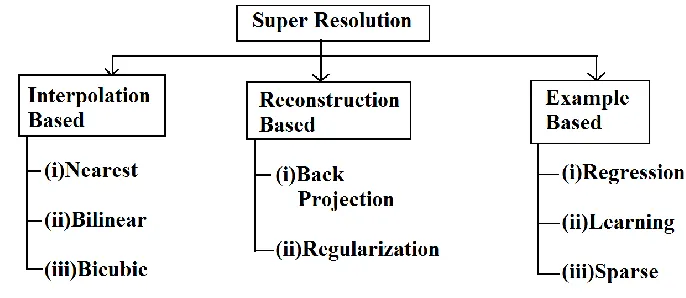
2.2.2 Classification on the basis of techniques used [9]: a). interpolation techniques
b). Methods based on Reconstruction and c). Methods based on Example
a). Interpolation is a technique for achieving new unknown pixel values usingknown pixel values within certain range. Basically interpolation techniques classified into: [10]
(i)nearest neighbor, (ii)bilinear and
(iii)bicubic interpolation.
(i)In nearest neighbour technique it fills the pixel with nearest neighboring pixel value. Result of generated image is smoother.
(ii)While in bilinear interpolation method, pixel value is estimated by the weighted average of nearest four pixel value.it generate better resolution image than the nearest neighbor method. But it creates blurry image and poor preservation of high frequency components like edges and corner.
(iii) Bicubic interpolation in which the pixel value determined by estimate weighted average of nearest 16 pixel value and produce the better resolution image than bilinear interpolation method.
b).Methods based on Reconstruction
These methods include
(i). Iterative Back Projection method and (ii). Regularization method
(i). Iterative Back Projection method
(ii). Regularization method
The basic idea of regularized SR approach is to incorporate some prior knowledge about the desired HR image to constrain the solution space. Total regularization term is used to guide iterative back-projection process and minimize the SR reconstruction error[11].
These Reconstruction based methods can partly reduce the edge blurring and jagged artifacts caused by interpolation based methods. However, these methods are still limited to small increase in spatial resolution.
c).Example based techniques
These methods aim at estimating the HR image by employing a dictionary of patch correspondences. The dictionary specifies the relationship between the HR image patch and its LR patch. Patch can be built by either internal similarities or from the set of external training images. This type of algorithm consists of two steps: a training step and SR step. In the training step, LR image is partitioned into the overlapping patches. Then for LR patch, by using the LR-HR patch correspondences, HR image is estimated. In SR step, the final HR output is constructed by reassembling the all the estimated HR patches. [12] This method further classified into the following categories:
(i). Learning based method (ii). Regression based method (iii). Sparse coding method
(i). Learning based method
For each LR patch several LR patches are found by estimating the nearest neighbors in the dictionary. Later on HR patches are combined to generate the HR image.
(ii). Regression based technique
The relationship between the LR patches and the HR patches is learned by regression function. LR training is chosen according to the similarity between LR patches and LR test patch. , HR training set identified corresponding to the LR training set. . Finally the unique estimation of the desire HR patch is generated using the regression function.
(iii). Sparse coding method
It uses two dictionaries trained from LR and HR images as training dataset. [13] This method forces that HR as well as LR Image patches share the same sparse representation.
These Example based methods require enormous database and hence are computationally expensive.
Fig 2.7 : Classification of Super Resolution Techniques
3. THE SOFTWARE DESCRIPTION AND OPERATION
3.1 Image Super resolution using sparse representation
This algorithm utilizes the fact that each pair of HR as well as LR image patches share the same sparse coefficients. A LR patch can be expressed as
Where Dl is dictionary formed by randomly reading patches from LR training database images and ALPHA (α) are the sparse coefficients. Similarly, A high resolution patch can be expressed as
Eq. x=Dh* α …………..(5)
Where Dh is dictionary formed by reading different patches from HR training database images and ALPHA (α) are the corresponding sparse coefficients.
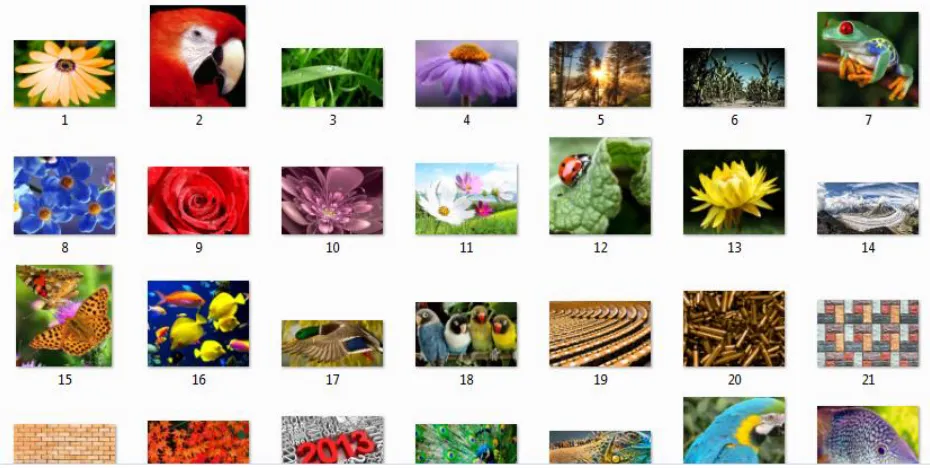
(i)Prepare the database
For preparing the database high resolution images of similar statistical nature are downloaded from internet (images like natural scenes, flowers, buildings, flowers, animals etc)
Fig 3.1 : HR Database (HR training images)
For LR database images are formed by down sampling the HR images. As Low resolution database is formed by down sampling the corresponding high resolution database this can efficiently be used for the extraction of sparse coefficients ensuring that both low and high resolution patches share same sparse representation.[15]
Different datasets are formed by varying the number of training images (i) 30 images
(ii) 50 images (iii) 70 images
(ii)Dictionary building
Dictionaries are trained by randomly sampling various patches from given database images. High resolution Dictionaries are formed by randomly sampling raw patches from high resolution training images and low resolution Dictionaries are formed by randomly sampling raw patches from corresponding low resolution training images.[17,18]
Additionally we have different possible combinations for dictionaries by varying the patch size ie… 3x3 or 5x5 or 9x9 and changing the resultant dictionary size ie… 512 or 1024 or 2048
Fig:512 size dictionary formed by using 9x9 patch size
Fig: 1024 size dictionary formed by using 9x9 patch size
The four filters used for extraction are O1 = [-1,0,1]
O2=transpose of O1 O3 =[1,0,-2,0,1] O4=transpose of O3
These feature vectors are combined as one vector to represent LR patch. These filters are applied to the training images. Patches are extracted from the four images and then are combined to form the required feature vector array. In practice, we first up-sample the LR image using bicubic interpolation, and then apply these operators.
(iii)Sparse Coding
The whole process is divided into following parts :- (a)Sparse coefficient generation
(b)high patch generation
(iv) Output Reconstruction
As both low resolution patch and high resolution patch patches have the same sparse representations the sparse coefficients obtained from the above step and HR dictionary are used to obtain the corresponding HR patch.
x=Dh* α ……… (8)
3.1.1 BLOCK DIAGRAM
Fig: Block Diagram for image super resolution using sparse representation
3.2. EFFICIENT IMPROVED ALGORITHM
As super resolution can also be performed by interpolation techniques, here we are mainly focusing on bicubic interpolation as this method produces superior results than all interpolation techniques.
3.2.1Bicubic interpolation
In bicubic interpolation the value of unknown pixel P is calculated by these 16 pixels in its neighborhood according to their distance to P. Though bicubic interpolation is fast and easy to implement but usually yield overly smooth images, edge blurring and jagged artifacts. On the other hand super resolution using sparse representation yields better results in terms of finer details, sharper edges and visual effectiveness, but the only limitation of this method is the speed of recovering high-resolution images from low resolution one.
4.
EXPERIMENTAL RESULTS AND DISCUSSION
a. Experimental Settings :(a)Number of training set images
(i) 35, (ii)50 and (iii)70
High resolution images were taken (downloaded from google) and corresponding low resolution images were obtained from high resolution images by down sampling and blurring.
(b)Dictionary size
(i)512 (ii) 1024 and (iii)2048 (c)Patch size
(i)3x3 (ii)5x5 and (iii)9x9.
(d)Magnification factor is 2
(e)For color Images we convert the images into 3 y,Cb,Cr frames/ channels.Each channel is separated. Only the illuminance channel is applied as input to the algorithm, as we humans are more sensitive to these effects. Hence the Cb and Crframes as modified using bicubic interpolation. Finally these frames are recombined to generate the final output colored high resolution image.
(f)Evaluation parameter
(i)PSNR (ii)RMSE
(iii)Edges sharpness (iv)Visual appearance (v)Computation time
4.3. Experimental Result
Figure 4.20: (a) shows input low resolution image, Figure (b) shows output resolution image obtained using bicubicinterpolation , Figure (c) shows output resolution image obtained using our algorithm.
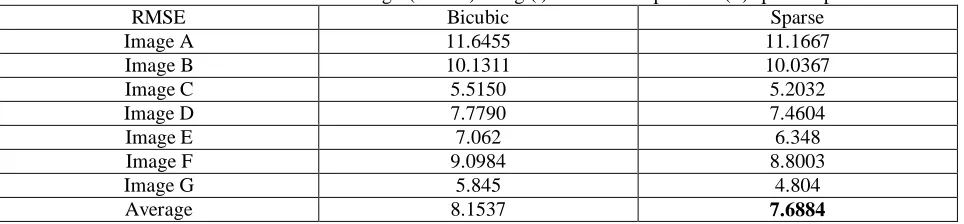
From the results we can conclude that the Spare Representation algorithm creates high resolution images by sharpening the edges and textures. Our algorithm provides better PSNR than Bicubic interpolation method.
Table 4.2:RMSE values for different images(A to G) using (i) bicubic interpolation (ii) sparse representation
RMSE Bicubic Sparse
Image A 11.6455 11.1667
Image B 10.1311 10.0367
Image C 5.5150 5.2032
Image D 7.7790 7.4604
Image E 7.062 6.348
Image F 9.0984 8.8003
Image G 5.845 4.804
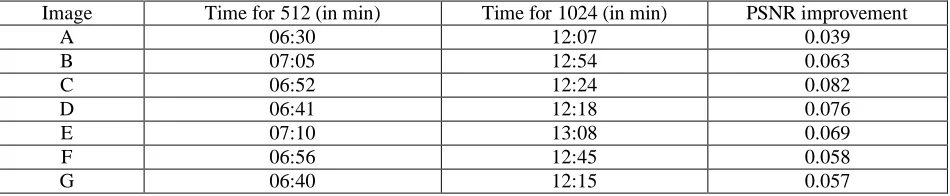
4.3.1 Effects of Dictionary Size
Larger dictionaries possess more representation power as it contain more number of patches, and thus will produce more accurate approximation or results, but it also increases the computation cost. We train dictionaries of different size such as size 512, 1024, and 2048, and used these dictionaries on same input image. The results are evaluated both visually and quantitatively in terms of PSNR as well as computation time. Results showed that as the dictionary size is doubles it took almost double time for computation and the PSNR value was also increased but the improvement in PSNR value was not significantly high.
Table 4.3 : Comparison of computation time and PSNR for dictionary of size (i)512 and (ii)1024
Image Time for 512 (in min) Time for 1024 (in min) PSNR improvement
A 06:30 12:07 0.039
B 07:05 12:54 0.063
C 06:52 12:24 0.082
D 06:41 12:18 0.076
E 07:10 13:08 0.069
F 06:56 12:45 0.058
G 06:40 12:15 0.057
5.
CONCLUSIONS
In sparse image patches can be well represented as a combination of few atoms of an appropriately
chosen over-complete dictionary. The sparse representation for each patch of the LR input is used
similar to that of HR patch so LR patch and Dl (Low resolution dictionary) is used to get the sparse
coefficients then these extracted coefficients and Dh (High resolution dictionary) is used to
generate the HR patches. These HR patches are combined to form HR image. Though bicubic
interpolation is fast and easy to implement but usually yield overly smooth images, edge blurring
and jagged artifacts. On the other hand super resolution using sparse representation yields better
results in terms of finer details, sharper edges and visual effectiveness, but the only limitation of
this method is the speed of recovering high-resolution images from low resolution one.
So, we proposed a method, a combination of Bicubic interpolation and Sparse representation for
super resolution in which bicubic interpolation is used of area with no edges, hence no jagged
artifacts or edge blurring is observed and output is generated in lesser time. On the other hand
sparse representation are used for area containing edges, hence sharper edges are obtained. Thus
proposed approach utilized the best features of both techniques ie..fast computation (Bicubic
interpolation) and visually better results with sharp textures (Sparse representation).
From the experiment results we can conclude that proposed algorithm represents a good
compromise between the performance and the computational complexity. For above butterfly
image the computation time for our algorithm was half as compared to that of sparse representation
method, producing similar results in terms of visual effects and statistics.
In future we can try to improve the resolution of videos.
References
[1] Zhihui, Zheng, Wang Bo, and Sun Kang, “Single remote sensing and denoising via sparse
representation.”Multi-Platform/Multi-Sensor Remote Sensing and Mapping (M2RSM),2011 International Workshop on. IEEE,2011
[2] Daniele Cerra, Rupert Muller, and Peter Reinart,” Noise Reduction in hyperspectral Images Through
Spectral Unmixing” IEEE geoscience and remote sensing letters, vol. 11, no. 1, january 2014.
[3] R.Sivakumar, G.Balaji, R.S.J.Ravikiran, R.Karikalan, S.SaraswathiJanaki ,”Image Denoising using
[4] Peng Liu, Fang Huang, Guoqing Li, and Zhiwen Liu “Remote-Sensing Image Denoising Using Partial Differential Equations and Auxiliary Images as Priors” IEEE geoscience and remote sensing letters, vol. . 9, no. 3,may 2012
[5] Alp Ertürk,” Enhanced Unmixing-Based Hyperspectral Image Denoising Using Spatial Preprocessing,” ieee
journal of selected topics in applied earth observations and remote sensing
[6] Santhosh.S, Abinaya.N, Rashmi.G “A novel Approach for DenoisingColoured Remote Sensing Image using
Legendre Fenchel Transformation” 2014 International Conference on Recent Trends in Information Technology
[7] Jiayin Kang, Wenjuan Zhang,”Quickbird Remote Sensing Image Denoising using Wavelet Packet
Transform,” Second International Symposium on Intelligent Information Technology Application
[8] Yizhou Ye, YunzeCai “A Spatially Adaptive Denoising with Activity Level Estimation Based Method for
Infrared Small Target Detection” proceeding of the 11th World Congress on Intelligent Control and Automation Shenyang, China, June 29 - July 4 2014
[9] JigarDalvadi,” A Survey on Techniques of Image Super Resolution”, International Journal of Innovative
Research in Computer and Communication Engineering, Vol. 4, Issue 3, March 2016
[10]Dianyuan Han,” Comparison of Commonly Used Image Interpolation Methods”, Proceedings of the 2nd