Conceptual Analysis Of The Computer Graphic And Their Applicatons
1
Aye Mya Sandar, 2Khin Myat Nwe Win,3Ya Min
1
Information Technology Supporting and Maintenance Department, University of Computer Studies (Mandalay)
2
Faculty of Computer Science Department, University of Computer Studies (Mandalay), Mandalay, Myanmar
3
Faculty of Computer Science Department, University of Computer Studies (Lashio), Shan State, Myanmar
[email protected],[email protected],[email protected]
ABSTRACT
The Computer Graphic (CG) is one of the most active and ordinarily used way to communicate the processed information to the user and CG is also define as an art of drawing pictures on computer screen with the help of programming. Conceptual analysis is done in order to find out the effect of computer graphics and various types of its applications. CG has developed as a sub-field of computer science which studies methods for digitally synthesizing and manipulating visual content. This paper presents a brief overview on conceptual analysis of the computer graphics and types of CG over the decades and their applications on the product development.
Key words: Computer graphics, computer graphic applications.
I. INTRODUCTION
Computer graphics is the representation and manipulation of image data by a computer using various technologies to create and manipulate images (Shirley et al, 2005). The development of computer graphics has made computer easier to interact with, and better for understanding and interpreting many types of data. Computer graphics is used mostly in the creation of an image that looks like a photograph from a real life, but portrays something that could not actually be taken as a picture. Also it may be desired to create an animation for a movie that portrays an alien creature or creating an architectural rendering to get an idea of what the final building will look like; it is called photo-realistic. [9]
Computer Graphics (CG) is responsible for displaying art and image data effectively and
meaningfully to the consumer. It is also used for processing image data received from the physical world. CG development has had a significant impact on many types of media and
has revolutionized animation, movies,
advertising, video games, and graphic design in general. CG is made up of number of pixels. Pixel is the smallest graphical picture or unit represented on the computer screen. [1]
Typically, the term CG refers to several different things. Firstly, the representation and manipulation of image data by a computer and secondly, the various technologies used to create and manipulate images and finally the sub-field of computer science which studies methods for digitally synthesizing and manipulating visual content, see study of computer graphics. [3]
According to [4], CG is an art of drawing pictures, lines, charts, etc. using computers with the help of programming. Computer graphics is made up of number of pixels. Basically there are two types of computer graphics namely bitmap images (composed of pixels) and vector images (composed of paths). [5]
A bitmap image, called Raster images, uses a
grid of individual pixels where each pixel can be a different color or shade. Bitmaps are composed of pixels and represent an image by treating the image area as a rectangle, and dividing up the rectangle into a two-dimensional array of tiny pixels. Bitmap images usually involve large numbers of pixels, but computers are really good at handling large numbers of items. Each pixel specifies a single color value for the image at that point. The resulting image is displayed simply by copying the array of pixels to the screen, with each pixel showing its defined color. Some of the smallest bitmap images are the icons used for programs and other items in computer user interfaces. [5]
Bitmap images have a resolution, which limits the size to which you can magnify the image without visible degradation. Images with higher numbers of pixels have higher resolution. Given that bitmap image files are usually large, it’s helpful to be able to be able to compress the pixel map in some way, and there are many well-known methods for doing this. The tradeoff is that, the more compression you apply, the worse the image tends to look. One of the best-known is JPEG which is intended to allow you to apply variable amounts of compression to digital photographs. However, it’s important to realize that bitmap image files are not necessarily compressed. Programs that are designed to process bitmap images are referred
to as “paint” programs. Well-known examples
are: Adobe Photoshop and Corel Photo Paint. [5]
Advantages of bitmap image are,
Complex scenes can be depicted as easily as simple scenes.
Significant compression is usually possible, at
the expense of loss of quality.
Rendering is computationally easy; requires
minimal computing power.
Disadvantages are,
Size: Files tend to be large.
Not scalable: attempting to magnify an image
causes degradation. [5]
A vector image uses mathematical relationships
between points and the paths connecting them to describe an image. Vector graphics are composed of paths. The image to the left below is representative of a bitmap and the image to the right is representative of a vector graphic. They are shown at four times actual size to exaggerate the fact that the edges of a bitmap become jagged as it is scaled up. A vector image contains the drawing instructions other than the color value in pixels. [5]
For example, Windows platform WMF
is most widely used vector graphic format that is supported by all printers. The best feature about WMF is that the dimension measures are completely device independent. It can be easily scaled without losing any characteristics. We strongly recommend that you save your barcode image in this format. In our Barcode Studio/ActiveX products copy/paste operation is based on WMF format which preserves all the information. Other vector graphics formats include EPS (Encapsulated PostScript), SVG (Scalable Vector Graphics) format. [5]
Advantages of vector image are,
Scalable: images can be displayed at any resolution without degradation.
Disadvantages are,
Complex scenes are difficult to encode, which tends to create very large files.
Rendering is computationally intensive; requires significant computing power. [5]
III. APPLICATION OF COMPUTER
GRPHICS
Computer graphics are very
useful. Today almost every computer can do some graphics, and people have even come to expect to control their computer through icons and pictures rather than just by typing. There are four classify applications of computer graphics, these are Display of information, Design, Simulation and User interfaces area. [6][7]
1. Display of information
Graphics has always been associated with the display of information shown in Figure 1. In fields such as architecture and mechanical design, hand drafting is being replaced by computer-based drafting systems using plotters and workstations. Medical imaging uses computer graphics in a number of exciting ways. Recently there has been great interest in problems of scientific visualization. Although researchers are now using supercomputers to solve formerly intractable problems in fields such as fluid flow and molecular biology, they need new display techniques to interpret the results of analyzing the vast quantities of multidimensional data generated. [8]
Figure (1). Display of information of
Computer Graphics
Computational Biology: Computational
biology is an interdisciplinary field that applies the techniques of computer science, applied mathematics and statistics to address biological problems. The main focus lies on developing mathematical modeling and computational simulation techniques. [6][7]
Computational Physics: Computational
physics is the study and implementation of numerical algorithm to solve problems in physics for which a quantitative theory already exists. It is often regarded as a sub discipline of theoretical physics but some consider it an intermediate branch between theoretical and experimental physics. [6][7]
Information of Graphics: Information
graphics or information graphics are visual
representations of information, data or
knowledge. These graphics are used where complex information needs to be explained quickly and clearly, such as in signs, maps, journalism, technical writing, and education. They are also used extensively as tools by
computer scientists, mathematicians, and
statisticians to ease the process of developing and communicating conceptual information. [6][7]
Scientific Visualization: Scientific visualization
focuses on the use of computer graphics to create visual images which aid in understanding
of complex, often massive numerical
representation of scientific concepts or results. [6][7]
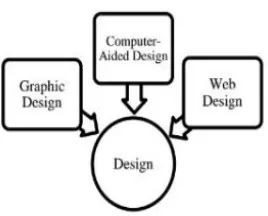
2. Design
Professions such as engineering and architecture are concerned with design shown in Figure 2. Although their applications vary, most designers face similar difficulties and use similar
methodologies. One of the principal
characteristics of most design problems is the lack of a unique solution. Computer graphics has become an indispensable element in this iterative process. The designer never had to write a graphics program or even to know much about computer graphics yet, without computer graphics, this design process would not be possible. [8]
Figure (2). Design of Computer Graphics
Graphic Design: The term graphic design can
refer to a number of artistic and professional
disciplines which focus on visual
communication and presentation. Various
methods are used to create and combine symbols, images and/or words to create a visual representation of ideas and messages. Graphic design often refers to both the process (designing) by which the communication is created and the products (designs) which are generated. [6][7]
Computer-aided Design: Computer-aided
design (CAD) is the use of computer technology for the design of objects, real or virtual. The design of geometric models for object shapes, in particular, is often called computer-aided geometric design (CAGD). CAD may be used to design curves and figures in two-dimensional (2D) space; or curves, surfaces, or solids in three-dimensional (3D) objects. CAD is also widely used to produce computer animation for special effects in movies, advertising, technical manuals. [6][7]
Web Design: Web design is the skill of
designing presentations of content usually hypertext or hypermedia that is delivered to an end-user through the World Wide Web, by way of a Web browser. The process of designing Web pages, Web sites, Web applications or multimedia for the Web may utilize multiple disciplines, such as animation, authoring,
communication design, corporate identity,
graphic design, human-computer interaction, information architecture, interaction design,
marketing, photography, search engine
optimization and typography. [6][7]
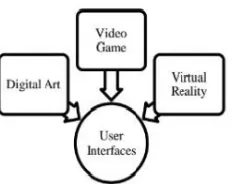
3. User Interfaces
Figure (3). User Interfaces of information of Computer Graphics
Digital Art: Digital art most commonly refers to
art created on a computer in digital form. On other hand, is a term applied to contemporary art that uses the methods of mass production or digital media. The impact of digital technology has transformed traditional activities such as painting, drawing and sculpture, while new forms, such as net art, digital installation art, and virtual reality, have been recognized artistic practices. [6][7]
Video Games: A video game is an electronic
game that involves interaction with a user interface to generate visual feedback on a raster display device. The electronic systems used to play video games are known as platforms. This platform creates through graphics. [6][7]
Virtual Reality: Virtual reality (VR) is a
technology which allows a user to interact with a computer-simulated environment. The simulated environment can be similar to the real world, for example, simulations for pilot or combat training, or it can differ significantly from reality, as in VR games. It is currently very difficult to create a high-fidelity virtual reality experience, due largely to technical limitations on processing power, image resolution and communication bandwidth. Virtual Reality is often used to describe a wide variety of applications, commonly associated with its immersive, highly visual, 3D environments. [6][7]
4. Simulation
According to Figure 4, some of the most impressive and familiar uses of computer graphics can be classified as simulations. Video games demonstrate both the visual appeal of computer graphics and our ability to generate complex imagery in real time. The insides of an arcade game reveal state-of-the-art hardware and software. Computer-generated images are also the heart of flight simulators, which have become the standard method for training pilots. The savings in dollars and lives realized from use of these simulators has been enormous. The computer-generated images we see on television and in movies have advanced to the point that they are almost indistinguishable from real-world images. [8]
Figure (4). Simulation of Computer Graphics
Computer Simulation: A computer simulation,
a computer model or a computational model is a computer program, or network of computers, that attempts to simulate an abstract model of a particular system. [6][7]
Education: A computer simulation, a computer
Information Visualization: Information visualization is the study of the visual representation of large-scale collections of non-numerical information, such as files and lines of code in software systems, and the use of graphical techniques to help people understand and analyze data. [6][7]
IV.CONCLUTION
Today, computer graphics is widespread. A well-constructed graph can present complex statistics in a form that is easier to understand and interpret. Computer graphics is the representation and manipulation of image data by a computer using various technology to create and manipulate images (Shirley et.al., 2005). The development of computer graphics has made computer easier to interact with, and better for understanding and interpreting
different types of data. Nowadays, computer
graphics developed over many years and played an important role develops in computer graphics and what future technologies will offer.
V. REFERENCES
[1].https://en.wikipedia.org/wiki/Computer_grap hics
[2]. University of Leeds ISS (2002). "What are computer graphics?" Archived 2015-01-06 at the Wayback Machine. Last updated: 22 September 2008.
[3]. Michael Friendly (2008). "Milestones in the history of thematic cartography, statistical graphics, and data visualization”.
[4].
https://www.quora.com/What-is-computer-graphics-2
[5].
http://www.teklibri.com/the-two-types-of- computer-graphics-bitmaps-and-vector-drawings/
[6]. https://www.linkedin.com/pulse/application-computer-graphics-niropam-das
[7]. Niropam Das( 2015), Application of
Computer Graphics.
[8].
http://202.114.32.200:8080/courseware/208405/
20840511/context/Text/EC17_2.htm
[9]. ] Shirley P, Ashikhmin M.,Gleicher M.,