Study on a New Remote Sensing Image Classification Method and
Its Application
Wu Deng1, 2, 3, 4, Danqin Wang1, and Huimin Zhao1, 2, 3, 4, *
Abstract—For slower computation speed and lower classification accuracy of the traditional image classification methods, wavelet transform, multi-strategy, particle swarm optimization (PSO) algorithm and support vector machine (SVM) are introduced into image classification in order to propose a new remote sensing image classification (RIWMPS) method. First of all, wavelet transform method with multi-resolution characteristics is used to extract the features of remote sensing image. Then the steepest descent strategy, corrective decline strategy, random movement, aggregation strategy and diffusion strategy are used to improve the PSO algorithm to obtain an improved PSO (MSPSO) algorithm, which is used to optimize the parameters of the SVM model in order to construct an optimized SVM classifier for realizing remote sensing classification. Finally, the remote sensing image of Chongming Island is select to test the effectiveness of the RIWMPS method. The experiment results show that the RIWMPS method has higher classification efficiency and accuracy, and takes on better superiority and effectiveness. This study provides a new classification method for processing the remote sensing image.
1. INTRODUCTION
Image classification is a key technology to realize automatic image processing. The goal is to give one label for each pixel according to the pixel own property of remote sensing image and its correlation with the neighborhood pixel. In recent years, many scholars have studied and proposed many remote sensing image classification methods. The different processing methods can be divided into supervised classification method and unsupervised classification method. Unsupervised classification method relies on the system cluster, and a group of pixels are classified according to the similarity. The main algorithm includes ISODATA [1], principal component analysis [2], independent component analysis [3], K-means [4], genetic algorithm [5], differential evolution algorithm [6], etc. Due to the spatial resolution of the image and the phenomenon of the same object, this method often appears more wrong and missing classification phenomenon.
Supervised classification method is a common statistical decision classification with high accuracy. It mainly includes the minimum distance, neural network method, Bayes network, etc. [7–15]. SVM is a structural risk minimization principle method. It can improve the generalization ability by minimizing empirical risk and confidence interval [16–19]. However, it is difficult to determine the parameters of SVM. So researchers proposed some improved SVM classification methods. Adankon and Cheriet [20] proposed an additional criterion with the standard formulation of semi-supervised SVM (S3VM). Mylonas et al. [21] proposed an object-based classification scheme for remote sensing images. Patra and Bruzzone [22] proposed a novel iterative learning technique based on SOM neural network and
Received 27 March 2018, Accepted 29 May 2018, Scheduled 14 June 2018
* Corresponding author: Huimin Zhao (hm [email protected]).
1 Software Institute, Dalian Jiaotong University, Dalian 116028, China. 2 Guangxi Key Lab of Multi-source Information Mining
SVM. Du et al. [23] proposed wavelet SVM classifier. Bruzzone et al. [24] proposed a novel modified TSVM classifier based on the transductive SVMs. Marconcini et al. [25] proposed a novel composite semisupervised SVM for image classification. Zhai et al. [26] proposed a new decision tree ensembles based on C4.5, Ada Boost and Boost Tree. Jing et al. [27] proposed a remote sensing image classification based on optimized SVM. Mallinis et al. [28] proposed a novel fuzzy decision tree. Xu et al. [29] proposed a method of reducing dimensions based on genetic algorithm and object-oriented classification based on SVM.
These image classification methods based on SVM and improved SVM model can better obtain classification effect, but they have low classification efficiency and prolonged classification time with increasing samples. With the progress of sensor technology, the amount of remote sensing data is significantly increased. The information is highly detailed, and the dimensions of data change greatly. SVM is difficult to meet the actual requirements of image classification. Wavelet transform is one of the tools which is used widely in current applied mathematics and engineering application. Therefore, wavelet transform is used to extract the texture features of image. Then the steepest descent strategy, corrective decline strategy, random movement, aggregation and diffusion strategies are used to improve PSO algorithm, which is used to optimize the parameters of SVM in order to propose a new remote sensing image classification method for improving the speed and accuracy of remote sensing image classification.
2. BASIC METHODS 2.1. Wavelet Transform
The concept of wavelet is proposed by a French engineer J. Morlet in 1974 [30]. By comparing the Fourier transform, wavelet transform, partial transformation of space (time) and frequency, the dilation and translation operation functions are used to analyze the functions or signals to solve these difficult problems that cannot be solved by Fourier. In order to apply the wavelet transform to process the image, a two-dimensional wavelet function and scaling function are required. A separable variable method with the two-dimensional wavelet function based on one-dimensional wavelet function and scaling function is used. On each wavelet, H is the horizontal direction, V the vertical direction, and D the diagonal direction. The scale function and wavelet function define a dilation and translation basis functions:
φj,m,n(x, y) = 2j/2φ
2jx−m,2jx−n=φj,m(x)φj,n(y) (1)
ϕHj,m,n(x, y) = 2j/2ϕH2jx−m,2jx−n=ϕj,m(x)φj,n(y) (2)
ϕVj,m,n(x, y) = 2j/2ϕV 2jx−m,2jx−n=φj,m(x)ϕj,n(y) (3)
ϕDj,m,n(x, y) = 2j/2ϕD2jx−m,2jx−n =ϕj,m(x)ϕj,n(y) (4)
The wavelet transform can concentrate the energy of the original image on the small part of wavelet coefficients. Therefore, the decomposed wavelet coefficients have a high degree of local relevance in the horizontal, vertical and diagonal directions, which provide favorable conditions for feature extraction.
2.2. Particle Swarm Optimization Algorithm
The PSO algorithm [31] is a population-based search algorithm. In PSO algorithm, the positions of particles in search space are changed according to the tendency of individuals. Assuming that in a d-dimensional search space, a population has m particles, among which the ith particle is expressed as a d-dimensional vector xi = (xi1, xi2, . . . , xid), i = 1,2, . . . , m. It means that the position in d-dimensional search space in the population is xi. Its speed is also a d-dimensional vector, denoted as vi = (vi1, vi2, . . . , vid); the optimal location is pi = (pi1, pi2, . . . , pid); the optimal location of the whole population is pg = (pg1, pg2, . . . , pgd). The velocity updating and position updating of the particle are shown:
vid = wvid+c1r1(pid−xid) +c2r2(pgd−xid) (5)
Among them, w is the inertia weight coefficient; c1 and c2 are two nonnegative constants, known as acceleration constant; r1 andr2 are two random numbers between [0, 1].
2.3. Support Vector Machine
SVM is a supervised machine learning method based on structural risk minimization [32, 33]. It is to find one division plane with meeting the given requirement to keep the point of training set far away from the plane. It is used to solve the linear constraint quadratic programming problem by mapping the input space into a high dimensional inner product space. The kernel function in SVM is used to map the input space into a high-dimensional feature space. There are the linear kernel function, radial basis kernel function (RBF), Fourier kernel function, etc. For different systems in the process of classification, there is the optimal kernel function with the best effect. The radial basis function has wide application because of its simple expression form, good smoothness and analyticity. Therefore, the RBF is selected as the kernel function of SVM. The kernel function is described as follows.
K(x, xi) = exp
− x−xi2/σ2
(7)
where x is a m-dimensional input vector, and xi is the center of the ith radial basis function and has the same dimension with x.
3. A NEW CLASSIFICATION METHOD
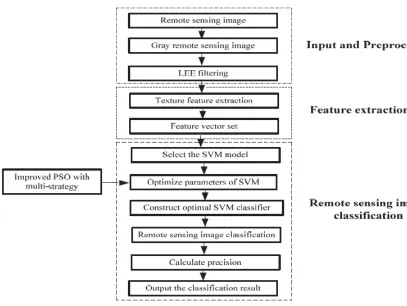
In order to solve the existing problems in remote sensing image classification, a new classification method of remote sensing image (RIWMPS) based on wavelet transform, improved PSO and SVM is proposed in this paper. A flowchart is shown in Fig. 1.
3.1. Input and Preprocess the Remote Sensing Image
The remote sensing image of Chongming Island on August 2, 2003 is selected here. The radiation and geometry of remote sensing image are corrected. It is converted into a grayscale image. The number of determined samples is 3. The LEE filtering is selected to preprocess the grayscale image to obtain a preprocessed remote sensing image.
3.2. Texture Feature Extraction Method of Remote Sensing Image
The image contents include the visual features and semantic features of the color, texture, and shape. Among them, the texture feature is regarded as the most significant visual feature, which does not depend on the color or brightness to reflect the visual features of the homogeneous phenomena. The texture feature contains important information of the surface structure and the relation of the surrounding environment. The wavelet transform can concentrate the energy of the original image on a small part of the wavelet coefficients, so the wavelet transform is used to realize the feature extraction of remote sensing image.
3.3. Select the Key Parameters
In the theory of the SVM, the function of the penalty coefficientCis used to adjust the proportion of the confidence range and experience risk in the determined subspace to make the best classification ability of learning machine. For determined classification data, when the value ofCis small, the penalty of the experience error is small. Otherwise, the complexity of the machine learning is low, and the experience risk of the machine learning is high, and vice versa. The function of the kernel parameterσ2 is used to determine the corresponding relation between the mapping function and feature space. An appropriate σ2 will be able to map the data into an appropriate feature space. However, the values of σ2 and C are very difficult to be predetermined. It is critical how to effectively optimize the parameter values of SVM for the experience risk and classification ability of the SVM.
3.4. An Improved PSO Algorithm
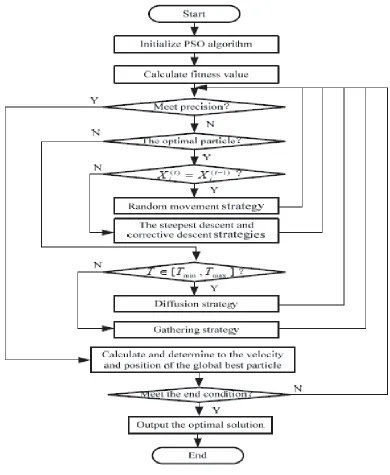
The update formula of velocity in the PSO is the same for all particles [34–36]. The single search strategy will result in weak local search ability. Even when the particles are very close to the best position, they cannot quickly find the location. These will result in low convergence accuracy. In order to overcome these shortcomings, the steepest descent strategy, corrective descent strategy, random movement strategy, gathering and diffusion strategies are used to improve the PSO algorithm. A multi-strategy PSO (MSPSO) algorithm is proposed to improve the search multi-strategy with the iteration of the particles. The idea of the MSPSO algorithm is described as follows. When the searched optimization location changes, the optimal particle uses the steepest descent and the corrective descent strategies to search for the local extremum, and the non-optimal particles use the gathering strategy to be close to the optimal particle. When the searched optimization location does not change, the optimal particle uses the random movement strategy to jump out the local extremum, and the non-optimal particles select the gathering strategy or diffusion strategy according to the searched optimal location. A flowchart of the MSPSO algorithm is shown in Fig. 2.
4. EXPERIMENT RESULT 4.1. Optimize Parameters of SVM
In the experiment, the data image set is selected from the publicly available data of Digital Globe. The data set contains 5 classes and 51 images, including training samples (28 images) and test samples (23 images). The correct rate of image classification is selected as the fitness functions of MSPSO and GA. The optimization process of MSPSO and GA on Matlab 7.0 is shown in Fig. 3.
Figure 2. The flow of the MSPSO algorithm.
algorithm can obtain more optimal fitness value (the correct rate of image classification) than the GA in the experiment, and it has less evolution iteration. These results illustrate that the MSPSO algorithm can better optimize the parameters of SVM.
4.2. Test Classification Method and Analyze the Result
4.2.1. Experimental Data and Environment
Figure 3. Optimize parameters of SVM based on MSPSO and GA.
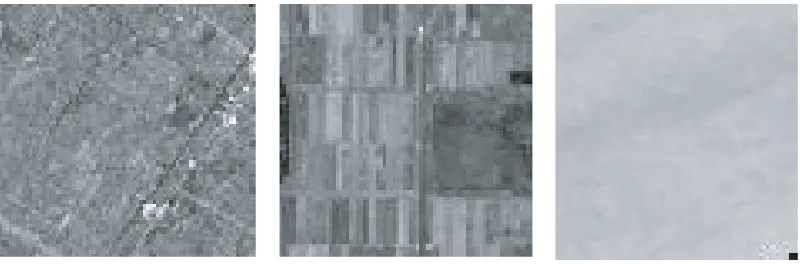
Figure 4. Remote sensing image of Chongming island.
Figure 5. Three kinds of samples.
4.2.2. Obtain and Analyze the Classification Result
In order to verify the effectiveness of the RIWMPS method, the classification method (GA-SVM) based on genetic algorithm (GA) and SVM and the classification method (GS-SVM) based on grid search (GS) and SVM are selected to realize the comparison experiment. The initial settings of GS-SVM, GA-SVM and RIWMPS are shown in Table 1.
Table 1. Initial value of the parameters of the algorithms.
``````
``````
Parameter
Method
GS-SVM GA-SVM RIWMPS
Population size (M) N/A 20 20
Iteration times (Tmax) N/A 200 200
Parameter of SVM Cross Validation (v) 6 6 6
Scope of Parameter c [0.1,100] [0.1,100] [0.1,100] Scope of Parameter g [0.001,1000] [0.001,1000] [0.001,1000]
Accelerated constant N/A N/A c1 =c2 = 2
Inertia weight (w) N/A N/A 0.80
Modulus of elasticity N/A N/A r1 =r2= 1
Step length cstep=gstep= 1 N/A N/A
The average classification accuracy of texture is used to regard as the comparison result. The simulation result and comparison result are shown in Table 2 and Fig. 6–Fig. 9.
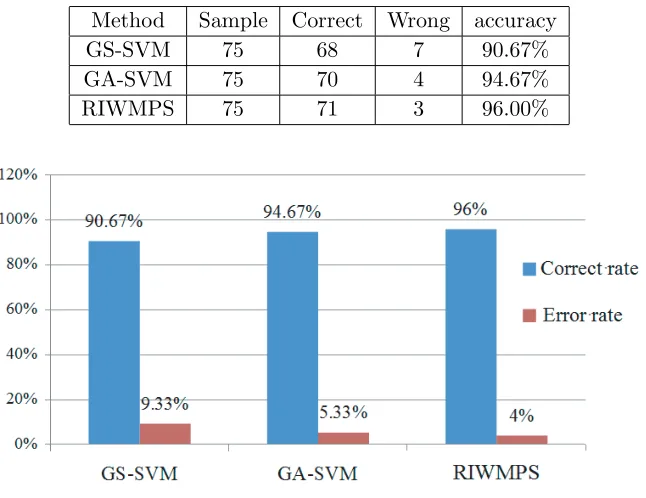
Table 2. Classification accuracy of the optimized SVM classifier.
Method Sample Correct Wrong accuracy
GS-SVM 75 68 7 90.67%
GA-SVM 75 70 4 94.67%
RIWMPS 75 71 3 96.00%
Figure 6. The comparison of classification result.
Figure 7. The comparison result by using GA-SVM classifier.
Figure 8. The comparison result by using GS-SVM classifier.
and actual classification with 75 testing samples using GS-SVM classifier. Fig. 9 shows the comparison result with forecast classification and actual classification with 75 testing samples using RIWMPS classifier. As can be seen from Fig. 6–Fig. 9 and Table 2, the GS-SVM classifier has 7 wrong classification samples, and the classification accuracy is 90.67%. The GA-SVM classifier has 4 wrong classification samples, and the classification accuracy is 94.67%. The proposed RIWMPS classifier has 3 wrong classification samples, and the classification accuracy is 96%. Therefore, it can be seen that under the same experiment conditions, the RIWMPS classifier has the highest classification accuracy, and the classification accuracy of RIWMPS classifier is improved about 5.3% compared to the classification accuracy of GS-SVM classifier. It is proved that the MSPSO algorithm can obtain the best values of parameters of SVM model.
In order to comprehensively analyze the effectiveness of the RIWMPS classifier, the classification accuracy of the improved SVM classifier is analyzed from the house, land and sea. The experimental result is shown in Table 3.
Figure 9. The comparison result by using RIWMPS classifier.
Table 3. The classification accuracy of the improve SVM classifier.
Type Sample GS-SVM GA-SVM RIWMPS Average accuracy
House 25 84% 84% 88% 86%
Land 25 88% 100% 100% 96%
Sea 25 100% 100% 100% 100%
house samples into land samples; the RIWMPS classifier has wrongly classified 3 house samples into land samples. For sea samples, three improved SVM classifiers have correctly classified all samples. So it can be proved that the RIWMPS classifier can effectively improve the classification accuracy.
As can be known from comprehensive analyzing experimental result, the overall average classification accuracy of the RIWMPS classifier is 96%, which can obtain the best classification effect and classification accuracy. As can be found from the analysis, the classification accuracy of water and land is better. The main reason for easy distinguishing of the water and land is that they have obvious pixel features and relatively concentrated distributions. The classification accuracy of house is a bit lower than the classification accuracies of water and land. As can be known from the field inspection, the misclassification pixels are mainly focused on the house object, because the house is discrete distribution and not a single structure. And the bare land is mixed in house object, and the house and bare land are closely distributed together. For the pixels at the border of two types of surface features, these pixels often contain many kinds of target feature information because of the influence of the scattering of objects. The existing mixed pixels influenced the classification accuracy and caused the mistake classification.
5. CONCLUSION
improved the classification accuracy of remote sensing image to a certain extent and proves that this method is an effective remote sensing image classification method with high classification accuracy. In the next work, we will concentrate on how to select the optimal texture feature vector and further improve the classification precision of remote sensing image.
ACKNOWLEDGMENT
The authors would like to thank all the reviewers for their constructive comments. This work was supported by the National Natural Science Foundation of China (61771087, 51605068, 51475065), the Innovative Talents Promotion Plan of Liaoning colleges and Universities (LR2017058), the Research Fund of Guangxi Key Lab of Multi-source Information Mining & Security (MIMS17-03), the Open Project Program of Key Laboratory of Guangxi High Schools Complex System and Computational Intelligence, (2017CSCI03) and Liaoning BaiQianWan Talents Program.
Conflict of Interest: The authors declare that they have no conflict of interest. This article does not contain any studies with human participants or animals performed by any of the authors. Informed consent was obtained from all individual participants included in the study.
REFERENCES
1. Calvo, S., G. Ciraolo, and G. La Loggia, “Monitoring Posidonia oceanica meadows in a Mediterranean coastal lagoon (Stagnone, Italy) by means of nueral network and ISODATA classification methods,” International Journal of Remote Sensing, Vol. 24, No. 13, 2703–2716, 2003.
2. Xia, J. S., J. Chanussot, P. J. Du, and X. Y. He, “(Semi-) Supervised probabilistic principal component analysis for hyperspectral remote sensing image classification,”IEEE Journal of Selected Topics in Applied Earth Observations and Remote Sensing, Vol. 7, No. 6, 2225–2237, 2014.
3. Dalla, M. M., A. Villa, J. A. Benediktsson, J. Chanussot, and L. Bruzzone, “Classification of hyperspectral images by using extended morphological attribute profiles and independent component analysis,” IEEE Geoscience and Remote Sensing Letters, Vol. 8, No. 3, 542–546, 2011. 4. Chen, C. W., J. Luo, and K. J. Parker, “Image segmentation via adaptive K-mean clustering and knowledge-based morphological operations with biomedical applications,” IEEE Transactions on Image Processing, Vol. 7, No. 12, 1673–1683, 1998.
5. Celik, T., “Change detection in satellite images using a genetic algorithm approach,” IEEE Geoscience and Remote Sensing Letters, Vol. 7, No. 2, 386–390, 2010.
6. Pandit, M., L. Srivastava, and M. Sharma, “Environmental economic dispatch in multi-area power system employing improved differential evolution with fuzzy selection,” Applied Soft Computing Journal, Vol. 28, 498–510, 2015.
7. Murthy, C. S., P. V. Raju, and K. V. S. Badrinath, “Classification of wheat crop with multi-temporal images: Performance of maximum likelihood and artificial neural networks,”International Journal of Remote Sensing, Vol. 24, No. 23, 4871–4890, 2003.
8. Zhang, Y. D., Z. Dong, X. Chen, W. Jia, S. Du, K. Muhamma, and S. H. Wang, “Image based fruit category classification by 13-layer deep convolutional neural network and data augmentation,”
Multimedia Tools and Applications, Vol. 3, 1–20, 2017.
9. Liao, S. H., J. G. Hsieh, J. Y. Chang, and C. T. Lin, “Training neural networks via simplified hybrid algorithm mixing NelderMead and particle swarm optimization methods,”Soft Computing, Vol. 19, No. 3, 679–689, 2014.
10. Zhang, Y. D., L. Wu, and G. Wei, “A new classifier for polarimetric SAR images,” Progress In Electromagnetics Research, Vol. 94, 83–104, 2009.
12. Solares, C. and A. M. Sanz, “Bayesian network classifiers. An application to remote sensing image classification,”WSEAS Transactions on Systems, Vol. 4, No. 4, 343–348, 2005.
13. Deng, W., H. M. Zhao, L. Zou, G. Y. Li, X. H. Yang, and D. Q. Wu, “A novel collaborative optimization algorithm in solving complex optimization problems,”Soft Computing, Vol. 21, No. 15, 4387–4398, 2017.
14. Lu, H., Y. Li, Y. Zhang, M. Chen, S. Serikawa, and H. Kim, “Underwater optical image processing: A comprehensive review,” Mobile Networks and Applications, Vol. 22, No. 6, 1204–1211, 2017. 15. Deng, W., H. M. Zhao, X. H. Yang, J. X. Xiong, M. Sun, and B. Li, “Study on an improved
adaptive PSO algorithm for solving multi-objective gate assignment,” Applied Soft Computing, Vol. 59, 288–302, 2017.
16. Bazi, Y. and F. Melgani, “Toward an optimal SVM classification system for hyperspectral remote sensing images,” IEEE Transactions on Geoscience and Remote Sensing, Vol. 44, No. 11, 3374– 3385, 2006.
17. Segata, N., E. Pasolli, F. Melgani, and E. Blanzieri, “Local SVM approaches for fast and accurate classification of remote-sensing images,”International Journal of Remote Sensing, Vol. 33, No. 19, 6186–6201, 2012.
18. Pasolli, E., F. Melgani, D. Tuia, F. Pacifici, and W. J. Emery, “SVM active learning approach for image classification using spatial information,” IEEE Transactions on Geoscience and Remote Sensing, Vol. 52, No. 4, 2217–2223, 2014.
19. Tuia, D., M. Volpi, M. D. Mura, A. Rakotomamonjy, and R. Flamary, “Automatic feature learning for spatio-spectral image classification with sparse SVM,” IEEE Transactions on Geoscience and Remote Sensing, Vol. 52, No. 10, 6062–6074, 2014.
20. Adankon, M. M. and M. Cheriet, “Genetic algorithm-based training for semi-supervised SVM,”
Neural Computing and Applications, Vol. 19, No. 8, 1197–1206, 2010.
21. Mylonas, S. K., D. G. Stavrakoudis, and J. B. Theocharis, “GeneSIS: AGA-based fuzzy segmentation algorithm for remote sensing images,” Knowledge-Based Systems, Vol. 54, No. 12, 86–102, 2013.
22. Patra, S. and L. Bruzzone, “A novel SOM-SVM-based active learning technique for remote sensing image classification,” IEEE Transactions on Geoscience and Remote Sensing, Vol. 52, No. 11, 6899–6910, 2014.
23. Du, P. J., K. Tan, and X. S. Xing, “Wavelet SVM in Reproducing Kernel Hilbert Space for hyperspectral remote sensing image classification,”Optics Communications, Vol. 283, No. 24, 4978– 4984, 2010.
24. Bruzzone, L., M. M. Chi, and M. Marconcini, “A novel transductive SVM for semisupervised classification of remote-sensing images,” IEEE Transactions on Geoscience and Remote Sensing, Vol. 44, No. 11, 3363–3372, 2006.
25. Marconcini, M., G. Camps-Valls, and L. Bruzzone, “A composite semisupervised SVM for classification of hyperspectral images,”IEEE Geoscience and Remote Sensing Letters, Vol. 6, No. 2, 234–238, 2009.
26. Zhai, L., J. X. Zhang, and X. B. Yang, “Application of AdaTree algorithm to remote sensing image classification,” Geomatics and Information Science of Wuhan University, Vol. 38, No. 12, 1460–1464, 2013.
27. Jing, L. H., M. F. Wang, and Q. Z. Lin, “Hyperspectral remote sensing image classification based on SVM optimized by clonal selection,”Spectroscopy and Spectral Analysis, Vol. 33, No. 3, 746–751, 2013.
28. Mallinis, G. K. N., J. B. Theocharis, and V. Petridis, “SVM-based fuzzy decision trees for classification of high spatial resolution remote sensing images,” IEEE Transactions on Geoscience and Remote Sensing, Vol. 50, No. 1, 149–169, 2012.
30. Angrisani, I., P. Daponte, M. D. A. Puzzo, et al., “A measurement method based on the wavelet transform for power quality analysis,”IEEE Transactions on Power Delivery, Vol. 13, No. 4, 990– 998, 1998.
31. Kennedy, J. and R. Eberhart “Particle swarm optimization,”Proceedings of the IEEE International Conference on Neural Networks, 1942–1948, IEEE Press, Piscataway, 1995.
32. Vapnik, V.,The Nature of Statistical Learning Theory, Springer Verlag, New York, 1995.
33. Liu, X. D., D. G. Jia, and H. Li, “Research on Kenel parameter optimization of support vector machine in speaker recognition,” Science Technology and Engineering, Vol. 10, No. 7, 1669-1673, 2010.
34. Zhang, Y. D., S. H. Wang, and G. L. Ji, “A comprehensive survey on particle swarm optimization algorithm and its applications,” Mathematical Problems in Engineering, Article ID 931256, 2015. 35. Zhang, Y. D., Z. J. Yang, H. M. Lu, X. X. Zhou, P. Phillips, Q. M. Liu, and S. H. Wang, “Facial
emotion recognition based on biorthogonal wavelet entropy, fuzzy support vector machine, and stratified cross validation,” IEEE Access, Vol. 4, 7752782, 2016.