THE BALTIC JOURNAL OF ROAD AND BRIDGE ENGINEERING 20 19/14 (1)
* Corresponding author. E-mail: [email protected]
Copyright © 2019 The Author(s). Published by RTU Press
This is an Open Access article distributed under the terms of the Creative Commons Attribution
ISSN 1822-427X/eISSN 1822-4288 2019 Volume 14 Issue 1: 104–123 https://doi.org/10.7250/bjrbe.2019-14.435
METHODOLOGY FOR DETERMINING
RELIABLE TRAFFIC PARAMETERS
FOR CURRENT ANALYSIS OF PERFORMANCE
OF MOTORWAYS AND EXPRESSWAYS
MALWINA SPŁAWIŃSKA*
Dept of Highway and Traffic Engineering, Faculty of Civil Engineering, Cracow University of Technology, Cracow, Poland
Received 07 June 2018; accepted 06 February 2019
Abstract. In this paper, the results of analyses concerning selected traffic
characteristics typical for Polish motorways and expressways are presented. The input data were collected automatically by stations located on various highways. In the first place, with the use of the coefficient of variability, periods with the lowest traffic volume variability in the year and the day were determined. On this basis, the most favourable time scope of random measurements was determined to allow reliable estimation of traffic parameters for road performance analyses. Then, based on model relationships between the characteristics of traffic volume variability over time and constant volume (regression relationships, a model of Artificial Neural Networks), correction factors were developed enabling direct conversion of the obtained measurement results into Design Hourly Volume. In addition, the rules for determining the share of heavy vehicles meeting the conditions at peak hours of the year were developed. The presented approach is in line with the current research trend on a global scale and allows for improving the accuracy of estimating Design Hourly Volume by 20 per cent concerning the method currently recommended in Poland.
Keywords: Design Hourly Volume (DHV), expressway, motorway, proportion of
105 Malwina Spławińska
Methodology for Determining Reliable Traffic Parameters for Current Analysis of Performance of Motorways and Expressways
Introduction
This paper discusses the specific problem, which has been encountered in a larger project, which is currently being implemented. The final goal of the project is to create modern methods for assessing traffic conditions and estimating road capacity for roads outside metropolitan agglomerations. A particular problem, which is addressed in this paper, is the search for model relationships between the characteristics of traffic volume variability over time and design volume for road performance analyses. On this basis, a methodology for estimating design volumes and their characteristics was developed. The scope of the analyses was limited to the non-urban fast road network that includes two-carriageway road technical classes A (motorways) and S (expressways) with permissible speed, respectively 140 km/h and 120 km/h. Research results have a practical impact on planning and design analyses, in particular on dimensioning of road facilities (roadway structures, geometric layouts). In addition, they are relevant to operational analyses. The more accurate the estimation of design volumes, the higher road reliability, as well as better traffic management and, consequently, an increase in the quality of road solutions.
According to current recommendations in Poland (GDDP, 1995), in the case of motorways and expressways, the current assessment of traffic conditions should be made by Design Hourly Volume (DHV) and the share of heavy vehicles in the hourly traffic volume (hv). The DHV is assumed as the 50th (possibly 30th, 100th or 150th) value of the highest hv in a year for roads of a specific nature of traffic (economic or tourist and recreational). This volume is determined using the conversion factor (CF) method as a share in the Annual Average Daily Traffic (AADT, vpd) volume. Since 2015, conversion factors have been published on the website of General Directorate for National Roads and Motorways of Poland) (GDDKiA) (previously, they were published once every five years in the study “Road Traffic”), but they relate to the traffic volume in the cross-section of the road (knowledge of the traffic direction distribution is therefore necessary). At the same time at higher volumes, and especially expected traffic overload, road solutions should be adapted to short-term traffic peaks. As a trade-off among costs and adaptation of solutions to instantaneous volumes, it is recommended to assume in the analyses the traffic volume from the peak quarter of a design hour in conversion into an hour (computational volume). Unfortunately, this method is very inaccurate and has many limitations, especially in the case of roads with high volume variation during the year, what were discussed in full (Capparuccini, Faghri, Polus, & Suarez, 2008;
THE BALTIC JOURNAL OF ROAD AND BRIDGE ENGINEERING
20 19/14 (1)
Estimation error of the DHV exceeds 8 per cent and 13 per cent in the group of roads of economic as well as tourist and recreational nature of traffic pattern respectively. Therefore, other methods are recommended for current traffic analysis requiring high accuracy. In addition, the Polish guidelines are unclear about how to determine the reliable share of heavy vehicles. Therefore, there is a need to develop a different methodology for determining reliable traffic characteristics that is the purpose of this paper. The focus was on methods based on direct estimation of DHV (omitting AADT) to avoid the increase of errors. In the past, due to the few research sites (until 2012 only five automatic traffic recording stations (ATRs) were located on the A- or S-class roads), such analyses were impossible.
The outline of this paper is as follows. Discussion of several works related to the methodology for determining reliable traffic characteristics, including current methods in Germany and the USA. A brief overview of available data sets. Afterwards, the paper presents and discusses the developed method for estimating design volumes and their characteristics. In the end, there is a conclusion of the paper.
1.
Related work
In Germany, until 2001, the 30th hour of the year, determined as 10 per cent of the AADT, was assumed as the DHV. However, due to numerous limitations of this method and inaccurate results, a different approach has been proposed in the issue of guidelines for dimensioning of road facilities in German Highway Capacity Manual (HBS, 2015) In the case of motorways, design traffic parameters are determined based on tabulated data from manual measurements (in a 5-year cycle) and continuous measurements by the Eq. (1) discussed by Lemke (2011). This is due to the many available data on road traffic (1 permanent traffic recording station falls on less than 20 km of highway according to (Arnold, Kluth, Thomas, & Ziegler, 2013). Measurements are carried out on representative sections located on all basic sections of German motorways. In other cases, reliable traffic characteristics are determined based on the maximum volume measured in a selected period depending on the nature of the traffic. The essential reference interval is one hour, and the analysis is carried out for each direction of traffic. In addition, it was decided to adopt the 50th hour of the year as a design hour due to the slight difference in volumes corresponding to 50th and 30th peak hours of the year. In most cases the difference
was in the range of 1.0 per cent to 2.5 per cent − discussed by Arnold &
107 Malwina Spławińska
Methodology for Determining Reliable Traffic Parameters for Current Analysis of Performance of Motorways and Expressways
by Spławińska (2013), in which the absolute difference between the
volume at the 50th and 30th hours of the year was on average 36 vph (vehicle per hour) (0.3 per cent of AADT) and had zero effect on a change in the scope of Level of Service (LOS) in any of the analysed cases.
1. Related work
In Germany, until 2001, the 30th hour of the year, determined as 10 per cent
of the AADT, was assumed as the DHV. However, due to numerous limitations of this method and inaccurate results, a different approach has been proposed in the issue of guidelines for dimensioning of road facilities in German Highway Capacity Manual (HBS, 2015) In the case of motorways, design traffic parameters are determined based on tabulated data from manual measurements (in a 5-year cycle) and continuous measurements by the Eq. (1) discussed by Lemke (2011). This is due to the many available data on road traffic (1 permanent traffic recording station falls on less than 20 km of highway according to (Arnold, Kluth, Thomas, & Ziegler, 2013). Measurements are carried out on representative sections located on all basic sections of German motorways. In other cases, reliable traffic characteristics are determined based on the maximum volume measured in a selected period depending on the nature of the traffic. The essential reference interval is one hour, and the analysis is carried out for each direction of traffic. In addition, it was decided to adopt the 50th hour of the year as a design hour due to the slight difference in volumes corresponding to 50th and 30th peak hours of the year. In most cases the difference was in the range of 1.0 per cent to 2.5 per cent − discussed by Arnold & Boettcher (2005). This also coincides with
the Polish studies discussed by Spławińska (2013), in which the absolute
difference between the volume at the 50th and 30th hours of the year was on
average 36 vph (vehicle per hour) (0.3 per cent of AADT) and had zero effect on a change in the scope of Level of Service (LOS) in any of the analysed cases.
DHVY= DHV𝐶𝐶𝐶𝐶,YAADTAADT𝐶𝐶𝐶𝐶Y−1,Y−1, (1)
where DHVY – Design Hourly Volume in year Y, vph; DHV𝐶𝐶𝐶𝐶,Y – Design Hourly Volume in year Y at a representative count site, vph; AADTY−1 – AADT in the year of last manual count, vph24; AADT𝐶𝐶𝐶𝐶,Y−1 – AADT from the same year as
AADTY−1 at a representative count site, vph24.
In the United States, the volume of the 30th hour of the year is considered as
the DHV. In 1965, the basis for this choice was published in AASHTO (1992), and it is still reprinted in subsequent versions of the guidelines (there is lack of similar publication of the basis for the choice of the 50th hour in Polish
conditions). For a typical non-urban road, in the 30th hour of the year, the rate of
decline of the highest hv shares in AADT changes. The curve to the left of the position corresponding to the 30th hour has a very steep course. Therefore items
with higher values in the descending sequence significantly exceed DHV (the volume in the 1st hour is about 67 per cent higher than the volume in the 30th
hour). To the right (of the position of the 30th hour), the curve runs flatter and the
values of many hours are a bit lower than the 30th hour volume However, current
research in this area discussed in full (Lemke, 2011; Schurr, 2010; Spławińska, 2013, 2016) indicates a different trend. For typical rural roads, the change in the rate of decline occurs at a lower position in the descending sequence of traffic volumes. Therefore, the shape of the descending sequence of volumes currently
(1)
where DHVY – Design Hourly Volume in year Y, vph; DHVC,Y – Design Hourly Volume in year Y at a representative count site, vph; AADTY-1 – AADT in the year of last manual count, vph24; AADTC,Y-1 – AADT from the same year as AADTY-1 at a representative count site, vph24.
In the United States, the volume of the 30th hour of the year is considered as the DHV. In 1965, the basis for this choice was published in AASHTO (1992), and it is still reprinted in subsequent versions of the guidelines (there is lack ofsimilar publication of the basis for the choice of the 50th hour in Polish conditions). For a typical non-urban road, in the 30th hour of the year, the rate of decline of the highest shares in AADT changes. The curve to the left of the position corresponding to the 30th hour has a very steep course. Therefore items with higher values in the descending sequence significantly exceed DHV (the volume in the 1st hour is about 67 per cent higher than the volume in the 30th hour). To the right (of the position of the 30th hour), the curve runs flatter and the values of many hours are a bit lower than the 30th hour volume However, current research in this area discussed in full (Lemke, 2011; Schurr,
2010; Spławińska, 2013, 2016) indicates a different trend. For typical
rural roads, the change in the rate of decline occurs at a lower position in the descending sequence of traffic volumes. Therefore, the shape of the descending sequence of volumes currently vaguely explains the adoption of the 30th peak hour of the year as DHV. The method of determining the DHV and reliable traffic parameters according to American guidelines for computing the capacity and quality of service Highway Capacity Manual (HCM, 2017) depends on the type of analysis. In current analyse DHV and reliable traffic parameters should be determined based on traffic measurements carried out in the same periods in which they will be taken for analysis. Thus, knowledge of local conditions from road sections with similar traffic characteristics is necessary. The analyses are carried out separately for each direction of traffic, and the primary reference interval is one hour, but the same as in the Polish approach, the traffic variability within one hour should be taken into account.
THE BALTIC JOURNAL OF ROAD AND BRIDGE ENGINEERING
20 19/14 (1)
used in Poland and is part of the current trend of research on a global scale. Other, advanced techniques using Artificial Neural Networks
(ANNs) presented in (Ghanim, 2011; Spławińska, 2015), genetic
algorithms discussed by Liu & Sharma (2006) or regression and power
functions presented in (Schurr, 2010; Spławińska, 2016), boil down to
determining DHV indirectly by AADT. Therefore, they have limited use. There has been a steady increase in the number of ATRs in recent years on Polish highways (since 2015, there have been 30 of them). However, the use of tabulated values is burdened with error (on average, one station falls on over 100 km of motorways and expressways). Due to slight differences between the volume at the 50th and 30th hours of the year and the lack of characteristic graph bend in the highest hourly volume in the year, the 50th peak hour of the year was adopted as DHV.
According to Spławińska (2018), on Polish highways, the graph bend
occurs in the first 30 peak hours of the year. At the same time, due to the high randomness of the type structure at peak hours of the year, a range of the 30th to a 50th hour was assumed as the design period for determining the traffic parameters.
2. Data
109 Figure 1. Map of places of automatic traffic recording stations in Poland
by the General Directorate for National Roads and Motorways of Poland
value, to assess the usefulness of data. Only reliable data were used for the basic analyses, from the stations in which the measurement took place on all days of the year or measurements from a maximum of 18 days were missing (C more than 95 per cent). Because values of daily volumes deviate from the average values, statutory holidays and those directly related to them were removed from the analyses – Table 1 (determined based on detailed analyses of daily volume variability). However, it should be noted that the data limitations apply only to analyses used to determine typical traffic characteristics. Peak values in
Golden River PAT
RPP-2 RPP-3 RPP-5
THE BALTIC JOURNAL OF ROAD AND BRIDGE ENGINEERING
20 19/14 (1)
the year, including those considered as reliable (a range of the 30th hour to the 50th hour); have been designated traditionally based on all days of the year. Besides, due to the high randomness of traffic typical of roads with tourist and recreational nature of traffic, and a relatively little base (six locations), the analysis was limited only to roads with an economic nature of traffic.
due to periodic traffic bans, the days from Friday to Sunday in summer were determined additionally. In the situation of recording unreliable data (individual
hv values deviating from typical profiles), zero values or those exceeding the capacity of the lane, they were removed from further analyses. The so-called completeness index (𝐶𝐶𝐶𝐶) was determined (Eq. (2)) according to AASHTO (1992)), which defines the number of available data with the expected value, to assess the usefulness of data. Only reliable data were used for the basic analyses, from the stations in which the measurement took place on all days of the year or measurements from a maximum of 18 days were missing (𝐶𝐶𝐶𝐶 more than 95 per cent). Because values of daily volumes deviate from the average values, statutory holidays and those directly related to them were removed from the analyses – Table 1 (determined based on detailed analyses of daily volume variability). However, it should be noted that the data limitations apply only to analyses used to determine typical traffic characteristics. Peak values in the year, including those considered as reliable (a range of the 30th hour to the 50th hour); have been
designated traditionally based on all days of the year. Besides, due to the high randomness of traffic typical of roads with tourist and recreational nature of traffic, and a relatively little base (six locations), the analysis was limited only to roads with an economic nature of traffic.
𝐶𝐶𝐶𝐶=�𝑛𝑛𝑛𝑛𝑑𝑑𝑑𝑑
𝑛𝑛𝑛𝑛0� ∙100, (2)
where 𝐶𝐶𝐶𝐶 − completeness index, %; 𝑛𝑛𝑛𝑛𝑑𝑑𝑑𝑑 − available number of measurement days with correct data; 𝑛𝑛𝑛𝑛𝑜𝑜𝑜𝑜 − expected number of measurement days (365 or 366).
Figure 1. Map of places of automatic traffic recording stations in Poland by the General Directorate for National Roads and Motorways of Poland
Table 1. The list of public holidays and related dates in 2015
(2)
where C − completeness index, %; nd − available number of measurement
days with correct data; no − expected number of measurement days
(365 or 366).
Table 1. The list of public holidays and related dates in 2015
Date
the “period” days off
work Date
the “period” days off
work Date
the “period” days off
work
01 January
01–04
January 01 May 30 April− 03 May
15 August 14–17 August
06 January
05−06
January 03 May
01 November
30 October− 2 November
05 April
02−07 April
24 May 24 May 11
November
10−12 November
06 April 04 June 03−08 June 25
December 23−31 December 26
December
3. Methodology
The little objective of this research is the development of a methodology for determining the DHV for the traffic conditions analysis. The methodology to achieve this objective is as follows:
• determining a favourable time scope for conducting random
measurements to determine DHV and its characteristics;
• determining the model relationships among characteristics of
traffic volume variability over time and DHV;
111 Malwina Spławińska Methodology for Determining Reliable Traffic Parameters for Current Analysis of Performance of Motorways and Expressways
• determining the important traffic characteristics for the traffic conditions analysis.
These four steps are discussed in the following paragraphs.
3.1. Determination of the favourable time scope for random measurements
Measurement of traffic should fall on those periods of the day and the year in which typical (repetitive) traffic volumes are observed. The purpose of this analysis is to determine the consistency of the traffic volumes in terms of their deviation from typical values. Analyses were carried out to , also taking into account the morning and afternoon peak and the dominant one in the day (the highest value in the day).
The coefficient of volume variability (ε) was determined by the Eq. (3) discussed in (Jakubowski, Kot, & Sokołowski, 2007) to determine the
periods with the lowest traffic volume variability in the year and the
day. The ε value defines a relative measure of dispersion of the peak hour
coming from a different period of the year. On this basis, it is possible to determine a preferred period of carrying the traffic measurements
due to the variability in traffic volume (the lower the value of the ε, the
lower the variation in peak hour on the following day). Similar analyses were conducted by Kenno, Mehran, Sahu, & Sharma (2017). The obtained
average results with different data aggregation (since ε values were
more than twice the total value for days Saturday and Sunday, and January and December, they were removed from the analysis) are shown in Table 2.
ε=�σ𝑦𝑦𝑦𝑦�� ∙100, (3)
where ε − coefficient of variation of the studied traffic characteristic, %; σ −
standard deviation of the studied traffic characteristic; 𝑦𝑦𝑦𝑦� − average value of the studied traffic characteristic.
Table 2. Average value of ε in per cent of the peak hour with different aggregation of days and months in the year
Months
Morning peak Afternoon peak Dominant peak
M on day Tue sda y W edne sda y Thur sda y Fr id ay M on day Tue sda y W edne sda y Thur sda y Fr id
ay Mon
day Tue sda y W edne sda y Thur sda y Fr id ay
February−November 8.4 8.1 7.9 8.3 8.1 8.8 7.8 7.7 7.3 7.7 8.4 7.7 7.7 7.8 7.8 April−November 6.3 6.7 7.1 7.5 6.7 7.0 6.3 6.7 6.2 6.8 6.5 6.3 6.7 6.9 6.9 April−June,
September−November 6.0 6.6 6.9 7.4 6.4 6.8 6.4 7.0 6.0 6.7 6.4 6.4 7.0 6.8 6.8 July−August 4.4 4.1 5.0 4.6 4.9 5.3 4.8 4.8 5.7 5.6 4.6 4.5 4.6 5.3 5.3
The analyses show that the value of the ɛ depends on the analysed scope (morning, afternoon and dominant peak) as well as months and days of the year. The lowest values for the entire analysed period were obtained for the dominant peak and the days from Tuesday to Friday, while in the case of months, for July and August. At the same time for the April–June and September–November, a relatively low variability was obtained (ɛ< 7 per cent) therefore the entire period from April to November is beneficial for carrying out traffic measurements. The hours in the day of occurrence of the dominant traffic peak were determined to supplement the characteristics concerning the favourable time scope for random measurements to determine the DHV and its characteristics. The time scope of the data was limited to the April−November and Monday, Tuesday−Thursday (combined analyses), and Friday. Thus, the following results were obtained (ranges determined from the mean values of the analysed range for each of the measurement stations):
− hours on Monday − 05:00−09:00, 14:00−18:00;
− hours on Tuesday–Thursday − 05:00−09:00, 14:00−18:00;
− hours on Friday − 06:00−09:00, 14:00−19:00 (in over 90 per cent, the afternoon peak dominance was obtained).
The determined hours are consistent with the literature data. For example, according to HBS (2015), the traffic measurement should be carried out on the days Tuesday–Thursday between 06:00 and 09:00 and between 15:00 and 18:00 or on Friday between 12:00 and 19:00.
3.2. Determination of model relationships between the characteristics of traffic volume variability over time and the Design Hourly Volume
(3)
where ε − coefficient of variation of the studied traffic characteristic, %; σ − standard deviation of the studied traffic characteristic; y − average
value of the studied traffic characteristic.
The analyses show that the value of the depends on the analysed scope (morning, afternoon and dominant peak) as well as months and days of the year. The lowest values for the entire analysed period were obtained for the dominant peak and the days from Tuesday to Friday, while in the case of months, for July and August. At the same time for the April–June and September–November, a relatively low variability
was obtained (ɛ < 7 per cent) therefore the entire period from April to
November is beneficial for carrying out traffic measurements. The hours in the day of occurrence of the dominant traffic peak were determined to supplement the characteristics concerning the favourable time scope for random measurements to determine the DHV and its characteristics. The
THE BALTIC JOURNAL OF ROAD AND BRIDGE ENGINEERING
20 19/14 (1)
Tuesday−Thursday (combined analyses), and Friday. Thus, the following
results were obtained (ranges determined from the mean values of the analysed range for each of the measurement stations):
• hours on Monday − 05:00−09:00, 14:00−18:00;
• hours on Tuesday–Thursday − 05:00−09:00, 14:00−18:00;
• hours on Friday − 06:00−09:00, 14:00−19:00 (in over 90 per cent,
the afternoon peak dominance was obtained).
The determined hours are consistent with the literature data. For example, according to HBS (2015), the traffic measurement should be carried out on the days Tuesday–Thursday between 06:00 and 09:00 and between 15:00 and 18:00 or on Friday between 12:00 and 19:00.
3.2. Determination of model relationships between the characteristics of traffic volume variability over time and the Design Hourly Volume
Due to the German experiments discussed in full (Arnold, Kluth, Thomas, & Ziegler, 2013) and the result of preliminary analyses carried
out by Spławińska (2013), the time scope of the data was limited to days of
the week and months of the year with the most significant share of hours with the highest volume in the year. The days with the most significant number of occurrences of peak hours in a year and also subsequent ones in which there was at least 20 per cent of occurrences were taken into Table 2. Average value of in per cent of the peak hour with different aggregation of days and months in the year
Months
Morning peak Afternoon peak Dominant peak
M
ond
ay
Tu
es
day
W
edn
esd
ay
Th
ur
sday
Fr
iday
M
ond
ay
Tu
es
day
W
edn
esd
ay
Th
ur
sday
Fr
iday
M
ond
ay
Tu
es
day
W
edn
esd
ay
Th
ur
sday
Fr
iday
February−
November 8.4 8.1 7.9 8.3 8.1 8.8 7.8 7.7 7.3 7.7 8.4 7.7 7.7 7.8 7.8 April−
November 6.3 6.7 7.1 7.5 6.7 7.0 6.3 6.7 6.2 6.8 6.5 6.3 6.7 6.9 6.9 April−June,
September− November
6.0 6.6 6.9 7.4 6.4 6.8 6.4 7.0 6.0 6.7 6.4 6.4 7.0 6.8 6.8
113 Malwina Spławińska
Methodology for Determining Reliable Traffic Parameters for Current Analysis of Performance of Motorways and Expressways
account. The aim was to increase the number of days when the traffic
measurements were carried out. The time scope was: on April−December,
Monday–Friday – roads with AADT > 30 000 vpd/direction, Monday – roads located in the impact zone of the city of Poznan, Sunday – roads located in the impact zone of the city of Warsaw and Wroclaw or in the area of a border crossing with Germany in the direction towards the city/ border, Friday – other cases. In the case of the dominance of Sunday and days from Monday to Friday (equal load on working days), days from Tuesday to Thursday were left out. This was due to the greater accuracy of estimating the DHV by about 1.3 per cent of points compared to Monday and Friday. Finally, 1868 cases were collected concerning the of the dominant traffic peak from 24 measurement cross-sections.
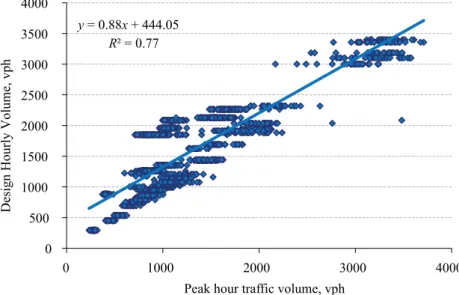
The nature of the relationship between DHV and the dominant peak hour volume was examined to choose the best model to determine the DHV (maximum value in the day – Qmax) (Figure 2).
Due to the linear nature of the relationship between DHV and Qmax, it was decided to apply a traditional method using correction factors (currently recommended in Germany). As a result method for estimating the DHV, the so-called DHVe. Data were grouped according to the day of
the week in which the highest hourly traffic volumes in the year occur most frequently (the so-called dominant day). In the case of Sunday dominance, the data were grouped according to the function of a given road (designation of exit routes in the direction of border crossings). The
Figure 2. Graph of the relationship between the Design Hourly Volume and dominant perk hour
y = 0.88x + 444.05
R² = 0.77
0 500 1000 1500 2000 2500 3000 3500 4000
0 1000 2000 3000 4000
Design Hourly Volume, vph
THE BALTIC JOURNAL OF ROAD AND BRIDGE ENGINEERING
20 19/14 (1)
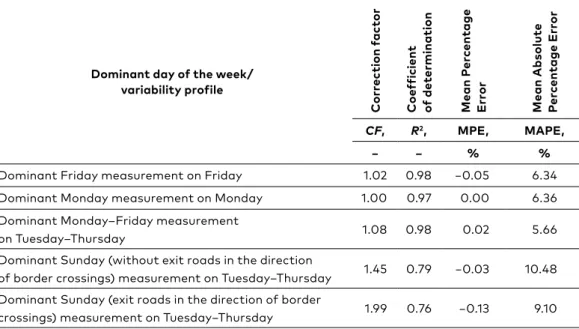
grouping of data was aimed to determine correction factors (CF). Then, from the regression relation, the value of (coefficient of determination) and CF were determined in each group. Qmax was compared to the actual values according to the Eqs (4) and (5) to determine the accuracy of the developed method. Then, the correction factor was corrected so that the value of MPE was close to 0.00 (removal of values continually higher or lower than the expected value). The results obtained are summarised in Figure 3 and Table 3. Correction factors show convergence with the factors defined in HBS (2015), that is the days around the weekend: 1.02 (Friday) and 1.0 (Monday) – 1.0 according to HBS (2015), steady traffic on working days 1.08 (measurement from Tuesday to Thursday) – 1.07 according to HBS (2015).
(coefficient of determination) and 𝐶𝐶𝐶𝐶𝐶𝐶𝐶𝐶 were determined in each group. 𝑄𝑄𝑄𝑄max was
compared to the actual values according to the Eqs (4) and (5) to determine the accuracy of the developed method. Then, the correction factor was corrected so that the value of MPE was close to 0.00 (removal of values continually higher or lower than the expected value). The results obtained are summarised in Figure 3 and Table 3. Correction factors show convergence with the factors defined in HBS (2015), that is the days around the weekend: 1.02 (Friday) and 1.0 (Monday) – 1.0 according to HBS (2015), steady traffic on working days 1.08 (measurement from Tuesday to Thursday) – 1.07 according to HBS (2015).
MPE =𝑇𝑇𝑇𝑇1∑ �DHV−𝑄𝑄𝑄𝑄DHV𝑒𝑒𝑒𝑒
DHV �
𝑇𝑇𝑇𝑇
𝑖𝑖𝑖𝑖=1 ∙100%, (4)
MAPE =1𝑇𝑇𝑇𝑇∑ ��DHV−DHV𝑒𝑒𝑒𝑒
DHV � ∙100%�
𝑇𝑇𝑇𝑇
𝑖𝑖𝑖𝑖=1 , (5)
where MPE − mean percentage error, %; T – day in a year, number; DHV − Design Hourly Volume, vph.
a) dominant working day of the week
(4)
(coefficient of determination) and 𝐶𝐶𝐶𝐶𝐶𝐶𝐶𝐶 were determined in each group. 𝑄𝑄𝑄𝑄max was
compared to the actual values according to the Eqs (4) and (5) to determine the accuracy of the developed method. Then, the correction factor was corrected so that the value of MPE was close to 0.00 (removal of values continually higher or lower than the expected value). The results obtained are summarised in Figure 3 and Table 3. Correction factors show convergence with the factors defined in HBS (2015), that is the days around the weekend: 1.02 (Friday) and 1.0 (Monday) – 1.0 according to HBS (2015), steady traffic on working days 1.08 (measurement from Tuesday to Thursday) – 1.07 according to HBS (2015).
MPE =𝑇𝑇𝑇𝑇1∑ �DHV−𝑄𝑄𝑄𝑄DHV𝑒𝑒𝑒𝑒
DHV �
𝑇𝑇𝑇𝑇
𝑖𝑖𝑖𝑖=1 ∙100%, (4)
MAPE =1𝑇𝑇𝑇𝑇∑ ��DHV−DHV𝑒𝑒𝑒𝑒
DHV � ∙100%�
𝑇𝑇𝑇𝑇
𝑖𝑖𝑖𝑖=1 , (5)
where MPE − mean percentage error, %; T – day in a year, number; DHV − Design Hourly Volume, vph.
a) dominant working day of the week
(5)
where MPE − mean percentage error, %; T – day in a year, number; DHV −
Design Hourly Volume, vph.
Table 3. Statistical data for estimating the Design Hourly Volume according to the correction factors
Dominant day of the week/ variability profile C or rec ti on f ac tor C oef fic ie nt of d et er mi na ti on M ea n P er cen tage E rr or M ean A bso lu te P er cen tage E rr or
CF, R2, MPE, MAPE,
− − % %
Dominant Friday measurement on Friday 1.02 0.98 −0.05 6.34 Dominant Monday measurement on Monday 1.00 0.97 0.00 6.36 Dominant Monday–Friday measurement
on Tuesday–Thursday 1.08 0.98 0.02 5.66
Dominant Sunday (without exit roads in the direction
of border crossings) measurement on Tuesday–Thursday 1.45 0.79 −0.03 10.48 Dominant Sunday (exit roads in the direction of border
115 Malwina Spławińska
Methodology for Determining Reliable Traffic Parameters for Current Analysis of Performance of Motorways and Expressways
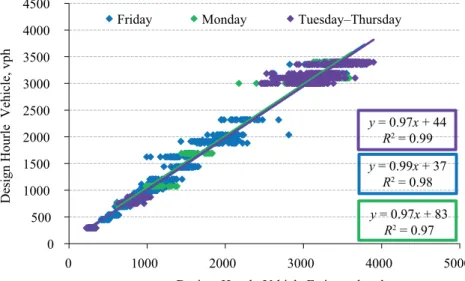
a) dominant working day of the week
b) dominant Sunday
Figure 3. Graph of the relationship between the actual and estimated value of Design Hourly Volume
0 500 1000 1500 2000 2500 3000 3500 4000 4500
0 1000 2000 3000 4000 5000
Design Hourly Vehicle Estimated, vph Friday Monday Tuesday–Thursday
Design Hourle Vehicle, vph
y = 0.97x + 44
R2 = 0.99
y = 0.99x + 37
R2 = 0.98
y = 0.97x + 83
R2 = 0.97
0 1000 2000 3000 4000 5000 6000
0 2000 4000 6000 8000
Design Hourle
Ve
hicle. vph
Design Hourly Vehicle Estimated, vph Friday
Tuesday–Thursday – road to the border
y = 0.77x + 383.09
R2 = 0.79
y = 0.66x + 519.23
THE BALTIC JOURNAL OF ROAD AND BRIDGE ENGINEERING
20 19/14 (1)
Design Hourly Volume should be determined according to the following scheme:
1. Traffic measurement for the analysed traffic direction, from April to November on the working day of the week directly (excluding public holidays and days related to them), in the following hours:
• 05:00–09:00 and 14:00–18:00 – measurement on Monday–
Thursday;
• 06:00–09:00 and 14:00–19:00 – measurement on Friday.
2. Adoption of correction factors depending on the day of the week in which the highest hourly traffic volumes occur most frequently according to Table 3. Note: Roads with an economic nature of traffic pattern most often are characterised by Friday dominance or, in the case of impact zone of the city of Warsaw and Wroclaw in the direction of the city – Sunday dominance. In the case of high traffic volumes (AADT > 30 000 vph/direction), balanced traffic is observed on working days that are Monday–Friday dominance.
3. Determination of the DHV by multiplying the highest value obtained from traffic measurements by the appropriate correction factors according to the Eq. (6):
DHV = QmaxCF, (6)
where DHV – Design Hourly Volume in the measurement year, vph; Qmax –
maximum hourly traffic volume from the measurement period, vph; CF – correction factor depending on the day of the week in which the highest hourly traffic volumes occur most frequently and the nature of traffic pattern.
3.3. Verification of the developed method
According to earlier findings, DHV was determined for 2015 data, namely based on the highest hv value of traffic volumes from traffic measurements carried out on typical days of the week. These are:
• Friday (except for roads located in the impact zone of the city of Warsaw and Wroclaw in the direction of the city);
• Tuesday–Thursday (roads located in the impact zone of the city of Warsaw and Wroclaw in the direction of the city and with AADT > 30 000 vpd/direction).
117 Malwina Spławińska
Methodology for Determining Reliable Traffic Parameters for Current Analysis of Performance of Motorways and Expressways (similar MAPE values for all months of the year, the highest individual
values were most often obtained in April). In the case of Sunday dominance and measurement on Tuesday–Thursday, the best accuracy was obtained for Tuesday (by more than half and nearly 2 per cent of
points to Wednesday and Thursday, respectively) and April−August.
In total, a satisfactory average MAPE of 6.4 per cent was obtained for the measurement on Friday and 7.2 per cent for the measurement on Tuesday–Thursday (according to German data, the accuracy of the CF
method is 7.9 per cent for Friday and 6.9 per cent for Tuesday−Thursday).
For additional verification, similar analyses were conducted for data from 2016 for a randomly selected ATR. The analyses were limited to the most common case that is Friday dominance. Also with this approach, satisfactory results were obtained (Table 5).
Table 4. Mean Absolute Percentage Error of the method for estimating the Design Hourly Volume according to correction factors
Statistical parameters
Months
A
pri
l
M
ay
Ju
ne
Jul
y
Au
gu
st
S
ep
temb
er
Oc
to
be
r
N
ov
emb
er
Friday afternoon measurement
Average, % 7.7 5.9 5.2 6.1 6.1 6.8 6.4 6.7
Standard
deviation, % 4.4 3.8 3.8 3.4 2.9 3.3 3.1 2.8 Monday measurement
Average, % 6.9 6.5 6.0 6.7 6.5 5.5 6.7 5.6
Standard
deviation, % 5.2 4.2 4.4 5.0 4.8 3.2 2.5 2.2 Tuesday measurement
Average, % 5.6 5.7 6.3 5.5 5.1 7.0 8.3 8.2
Standard
deviation, % 3.4 3.4 2.9 2.5 2.7 3.8 5.4 4.7 Wednesday measurement
Average, % 5.7 6.3 7.1 7.1 7.0 7.8 8.2 6.9
Standard
deviation, % 2.9 3.3 3.3 3.7 3.2 3.9 5.2 3.6 Thursday measurement
Average, % 6.7 8.1 7.7 8.8 7.3 9.0 10.1 7.6 Standard
THE BALTIC JOURNAL OF ROAD AND BRIDGE ENGINEERING
20 19/14 (1)
Table 5. Mean Absolute Percentage Error of the method for estimating the Design Hourly Volume according to correction factors
Year Stationnumber
Friday afternoon measurement, %
A
pri
l
M
ay
Ju
ne
Jul
y
Au
gu
st
S
ep
temb
er
Oc
to
be
r
N
ov
emb
er
A
ver
age
2015 S7_26009_k1 6.4 5.3 6.1 5.7 6.9 1.9 4.3 5.4 5.3
2016 S7_26009_k1 3.5 3.4 3.3 3.4 2.9 1.5 4.6 7.4 3.8
2015 S7_26009_k2 7.5 1.9 2.9 4.4 8.1 3.3 6.3 4.2 4.8
2016 S7_26009_k2 4.3 2.8 3.9 6.0 5.6 9.3 5.4 3.6 5.1
Since the basis of the presented method is the correct classification of the road section to the roads with the appropriate nature of traffic pattern, the quantitative and qualitative features constituting
the basis for this division, discussed by Spławińska (2017; 2018),
119 3.4. Determination of reliable traffic characteristics
for traffic conditions analysis
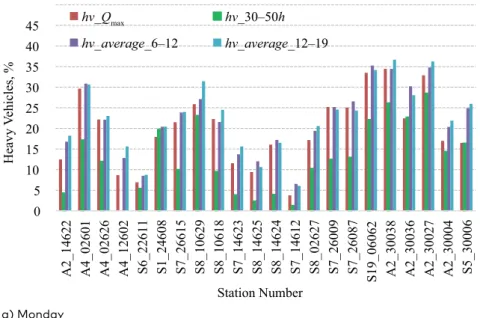
The analysis consisted of determining the share of heavy vehicles for the dominant peak hour (hv_Qmax) and the average for the
morning hours (06:00−12:00 – hv_average_6–12 and afternoon hours
(12:00−19:00 – hv_average_12–19) on the days, weeks and months of the year, in which the highest hourly traffic volumes occur most often in a year. The time scope of analyses was limited to the working days of the week (Friday and Monday). Figure 4 shows the results obtained. The hv values, which are the closest to the value corresponding to the position in the descending sequence from the 30th to 50th position (hv_30 – 50h), were obtained for the dominant peak hour (average difference for Friday and Monday 2.7 per cent and 6.9 per cent of points, respectively). In the case of the average of morning and afternoon hours, differences obtained were even more than six times higher than the dominant peak hour. The highest average difference was obtained for the average of hours 06:00 to 12:00 on Friday, comprising 11.5 per cent of points). These results indicate that in the case of operational analyses, the hv should be adopted by peak hour, contrary to the German method, which uses the average of the entire measurement (underestimation of the share of heavy vehicles Table 6. Descriptive statistics for the Artificial Neural Network models
Ty pe a nd s tr uc tu re of t he ne tw or k Q uo tie nt d ev ia ti ons C or re la ti on M ea n P er cen tage E rr or, % M ean A bso lu te P er cen tage E rr or , %
Error quotient of the sensitivity analysis
D om in an t P eak H ou r, vp h A nn ua l A ve ra ge D ai ly Tr af fi c* B or de r c ro ss ings B al ti c S ea di rec ti on Im pa ct of c it ie s R egi on of P ol an d Linear
5:14−1:1 0.34 0.94 8.10
16.23
(9.6) 2.33 1.22 1.06 − 1.07 1.28
Multilayer Perceptron
6:17−4-1:1
0.20 0.98 0.87 6.49
(5.4) 3.24 3.82 1.63 1.06 2.08 2.28
THE BALTIC JOURNAL OF ROAD AND BRIDGE ENGINEERING
20 19/14 (1)
a) Monday
b) Friday
Figure 4. The share of heavy vehicles in April−November 0
5 10 15 20 25 30 35 40 45
A2_14622 A4_02601 A4_02626 A4_12602 S6_22611 S1_24608 S7_26615 S8_10629 S8_10618 S7_14623 S8_14625 S8_14624 S7_14612 S8_02627 S7_26009 S7_26087 S19_06062 A2_30038 A2_30036 A2_30027 A2_30004 S5_30006
Heavy
Ve
hicles, %
Station Number
hv_Qmax hv_30–50h
hv_average_6–12 hv_average_12–19
0 5 10 15 20 25 30 35 40 45
A2_14622 A4_02601 A4_02626 A4_12602 S6_22611 S1_24608 S7_26615 S8_10629 S8_10618 S7_14623 S8_14625 S8_14624 S7_14612 S8_02627 S7_26009 S7_26087 S19_06062 A2_30038 A2_30036 A2_30027 A2_30004 S5_30006 hv_Qmax hv_30–50h
hv_average_6–12 hv_average_12–19
Heavy
Ve
hicles, %
Station Number
121 Malwina Spławińska
Methodology for Determining Reliable Traffic Parameters for Current Analysis of Performance of Motorways and Expressways
Conclusion
In this paper, the challenges of a practical prediction task, specified by General Directorate for National Roads and Motorways of Poland, were discussed. This task was to predict the meaningful traffic characteristics (Design Hourly Volume, the proportion of heavy vehicles) for the analysis of motorways and expressways performance based on several hours of traffic measurements. Due to the available database, the analysis was limited to rural roads with the economic nature of traffic pattern. Based on the conducted traffic analyses, beneficial periods of traffic measurements as well as rules for converting their results into constant values were determined. The methodology is simple to use (determination of the Design Hourly Volume by multiplying the highest hourly traffic volume value of obtained from traffic measurements by the appropriate correction factors) and allows determining reliable traffic parameters for the most of the year (excluding only the winter months). The results presented in the paper indicate that the presented approach is promising as it improves the indicator of the baseline method significantly. A more than twenty per cent improvement in the accuracy of the Design Hourly Volume estimate was obtained, assuming that the Annual Average Daily Traffic value is right in the current method (the error resulting from the Annual Average Daily Traffic estimate was disregarded). Besides, the method of determining the share of heavy vehicles corresponding to the conditions at peak hours of the year was indicated, which so far had been missing. The findings of this study constitute guidelines to be applied by road administration entities for dimensioning of road facilities and for traffic management. However, it should be noted that due to the relatively small-scale sample, the obtained results might be characterised by some randomness, also resulting from the dependence of traffic patterns on the location of a given station. As the number of automatic traffic recording stations increases, similar research should be continued, including roads with the tourist nature of traffic pattern.
Acknowledgement
THE BALTIC JOURNAL OF ROAD AND BRIDGE ENGINEERING
20 19/14 (1)
REFERENCES
AASHTO. (1992). AASHTO Guidelines for Traffic Data Programs, American Association of State Highway and Transportation Officials.
Arnold, M., Kluth, T., Ziegler, H., & Thomas, B. (2013). Bemessungsverkehrs-stärken auf einbahnigen Landstraßen. (in German)
Arnold, M., & Böttcher, S. (2005). Bemessungsverkehrsstärken vor dem Hintergrund sich verändernder Pegel: deskriptive Analyse von Dauerlinien und Schätzung von Dauerlinienkennwerten auf Basis von Kurzzeitzählungen (No. 922). (in German)
HBS (2015). Handbuch für die Bemessung von Straßenverkehrsanlagen. Teil A: Autobahnen. Köln: Forschungsgesellschaft für Straßen- und Verkehrswesen (FGSV). (in German)
Capparuccini, D. M., Faghri, A., Polus, A., & Suarez, R. E. (2008). The Fluctuation and Seasonality of Hourly Traffic, and the Accuracy of DHV Estimates. Transportation Research Record: Journal of the Transportation Research Board 2049, 63-70. https://doi.org/10.3141%2F2049-08
Ghanim, M. S. (2011). Florida Statewide Design-Hour Volume Prediction Model (No. 11-3693).
HCM (2017). Highway Capacity Manual. Transportation Research Board of the National Academies (Sixth Edition).
GDDP (1995). Instrukcja obliczania przepustowości dróg I i II klasy technicznej
(autostrady i drogi ekspresowe). (in Polish)
Kenno, S. Y., Sahu, P. K., Mehran, B., & Sharma, S. (2017). Investigation of the factors affecting the consistency of short-period traffic counts. Journal of modern transportation, 25(3), 150-162.
https://doi.org/10.1007/s40534-017-0133-y
Kot, S. M., Jakubowski J., & Sokołowski, A. (2007). Statystyka. Podręcznik dla studiów ekonomicznych, Warszawa: Difin. (in Polish)
Lemke, K. (2011). Estimation of the Peak-Hour Demand In the German Highway Capacity Manual. Procedia-Social and Behavioral Sciences, 16, 762-770. https://doi.org/10.1016/j.sbspro.2011.04.495
Liu, Z., & Sharma, S. (2006). Predicting directional design hourly volume from statutory holiday traffic. Transportation Research Record: Journal of the Transportation Research Board, (1968), 30-39.
https://doi.org/10.1177%2F0361198106196800104
Maśkiewicz J. (2016). General Directorate for National Roads and Motorways of
Poland, Department of Traffic Analysis.
Schurr, K. (2010). Using Traffic Estimates to Evaluate Intersection Improvements. Project P553, Nebraska.
Sharma, S. C., Wu, Y., & Rizak, S. N. (1995). Determination of DDHV from directional traffic flows. Journal of Transportation Engineering, 121(4), 369-375. https://doi.org/10.1061/(ASCE)0733-947X(1995)121:4(369)
Spławińska, M. (2018). Analysis of selected traffic characteristics on motorways
123 Malwina Spławińska
Methodology for Determining Reliable Traffic Parameters for Current Analysis of Performance of Motorways and Expressways
Spławińska, M. (2017). Factors determining seasonal variations in traffic
volumes. Archives of Civil Engineering, 63(4), 35-50. https://doi.org/10.1515/ace-2017-0039
Spławińska, M. (2016). Methodology for determining traffic volume for the
analysis of roads efficiency. Roads and Bridges-Drogi i Mosty, 15(1), 45-60. https://doi.org/10.5604/08669546.1160929
Spławińska, M. (2015). Development of models for determining the traffic
volume for the analysis of roads efficiency. Archives of Transport, 33.
https://doi.org/10.5604%2F08669546.1160929