TECHNICAL UNIVERSITY OF CLUJ-NAPOCA
ACTA TECHNICA NAPOCENSIS
Series: Applied Mathematics, Mechanics, and Engineering Vol. 61, Issue I, March, 2018
EVALUATION OF ENVIRONMENTALLY FRIENDLY LUBRICANTS
UNDER DIFFERENT WORKPIECE SURFACE ROUGHNESS
Alexandru BUCUR, Gheorghe ACHIMAȘ, Lucian LĂZĂRESCU, Grigore Marian POP
Abstract: In this paper, four environmentally friendly lubricants (rapeseed oil, palm oil, boric acid and palm stearin) were evaluated under different workpiece surface roughness. The ring compression test was used to perform the study. The calibration curves, obtained by Finite Element simulation of ring compression test, were used to estimate the friction factor for each lubricant. The results showed that the palm stearin has the best lubrication properties followed by the boric acid, palm oil and rapeseed oil. Key words: metal forming, biodegradable lubricants; ring compression test; rapeseed oil, palm oil.
1. INTRODUCTION
The lubricants used in the metal forming processes play an important role, as they reduce the energy consumption, increase the tools' life, the material formability and the surface quality of the formed part.
The environmentally friendly lubricants are an alternative of the existing industrial lubricants, which pollute the environment and affect the human health. There are efforts to develop and evaluate the biodegradable lubricants. The authors of the paper [1] evaluated the lubrication performance of soybean and rapeseed combined with CuO and
SiO2 microparticles using the ring compression
test (RCT). Syahrullail [2] evaluated the refined, bleached and deodorized palm olein, palm stearin and palm oil, respectively in cold extrusion process of aluminum. They have found that the three lubricants show sufficient lubrication performance. The lubrication performance of boric acid was investigated in the paper [3] in different metal forming conditions. The authors have found that the boric acid provides the best lubrication conditions. In the paper [4] the authors have evaluated the lubrication performance of rapeseed oil, palm oil, boric acid and palm stearin in comparison
with a synthetic oil using the RCT of aluminum alloy.
There are few studies dealing with the evaluation of the lubrication properties of environmentally friendly lubricants under different surface roughness of the workpiece. Due to the lack of knowledge, it is possible that some biodegradable lubricants to be used under improper conditions.
The purpose of this study is to investigate the effect of workpiece surface roughness on the
lubrication performance of some
environmentally friendly lubricants, such as rapeseed oil, palm oil, boric acid and palm stearin for bulk forming processes.
2. EXPERIMENTS
2.1 The ring compression test
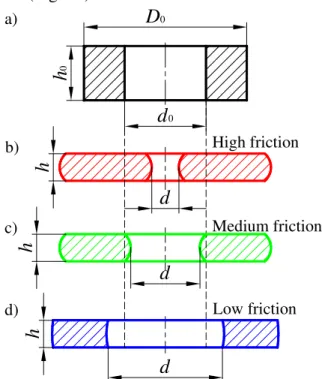
Due to its simplicity, the ring compression test (Fig. 1) is one of the most widely used tests for the evaluation of friction at tool-workpiece interface for bulk forming processes, such as extrusion, and forging. This test was first used by Male and Cockroft in 1965 [5]. The test is based on the modification of the dimensions of a ring specimen due to the friction conditions.
this, a low friction results in an outward material flow (Fig. 1d).
Fig. 1. Different cases of material flow during the ring
compression test
For a certain reduction in specimen height, when the friction at the tool/workpiece interface is low, the inner diameter increases, and when the friction is high, the inner diameter decreases. Using this relationship between the friction and the inner diameter, the calibration curve can be generated by measuring the inner diameter. The calibration curve is a graphical representation of the pairs of values: the percent reduction in height (Eq.1) versus the percentage reduction in inner diameter (Eq.2).
0
0
100 [%]
h h h
h
−
∆ = × (1)
0
0
100 [%]
d d d
d
−
∆ = × , (2)
where,
∆
h is the reduction in height;h0 – the original height of specimen;
h – the current height of specimen;
∆
d – the decrease in inner diameter;d0 – the original inner diameter;
d – the current inner diameter.
2.2 Material and lubricants
The ring specimens were prepared from as received AA6060-T6 aluminum alloy.
Five environmentally friendly lubricants were chosen to evaluate theirs lubrication performance under different condition of workpiece surface roughness: rapeseed oil, palm oil, boric acid and palm stearin. The rapeseed oil was degummed and has a cinematic viscosity of
32 mm2/s at 40 ºC. The commercially available
cold pressed palm oil were used. The boric acid is a solid lubricant in the form of white powder. The palm stearin is also a solid lubricant in form of white powder.
2.3 Preparation of ring specimens
The dimensions of the ring specimens were chosen based on the relationship
0 0
0 2 3
D D
D × × , (3)
where, D0 is the outer diameter; D0/2 is the inner
diameter, denoted by d0 in Figure 1 and D0/3 is
the specimen height, denoted by h0 in Figure 1.
The specimen dimensions were: D0=20 mm;
d0=10 mm and h0= 6.66 mm.
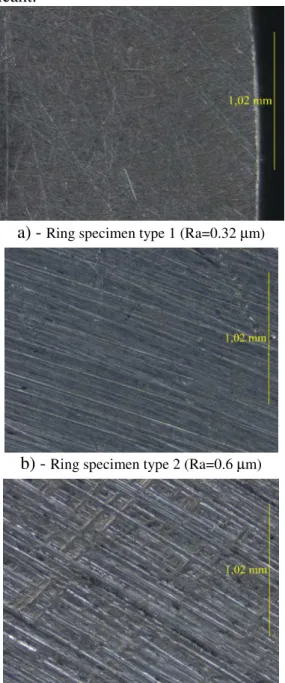
In order to evaluate lubrication performance of the four lubricants under different workpiece surface roughness, the flat surfaces of ring specimens were polished using sandpapers with three different grit sizes. Figure 2 shows three representative ring specimens whose surfaces were polished using sandpapers with different grit sizes. Figure 3 compares the surfaces of the three types of specimens. The surface roughness (Ra) of ring specimens were measured using a digital surface roughness tester, type TIME TR220. The measured surface roughness were 0.32, 0.60 and 1.91 µm.
a) – Type 1 b) – Type 2 c) – Type 3
Fig. 2. Representative ring specimens before deformation
The experiments were carried out using a universal material testing machine Instron, model 1196. The test speed was 2 mm/min. Figure 4 shows the die setup used in this study. For each type of specimen at the least three ring
D
0h
0
a)
Low friction High friction
h
h
b)
d
d
0d)
Medium friction
h
c)
d
compression tests were performed for each lubricant.
a) - Ring specimen type 1 (Ra=0.32 µm)
b) - Ring specimen type 2 (Ra=0.6 µm)
c) - Ring specimen type 3 (Ra=1.91 µm)
Fig. 3. Comparison between the surface micrographs of
the three types of ring specimens
Fig. 4. Die setup for ring compression tests
a) – before the test; b) – during the test; 1 – top die; 2 – ring specimen; 3 –bottom die
3. FINITE ELEMENT SIMULATION OF RING COMPRESSION TEST
The Finite Element (FE) simulation of the ring compression test was used to derivate the calibration curves. The simulation was performed using different values of friction factor: 0.1, 0.15, 0.2, 0.25, 0.3, 0.35, 0.4, 0.5 and 0.6. The ring specimen was deformed at
different reductions in height up to
∆
h = 60%.By overlapping the experimental discrete points on the calibration curves one can estimate the friction factor of each lubricant considered in this study.
The DEFORM 3D software was used for the modelling and simulation of the RCT under different friction conditions. Figure 5 shows the FE model of RCT. This model contains: the top and the bottom die and the ring specimen. The dies were modelled as rigid bodies. The ring specimen was modelled as isotropic deformable plastic material using 27979 tetrahedral elements and has similar dimensions as in experiments.
The friction at the dies/workpiece interfaces was modelled using the Tresca’s friction model
3
y
m k m σ
τ = ⋅ = ⋅ , (4)
where,
τ
is the frictional force;m – the friction factor;
k – the shear yield stress;
σ
y – the yield stress.Figure 6 shows the FE simulation deformed ring specimens in the case of 60% reduction in height and for two values of friction factor: 0.1 and 0.4.
a) b)
Fig. 5. FE simulation of the ring compression test
a) m = 0.1 b) m = 0.4
Fig. 6. FE simulation compressed rings at a reduction in
height, ∆h = 60% and two values of friction factor (m) 3. RESULTS
3.1 Evaluation of lubricants
In order to evaluate the lubrication properties of the four lubricants, the experimental discrete
points (∆h, ∆d), determined under different
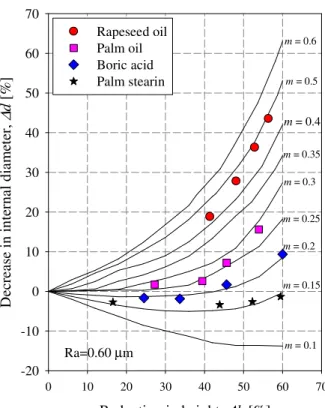
surface roughness of the workpiece, were overlapped on the calibration diagram, Figures 7-9. From these figures it is obvious that the palm stearin provides the smaller friction factor
(m) followed by the boric acid, palm oil and
rapeseed oil. In the case of Ra = 0.32 µm (Fig.
7), one can observe that to the palm stearin corresponds a friction factor of 0.15. The friction factor for the boric acid lies between 0.15 and 0.2. Friction factors of approximately 0.25 and 0.35 were obtained for the palm oil and rapeseed oil, respectively.
Reduction in height, ∆h [%]
0 10 20 30 40 50 60 70
D ec re as e in in te rn al d ia m et er , ∆ d [ % ] -20 -10 0 10 20 30 40 50 60 70 Rapeseed oil Palm oil Boric acid Palm stearin
m = 0.1
m = 0.15
m = 0.2 m = 0.25 m = 0.3
m = 0.35
m = 0.4
m = 0.5
m = 0.6
Ra=0.32 µm
Fig. 7. Friction calibration curves and experimental
results for the workpiece surface roughness of 0.32 µm
Reduction in height, ∆h [%]
0 10 20 30 40 50 60 70
D ec re as e in in te rn al d ia m et er , ∆ d [ % ] -20 -10 0 10 20 30 40 50 60 70 Rapeseed oil Palm oil Boric acid Palm stearin
m = 0.1
m = 0.15
m = 0.2
m = 0.25 m = 0.3 m = 0.35
m = 0.4 m = 0.5
m = 0.6
Ra=0.60 µm
Fig. 8. Friction calibration curves and experimental results for the workpiece surface roughness of 0.60 µm
Reduction in height, ∆h [%]
0 10 20 30 40 50 60 70
D ec re as e in in te rn al d ia m et er , ∆ d [ % ] -20 -10 0 10 20 30 40 50 60 70 Rapeseed oil Palm oil Boric acid Palm stearin
m = 0.1
m = 0.15
m = 0.2
m = 0.25
m = 0.3 m = 0.35
m = 0.4 m = 0.5
m = 0.6
Ra=1.91 µm
Fig. 9. Friction calibration curves and experimental results for the workpiece surface roughness of 0.91 µm
3.2 Effect of surface roughness on lubrication properties of lubricants
of each lubricant considered in this study, the experimental discrete points, obtained for
different values of Ra (0.32, 0.60 and 0.91 µm),
were overlapped on the calibration curves, Figures 10-13.
Reduction in height, ∆h [%]
0 10 20 30 40 50 60 70
D ec re as e i n i nt er na l d ia m et er , ∆ d [ % ] -20 -10 0 10 20 30 40 50 60 70
Ra=0.32 µm Ra=0.60 µm
Ra=1.91 µm
m = 0.1
m = 0.15 m = 0.2
m = 0.25
m = 0.3
m = 0.35 m = 0.4 m = 0.5
m = 0.6
Lubricant: rapeseed oil
Fig. 10. Friction calibration curves and experimental
discrete points in the case of rapeseed oil
Reduction in height, ∆h [%]
0 10 20 30 40 50 60 70
D ec re as e in in te rn al d ia m et er , ∆ d [ % ] -20 -10 0 10 20 30 40 50 60 70
Ra=0.32 µm
Ra=0.60 µm
Ra=1.91 µm
m = 0.1
m = 0.15
m = 0.2
m = 0.25
m = 0.3 m = 0.35
m = 0.4 m = 0.5
m = 0.6
Lubricant: palm oil
Fig. 11. Friction calibration curves and experimental
discrete points in the case of palm oil
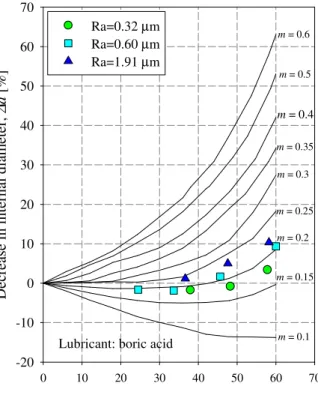
From these figures one can see that the workpiece surface roughness affects the lubrication properties of each lubricant: the increase in surface roughness implies an increasing of friction factor.
Reduction in height, ∆h [%]
0 10 20 30 40 50 60 70
D ec re as e in in te rn al d ia m et er , ∆ d [ % ] -20 -10 0 10 20 30 40 50 60 70
Ra=0.32 µm
Ra=0.60 µm
Ra=1.91 µm
m = 0.1 m = 0.15
m = 0.2
m = 0.25
m = 0.3
m = 0.35
m = 0.4 m = 0.5
m = 0.6
Lubricant: boric acid
Fig. 12. Friction calibration curves and experimental discrete points in the case of boric acid
Reduction in height, ∆h [%]
0 10 20 30 40 50 60 70
D ec re as e in in te rn al d ia m et er , ∆ d [ % ] -20 -10 0 10 20 30 40 50 60 70
Ra=0.32 µm
Ra=0.60 µm
Ra=1.91 µm
m = 0.1
m = 0.15
m = 0.2 m = 0.25
m = 0.3
m = 0.35
m = 0.4 m = 0.5
m = 0.6
Lubricant: palm stearin
Fig. 13. Friction calibration curves and experimental
In the case of rapeseed oil (Fig. 10), when the
Ra increases from 0.23 to 1.91 µm, the friction
factor increases from 0.35 to 0.5. In the case of palm oil (Fig. 11) and boric acid (Fig. 12), when
the Ra increases from 0.23 to 1.91 µm, the
friction factor increases from 0.25 to 0.3 and from approximatively 0.18 to 0.21, respectively. In the case of palm stearin (Fig. 13), the increasing in the workpiece surface roughness has little effect on the friction factor.
4. CONCLUSIONS
The aim of this study was to evaluate the lubrication properties of some environmentally friendly lubricants (rapeseed oil, palm oil, boric acid and palm stearin) under different workpiece surface roughness. The following conclusions can be drawn:
1). The palm stearin shows the best lubrication properties followed by the boric acid, palm oil and rapeseed oil.
2). The workpiece surface roughness affects the lubrication properties of each lubricant.
3). The less sensible lubricant to the change in workpiece surface roughness is the palm stearin and the most sensible is the rapeseed oil.
5. REFERENCES
[1] Zareh-Desari, B., Davoodi, B., Assessing the
lubrication performance of vegetable oil-based nano-lubricants for environmentally conscious metal forming processes, Journal
of Cleaner Production 2016, 93, pp. 38–46. [2] Syahrullail S., Kamitani, S., Nakanishi, K.,
Experimental evaluation of refined, bleached, and deodorized palm olein and palm stearin in cold extrusion of aluminum A1050, Tribology Transactions 2012, 55,
Issue 2, pp. 199-209.
[3] Rao, K.P., Xie, C.L., A comparative study on
the performance of boric acid with several conventional lubricants in metal forming processes, Tribology International 2006, 39,
Issue 7, pp. 663-668.
[4] Bucur, A., Achimaș, G., Lăzărescu, L.,
Evaluation of environmentally friendly lubricants by ring compression test,
Academic Journal of Manufacturing
Engineering 2017, 15, Issue 2, pp. 37–42.
[5] Male, A. T., Cockcroft, M. G., A method for
the determination of the coefficient of friction of metals under conditions of bulk plastic deformation, Journal of the Institute of
Metals 1965, 135, pp. 1198–1209.
Evaluarea lubrifianților biodegradabili în diferite condiții de rugozitate a piesei de prelucrat
Rezumat. În acesastă lucrare au fost evaluate proprietățile de lubrifiere a patru lubrifianți biodegradabili (ulei din semințe
de rapiță, ulei de palmier, acid boric și stearina de palmier) în trei condiții diferite de finisare a suprafeței piesei de
prelucrat. S-a folosit încercarea la compresiune a unor epruvete inelare. Pentru a estima factorul de frecare corespunzător
fiecărui lubrifiant, s-a folosit diagrama de calibrare obținută prin simularea cu elemente finite a încercării la compresiune.
Rezultatele au arătat că stearina de palmier are cele mai bune proprietăți de lubrifiere, urmată de acidul boric, uleiul de
palmier și uleiul din semințe de rapiță.
Alexandru BUCUR, Eng., PhD. Student, Technical University of Cluj-Napoca, Department of
Manufacturing Engineering, Muncii Blvd 103-105, Cluj-Napoca, Romania, e-mail: [email protected].
Gheorghe ACHIMAŞ, Prof. Dr. Eng., Technical University of Cluj-Napoca, Department of Manufacturing Engineering, Muncii Blvd 103-105, Cluj-Napoca, Romania, e-mail: [email protected].
Lucian LĂZĂRESCU, Lecturer Dr. Eng., Technical University of Cluj-Napoca, Department of
Manufacturing Engineering, Muncii Blvd 103-105, Cluj-Napoca, Romania, e-mail: [email protected].
Grigore Marian POP, Lecturer Dr. Eng., Technical University of Cluj-Napoca, Department of