PUBLIC
SAP Data Services
Document Version: 4.2 Support Package 7 (14.2.7.0) – 2016-05-06
Content
1 Introduction. . . . 7
1.1 Welcome to SAP Data Services. . . .7
Welcome. . . .7
Documentation set for SAP Data Services. . . .7
Accessing documentation from the Web. . . 9
SAP information resources. . . .9
1.2 Overview of this guide. . . 10
About this guide. . . .10
Who should read this guide. . . .11
2 Logging into the Management Console. . . . 12
2.1 Management Console navigation. . . .12
3 Administrator. . . . 14
3.1 Administrator navigation. . . 14
Status node. . . 15
Batch node. . . .16
Real-Time node. . . .17
Web Services node. . . .17
Adapter Instances node. . . .18
Server Groups node. . . 18
Profiler Repositories node. . . .18
Management node. . . 19
Job Execution History node. . . .19
Pages. . . 20
3.2 Administrator Management. . . .20
Managing database account changes. . . .20
Editing file location object information. . . 23
Configuring the report server. . . .23
Adding Access Servers. . . .24
Setting the status interval. . . .25
Exporting certification logs. . . 25
3.3 Central Repository management. . . 28
Setting up users and groups. . . 29
Viewing reports. . . .31
3.4 Server Groups. . . .32
Editing and removing a server group. . . 36
Monitoring Job Server status in a server group. . . .36
Executing jobs using server groups. . . 37
3.5 Batch Jobs. . . 37
Executing batch jobs. . . .38
Scheduling jobs. . . .38
Downloading a debug package. . . .50
Monitoring RFC trace logs. . . .51
3.6 Real-Time Jobs. . . 51
Supporting real-time jobs. . . 51
Configuring and monitoring real-time services. . . 53
Creating and monitoring client interfaces. . . 61
3.7 Real-Time Performance. . . .66
Configuring Access Server output. . . 67
Service configuration parameters. . . 69
Service statistics. . . 72
Service provider statistics. . . .73
Using statistics and service parameters. . . .74
3.8 Profile Server Management. . . 75
Defining a profiler repository. . . .76
Profiler task parameters. . . .76
Monitoring profiler tasks using the Administrator . . . .78
3.9 RFC Server Management. . . .80
64-bit platform prerequisites. . . .80
Adding an RFC server interface. . . .80
Starting or stopping an RFC server interface connection. . . .81
Monitoring RFC server interfaces. . . .82
Removing one or more RFC server interfaces. . . .83
3.10 Adapters. . . 83
3.11 Support for Web Services. . . .84
3.12 Troubleshooting the Administrator. . . .84
Reestablishing network connections. . . 85
Finding problems. . . .85
Error and trace logs. . . 86
Resolving connectivity problems. . . 91
Restarting the Access Server. . . .92
4 Metadata Reports . . . . 94
4.1 Requirements. . . .94
4.2 Repository reporting tables and views. . . .94
5.1 Navigation. . . 96
Increasing the java heap memory in Windows. . . .97
Increasing the java heap memory in UNIX. . . .97
5.2 Analysis options. . . 98
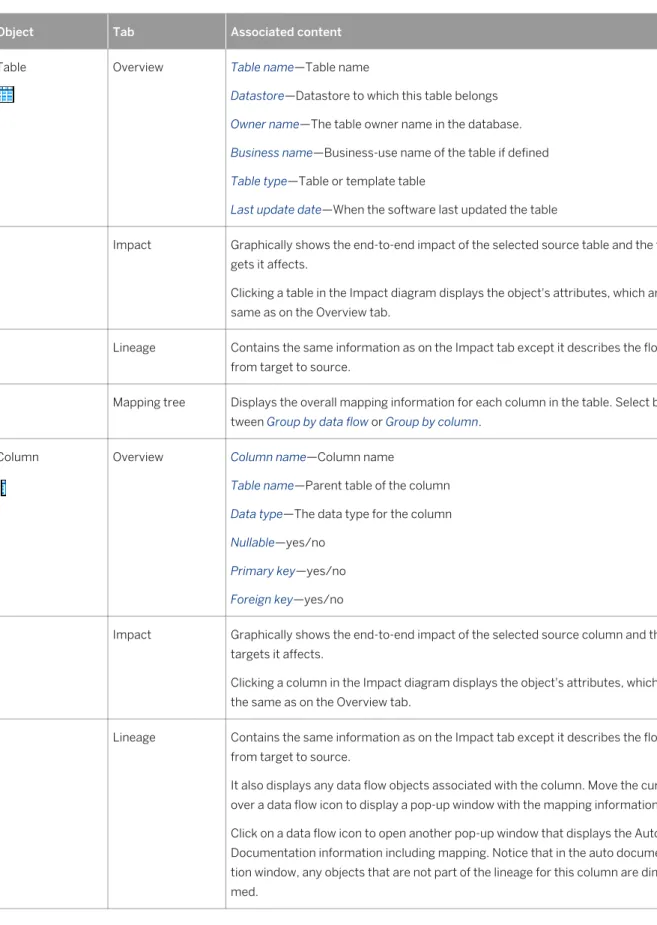
5.3 Table-level and column-level analysis. . . .101
5.4 Impact and Lineage Analysis Settings control panel. . . .101
Settings tab. . . 101
Refresh Usage Data tab. . . .101
About tab. . . .103
6 Operational Dashboard. . . .104
6.1 Dashboard home page. . . .104
Job Execution Status pie chart. . . .105
Job Execution Statistics History bar chart. . . .105
Job Execution table. . . .105
7 Data Validation Dashboard Reports. . . .107
7.1 Configuring Data Validation dashboards. . . .107
Creating functional areas. . . .107
Creating business rules. . . .108
Enabling data validation statistics collection. . . .110
7.2 Viewing Data Validation dashboards. . . .110
7.3 Functional area view. . . 111
Functional area pie chart. . . .111
History line chart. . . .112
7.4 Business rule view. . . 112
7.5 Validation rule view. . . .113
Validation rule bar chart. . . .113
History line chart. . . .114
7.6 Sample data view. . . .114
Sample data table. . . .114
History line chart. . . .114
7.7 Data Validation dashboards Settings control panel. . . 115
Repository tab. . . .115
Functional area tab. . . 115
Business rule tab. . . .115
8 Auto Documentation Reports. . . .116
8.1 Navigation. . . .116
Searching for a specific object. . . 117
Repository. . . 117
Job. . . .118
Work flow. . . .118
Data flow. . . 118
8.2 Generating documentation for an object. . . .119
Printing Auto Documentation for an object. . . .119
8.3 Auto Documentation Settings control panel. . . .120
9 Data Quality Reports. . . . 121
9.1 Configuring report generation. . . 121
9.2 Opening and viewing reports. . . .122
9.3 Lists of available reports. . . .123
9.4 List of reports by job. . . .124
9.5 Data Quality Reports Settings control panel. . . .124
9.6 Report options. . . .125
9.7 Troubleshooting reports. . . .125
9.8 USA CASS report: USPS Form 3553. . . 126
9.9 NCOALink Processing Summary Report. . . .126
9.10 Delivery Sequence Invoice report. . . .128
Contents of report. . . .129
9.11 US Addressing Report. . . 129
Enabling the report. . . .130
Percent calculation. . . .130
Information in the US Addressing report . . . .130
DPV sections. . . .131
Information in the DSF2 sections. . . .131
LACSLink sections. . . 132
SuiteLink sections. . . .132
9.12 DSF2 Augment Statistics Log File . . . .133
9.13 US Regulatory Locking Report. . . .133
9.14 Canadian SERP report: Statement of Address Accuracy. . . 135
9.15 Australian AMAS report: Address Matching Processing Summary. . . 135
9.16 New Zealand Statement of Accuracy (SOA) report. . . 136
9.17 Address Information Codes Sample report. . . .136
9.18 Address Information Code Summary report. . . .137
9.19 Address Validation Summary report. . . 138
9.20 Address Type Summary report. . . .139
9.21 Address Standardization Sample report. . . .139
9.22 Address Quality Code Summary report. . . .140
9.23 Data Cleanse Information Code Summary report. . . .141
9.24 Data Cleanse Status Code Summary report. . . .142
9.25 Geocoder Summary report. . . .142
9.27 Best Record Summary report. . . .143
9.28 Match Contribution report. . . 144
9.29 Match Criteria Summary report. . . .146
9.30 Match Duplicate Sample report. . . .147
9.31 Match Input Source Output Select report. . . .147
9.32 Match Multi-source Frequency report. . . 148
1
Introduction
1.1
Welcome to SAP Data Services
1.1.1 Welcome
SAP Data Services delivers a single enterprise-class solution for data integration, data quality, data profiling, and text data processing that allows you to integrate, transform, improve, and deliver trusted data to critical business processes. It provides one development UI, metadata repository, data connectivity layer, run-time environment, and management console—enabling IT organizations to lower total cost of ownership and accelerate time to value. With SAP Data Services, IT organizations can maximize operational efficiency with a single solution to improve data quality and gain access to heterogeneous sources and applications.
1.1.2 Documentation set for SAP Data Services
Become familiar with all the pieces of documentation that relate to your SAP Data Services product. The latest Data Services documentation can be found on the SAP Help Portal.
Table 1:
Document What this document provides
Adapter SDK Guide Information about installing, configuring, and running the Data Services Adapter SDK . Administrator Guide Information about administrative tasks such as monitoring, lifecycle management, security,
and so on. Configuration Guide for CTS
+
System landscape information and detailed steps for CTS+ configuration. Customer Issues Fixed Information about customer issues fixed in this release.
Note
In some releases, this information is displayed in the Release Notes. Designer Guide Information about how to use Data Services Designer.
Documentation Map Information about available Data Services books, languages, and locations.
Installation Guide for UNIX Information about and procedures for installing Data Services in a UNIX environment. Installation Guide for Win
dows
Information about and procedures for installing Data Services in a Windows environment. Integrator Guide Information for third-party developers to access Data Services functionality using web services
Document What this document provides
Management Console Guide Information about how to use Data Services Administrator and Data Services Metadata Reports.
Master Guide Information about the application, its components and scenarios for planning and designing your system landscape. Information about SAP Information Steward is also provided in this guide.
Performance Optimization Guide
Information about how to improve the performance of Data Services. Reference Guide Detailed reference material for Data Services Designer.
Release Notes Important information you need before installing and deploying this version of Data Services. Technical Manuals A compiled, searchable, “master” PDF of core Data Services books:
● Administrator Guide ● Configuration Guide for CTS+ ● Designer Guide
● Reference Guide
● Management Console Guide ● Performance Optimization Guide ● Integrator Guide
● Supplement for Adapters ● Supplement for Google BigQuery ● Supplement for J.D. Edwards ● Supplement for Oracle Applications ● Supplement for PeopleSoft ● Supplement for SAP ● Supplement for Siebel ● Workbench Guide Text Data Processing Extrac
tion Customization Guide
Information about building dictionaries and extraction rules to create your own extraction pat terns to use with Text Data Processing transforms.
Text Data Processing Lan guage Reference Guide
Information about the linguistic analysis and extraction processing features that the Text Data Processing component provides, as well as a reference section for each language supported. Tutorial A step-by-step introduction to using Data Services.
Upgrade Guide Information to help you upgrade from previous releases of Data Services and release-specific product behavior changes from earlier versions of Data Services to the latest release.
What's New Highlights of new key features in this SAP Data Services release. This document is not updated for support package or patch releases.
Workbench Guide Provides users with information about how to use the Workbench to migrate data and database schema information between different database systems.
In addition, you may need to refer to several Supplemental Guides.
Table 2:
Document What this document provides
Supplement for Adapters Information about how to install, configure, and use Data Services adapters. Supplement for Google BigQuery Information about interfaces between Data Services and Google BigQuery.
Document What this document provides
Supplement for J.D. Edwards Information about interfaces between Data Services and J.D. Edwards World and J.D. Edwards OneWorld.
Supplement for Oracle Applications Information about the interface between Data Services and Oracle Applications. Supplement for PeopleSoft Information about interfaces between Data Services and PeopleSoft.
Supplement for SAP Information about interfaces between Data Services, SAP Applications, and SAP Net Weaver BW.
Supplement for Siebel Information about the interface between Data Services and Siebel.
We also include these manuals for information about SAP BusinessObjects Information platform services.
Table 3:
Document What this document provides
Information platform services Administrator Guide Information for administrators who are responsible for config uring, managing, and maintaining an Information platform services installation.
Information platform services Installation Guide for UNIX Installation procedures for SAP BusinessObjects Information platform services on a UNIX environment.
Information platform services Installation Guide for Windows Installation procedures for SAP BusinessObjects Information platform services on a Windows environment.
1.1.3 Accessing documentation from the Web
You can access the complete documentation set for SAP Data Services from the SAP Business Users Support site.
To do this, go to http://help.sap.com/bods.
You can view the PDFs online or save them to your computer.
1.1.4 SAP information resources
A list of information resource links.
A global network of SAP technology experts provides customer support, education, and consulting to ensure maximum information management benefit to your business.
Table 4:
Address Content
Customer Support, Consulting, and Education services http://service.sap.com/
Information about SAP Business User Support programs, as well as links to technical articles, downloads, and online dis cussions.
Product documentation http://help.sap.com/bods/
SAP product documentation.
SAP Data Services tutorial
http://help.sap.com/businessobject/product_guides/ sbods42/en/ds_42_tutorial_en.pdf
Introduces core features, concepts and techniques to extract, transform, and load batch data from flat-file and relational da tabase sources for use in a data warehouse.
SAP Data Services Community Network http://scn.sap.com/community/data-services
Get online and timely information about SAP Data Services, including forums, tips and tricks, additional downloads, sam ples, and much more. All content is to and from the commun ity, so feel free to join in and contact us if you have a submis sion.
EIM Wiki page on SCN
http://wiki.sdn.sap.com/wiki/display/EIM/EIM+Home
The means with which to contribute content, post comments, and organize information in a hierarchical manner to so that information is easy to find.
Product Availability Matrix (PAM)
https://apps.support.sap.com/sap/support/pam
Information about supported platforms for SAP Data Services with a search function to quickly find information related to your platform.
Blueprints
http://scn.sap.com/docs/DOC-8820
Blueprints for you to download and modify to fit your needs. Each blueprint contains the necessary SAP Data Services project, jobs, data flows, file formats, sample data, template tables, and custom functions to run the data flows in your en vironment with only a few modifications.
1.2
Overview of this guide
1.2.1 About this guide
The guide includes information about the SAP Data Services Management Console, a collection of Web-based applications for administering Data Services jobs and services, viewing object relationships, evaluating job execution performance and data validity, and generating data quality reports.
You can install the Management Console on a separate computer from other Data Services components. It runs on your web application server. The Management Console is written in Java and uses a JDBC connection to repositories.
Table 5:
Application Description
Administrator Use to manage your production environment including batch job execution, real-time services, Web services, adapter instances, server groups, central and profiler reposi tories, and more.
Impact and Lineage Analysis Use to analyze the end-to-end impact and lineage for Data Services tables and col umns and SAP BusinessObjects Business Intelligence platform objects such as busi ness views and reports.
Operational Dashboard Use to view dashboards of job execution statistics to see at a glance the status and performance of your job executions for one or more repositories over a given time pe riod.
Data Validation Dashboard Use to evaluate the reliability of your target data based on the validation rules you created in your batch jobs to quickly review, assess, and identify potential inconsis tencies or errors in source data.
Auto Documentation Use to view, analyze, and print graphical representations of all objects as depicted in the Designer including their relationships, properties, and more.
Data Quality Reports Use to view and export reports for batch and real-time jobs such as job summaries and data quality transform-specific reports.
1.2.2 Who should read this guide
This and other SAP Data Services documentation assume the following:
● You are an application developer, consultant or database administrator working on data extraction, data warehousing, data integration, or data quality.
● You understand your source and target data systems, DBMS, legacy systems, business intelligence, and
messaging concepts.
● You understand your organization's data needs.
● You are familiar with SQL (Structured Query Language).
● If you are interested in using this software to design real-time processing, you are familiar with:
○ DTD and XML Schema formats for XML files
○ Publishing Web Services (WSDL, REST, HTTP/S and SOAP protocols, etc.)
2
Logging into the Management Console
When you log in to the Management Console, you must log in as a user defined in the Central Management Server (CMS). The first time you log into the Management Console, use the default user name and password (admin/ admin). It's recommended that you change the defaults thereafter by updating user roles in the Administrator.
1. Open a web browser, enter the following case-sensitive URL, and then press Enter:
http://<hostname>:28080/DataServices
where <hostname> is the name of the computer hosting the web application server.
Note
If you are logged in to the Designer, you can also access the Management Console home page in several ways.
Table 6:
From Select
Start page Data Services Management Console
Tools menu Data Services Management Console
Toolbar icon Data Services Management Console
2. Enter your user credentials for the CMS.
Table 7:
Option Description
System Specify the server name and optionally the port for the CMS. User name Specify the user name to use to log into CMS.
Password Specify the password to use to log into the CMS. Authentication Specify the authentication type used by the CMS.
3. Click Log on.
The software attempts to connect to the CMS using the specified information. When you log in successfully, the list of local repositories that are available to you is displayed.
2.1
Management Console navigation
The Management Console contains links to various applications that help you manage all aspects of SAP Data Services. Click the application name to open the application.
After you open an application, the name of that application displays under the Management Console banner at the top of the screen. There is a navigation tree along the left of the screen under the banner, that lists the option
categories (as nodes) for the application. Choose a node from the navigation tree, and the right side of the screen displays the related options. Sometimes there is more than one tab to choose from in the right side of the screen. The upper-right side of the main window for each application includes helpful links based on the application that is open. The links vary based on the application that you have open. The following table describes the links that can appear.
Table 8:
Link Description
Home Click to return to the Management Console home page where you can select another application, for example.
Settings Click to open a dialog box for changing a variety of options de pending on the selected application.
Logout Click to exit the Management Console application and Data
Services software, and display the log in page.
Question mark icon Click to open the Documentation Map, which lists the SAP Data Services technical documentation available to end users or administrators, and a link to the customer portal where you can fnd the latest versions of the documentation.
3
Administrator
This section describes the Administrator and how to navigate through its browser-based, graphical user interface. Use the Administrator to:
● Set up users and their roles
● Add connections to Access Servers and repositories
● Access job data published for Web Services
● Schedule and monitor batch jobs
● Configure and monitor:
○ Access Server status
○ Real-time services
○ Client interfaces including SAP application client interfaces (to read IDocs) and message traffic moving in and out of an Access Server
○ Adapter instances (a prerequisite for creating adapter datastores)
Additionally, you use the tools under the Promotion Management node to configure options to transport Data Services objects from one system to another. For example, to export changes from a development system to a test system. For more information about lifecycle management, including promotion management, see the
Administrator Guide. If you have a Change Transport System (CTS) installed in an SAP NetWeaver or SAP Solution Manager environment, you can use CTS+ to transport Data Services objects. For more information, see the SAP Data Services Configuration Guide for CTS+.
Related Information
Logging into the Management Console [page 12] Administrator navigation [page 14]
3.1
Administrator navigation
Set up administrative aspects of Data Services such as users, user permissions, access servers, repositories, schedules, and so on.
The navigation tree on the left side of the Administrator screen contains nodes that you can expand to make related settings. The options for each chosen node appear on the right side of the screen. The right portion of the screen may contain one or more tabs based on the node that you choose.
The navigation tree nodes contain options related to the user's permissions. Therefore not all nodes appear for all users. For example, the Profiler Repositories node only appears if the user has permission to view or manage a profiler repository. An administrator sets user permissions in the Central Management Console (CMC). Possible nodes that appear in the navigation tree are:
● Status
● Batch
● Real-Time
● Web Services
● SAP Connections
● Server Groups
● Profiler Repositories
● Management
● Job Execution History
3.1.1 Status node
Displays status indicators and detailed information about aspects of your jobs.
The Status page displays red, yellow, and green status icons that indicate the overall status of your batch and real-time jobs, associated access servers, adapter and profiler repositories jobs, services, and other related systems. You can drill down into the information for more details. The following options appear as column headings in the Status page.
Table 9:
Option Description
Batch Contains repository names that are associated with the Job Server on which you run your batch jobs. To see batch jobs status, connect the repository to the Admin istrator.
Note
The repository must be connected to the Management Console Administrator before you can view it here.
Click the repository name listed under the Batch column to display a list of batch jobs and the status for each.
Real-Time Contains Access Server names associated with the time service. To see real-time jobs status, connect the Access Server to the Administrator.
Note
The Access Server must be connected to the Management Console Administra tor before you can view it here.
Click the Access Server name listed under the Real-Time column to display a list of services and related client interfaces.
Option Description
Adapters Contains repository names associated with the Job Server on which you run the adapter.
Note
You must enable the Job Server for adapters before you can see the adapter sta tus here.
Click the repository name to display more adapter information. Profiler Contains the repository name associated with the Profiler Server.
Note
You must connect the profiling repository to the Management Console Adminis trator before you can view it here.
Click the repository name to display a list of profiler tasks and their status.
For more information about adapter and profile repositories, and about repository and server connections, see the Administrator Guide.
3.1.2 Batch node
The Batch node contains job status, job configuration, and repository schedule information.
After you add at least one repository connection to the Administrator, you can expand the Batch node and view a repository Batch Job Status page.
Click the All Repositories option to see jobs in all repositories connected to this Administrator. (The All Repositories node appears only when you have more than one repository connected).
Each repository under the Batch node includes the following tabs.
Table 10:
Tab Description
Batch Job Status View the status of the last execution and in-depth information about each job. Batch Job Configuration Configure execution and scheduling options for individual jobs.
Repository Schedules View and configure schedules for all jobs in the repository.
There is a Delete button in the Batch node that deletes the selected job as well as the history and log files. If you intend to create reports based on specific jobs, transforms, time periods, and job statistics, or if you need information to create regulatory or certified reports, you should create a local backup copy of the tables or log files before you delete.
Related Information
Batch Jobs [page 37]
3.1.3 Real-Time node
After you add a connection to an Access Server in the Administrator, you can expand the Real-Time node. Expand an Access Server name under the Real-Time node to view the options.
Table 11:
Access Server node options Description
Status View status of real-time services and client interfaces supported by this Access Server. Control, restart, and set a service provider interval for this Access Server. Real-time Services View status for services and service providers, start and stop services, add or remove
a service, configure Job Servers for a service.
Client Interfaces View status for client interfaces, start and stop interfaces, add or remove an inter face.
Logs - Current View list of current Access Server logs, content of each log, clear logs, configure con tent of logs for display, enable or disable tracing for each Access Server.
Logs - History View list of historical Access Server logs, view content of each log, delete logs.
Related Information
Real-Time Jobs [page 51]
Real-Time Performance [page 66]
3.1.4 Web Services node
Use this node to select real-time and batch jobs that you want to publish as Web service operations and to monitor the status of those operations. You can also use the node to set security for jobs published as Web service operations and view the WSDL file that SAP Data Services generates.
Related Information
3.1.5 Adapter Instances node
Use this node to configure a connection between SAP Data Services and an external application by creating an adapter instance and dependent operations. This is a prerequisite requirement for creating a datastore for adapters in the Designer.
After you create a datastore, import data through the adapter and create jobs. Then use this node to view the status of Adapter instances. Options are listed by Job Server under the Adapter Instance node.
Related Information
Adapters [page 83]
3.1.6 Server Groups node
The Server Groups node allows you to group Job Servers that are associated with the same repository into a server group.
Use a server group if you want SAP Data Services to automatically use the Job Server on a computer with the lightest load when a batch job is executed. This functionality improves load balancing (throughput) in production environments and also provides a hot backup method. When a job is launched, if a Job Server is down, another Job Server in the same group executes the job.
Related Information
Server Groups [page 32]
3.1.7 Profiler Repositories node
After you connect a profiler repository to the Administrator, you can expand the Profiler Repositories node. Click a repository name to open the Profiler Tasks Status page.
Related Information
3.1.8 Management node
The Management node contains the configuration options for the Administrator application. Before you can use some features of the Administrator, you must add connections to other SAP Data Services components using the Management node. For example, expand the management node and:
● Expand Datastore and click a repository to manage datastore configurations for that repository.
● Click Access Servers to add a connection to your Access Servers (for real-time jobs).
Related Information
Administrator Management [page 20]
3.1.9 Job Execution History node
Contains execution history for a job or data flow.
When you expand the Job Execution History node, The following information may be available as applicable:
Table 12:
Tab Description
Job Execution History You can view execution history for a single batch job or for all batch jobs. You can refine the history by selecting to view reports that were generated be tween a specific start and end date.
The information for the selected batch job appears in a table. This table dis plays the repository name, job name, the start and end time of the job execu tion, the execution time (elapsed), the status, and whether the job is associ ated with a system configuration.
● Under the Job information column, click the Trace, Monitor, or Error link to open the Log Viewer page, which displays the logs associated with the job. Click the other tabs in the Log Viewer page to view the other types of logs.
● Click the Performance Monitor link under the Job information column to open the Performance Monitor page.
Tab Description
Data Flow Execution History This page includes three options for customizing the display:
● Data Flow: Enter a data flow name for which to search and click Search. ● Job Name: Select all jobs or an individual job.
● View history for x days: Select over how many days you want to view the history
Related information appears in a table. This table displays the repository name, data flow name, job name, the start and end time of the data flow exe cution, the execution time (elapsed), and the number of rows extracted and loaded.
3.1.10 Pages
Each node that you expand on the left opens a page on the right that displays information relating to the node that you have selected.
The top of the page indicates the currently selected node. If applicable, a page contains tabs that you can use to navigate further into the node. For example, the Batch node page contains the tabs: Batch Job Status, Batch Job Configuration, and Repository Schedules.
The tabs names appear on light blue tabs. A dark blue (shaded) tab signifies the active page. Click a light blue tab to go to that page. Some pages do not include tabs.
As you drill into various pages, a “bread crumb” trail often indicates where you are in the Administrator application. In some pages, you can click on the bread crumb links to navigate to a different page.
3.2 Administrator Management
Use the Management features to configure the Administrator.
3.2.1 Managing database account changes
SAP Data Services uses several types of user accounts and associated passwords. For various reasons, database account parameters such as user names or passwords change. For example, perhaps your company's
3.2.1.1
Updating local repository login parameters
If the login information, particularly the password, for a repository has changed, SAP Data Services provides an optional password file that all schedules or exported execution commands use. In other words, the software uses this password file to store and update connection information in one location that multiple schedules or exported execution commands share for that repository.
Note
This description does not apply to central repositories. The password file:
● Specifies the connection information for the repository.
● Can be stored in a central location for access by others who run jobs in that repository.
● Is created when you create or update a job schedule to minimize associated maintenance.
Related Information
Using a third-party scheduler [page 45]
3.2.1.1.1
Updating the CMS connection information and use
a password file
1. Expand the Management node. 2. Click CMS Connection.
3. Edit the connection information as necessary. 4. Click Apply.
5. Click Generate password file to create or update the password file.
The default name and location of the file are <DS_COMMON_DIR>\conf\repositoryname.txt.
3.2.1.1.2
Updating job schedules
When database account information for your repository changes, the SAP Data Services job schedules associated with that account must also be updated. When you use a password file, the job schedules access it at runtime to automatically retrieve the updated account information.
Related Information
Scheduling jobs [page 38]
3.2.1.2
Updating datastore connection parameters
If the information associated with a datastore connection changes, particularly passwords, you can update the changes using the Administrator.
Note
Only users with Administrator role privileges can edit datastore parameters.
3.2.1.2.1
Editing the connection information for an individual
configuration in a datastore
1. Select Management Datastore , and select the repository that contains the datastore configuration that
you want to edit.
2. Click the configuration name to configure. 3. Edit the enabled fields as necessary.
4. Click Apply. To return all fields to the last set of values applied, click Reset.
3.2.1.2.2
Editing the connection information for multiple
configurations in a datastore
1. Select Management Datastore , and select the repository that contains the datastore configurations
that you want to edit.
2. Click the datastore name to configure. All configurations for that datastore display. 3. Edit the enabled fields as necessary.
Click More to display the page for that individual configuration, which includes more options specific to it. 4. Click Apply. To return all fields to the last set of values applied, click Reset.
3.2.2 Editing file location object information
Edit a file location object configuration to change current settings like host, port, user, password, remote and local directories.
1. Select Management File Locations .
2. Select the repository that contains the file location object configuration to edit. 3. Click the File location and configuration name to edit.
4. Edit the enabled fields as necessary.
Note
You cannot change the Name, Type, or Protocol options. 5. Click Apply.
3.2.3 Configuring the report server
For each repository registered in the Central Management Console (CMC), a report server configuration is automatically created with default parameters. The Report Server Configuration node in the Management Console Administrator lets you edit the default parameters, including the location where job reports are written upon execution.
1. Select Management Report Server Configuration <repository> .
The Report Server Configuration page opens and displays the report export configuration parameters. If the configuration has not yet been saved for the selected repository, the page displays default parameters. 2. Enter the appropriate configuration information.
Table 13:
Option Description
Host name The name of the machine that the report server is running on. By default, the current web application server name is used. Localhost is not a valid name.
Communication port The port number of the machine that the report server is running on.
Export location The path where the reports will be exported to. The default path is <DS_COMMON_DIR>
\DataQuality\reports\. Upon execution, the repository name and job name fold ers are appended to the path. If the Overwrite option is not selected, a run ID folder is also appended to the path.
Note
If you export reports to a location other than a local drive, such as a network drive, be fore you execute the job you must start the web application server with an account that has access rights to that location.
Option Description
Overwrite Specifies whether existing reports will be overwritten when the reports are exported. If this option is not selected, the reports are exported to a subfolder with the run ID, which speci fies a unique identification of an instance of the executed job.
Language The supported language that the reports are generated in. Note that some reports, such as country-specific certification reports, are designed only to support English, so changing the option for those reports has no effect.
3. Click Apply to save the configuration. To return all fields to the last set of values applied, clicking Reset. 4. Verify that the security setting for this operation is disabled. Select Administrator Web Services and
click the Web Services Configuration tab. If the Export_DQReport operation is enabled (displays a check in the Session Security column), select the checkbox next to it, select Disable Session Security from the pull-down menu, and click the Apply button.
To generate and export all of the job reports to the specified location at runtime, select the Export Data Quality Reports option when you execute the job.
Related Information
Adding a job schedule [page 39]
3.2.4 Adding Access Servers
The Administrator acts as a front end for Access Servers connected to it. Use the Administrator to:
● Configure real-time jobs as real-time services.
● Configure real-time services with service providers.
● Monitor Access Servers, real-time services, and service providers.
You first must connect an Access Server to the Administrator so that you can use the Administrator to create a real-time service from a real-time job. After a service starts, the Access Server brokers messages between external applications and SAP Data Services.
When a message request comes in, the Access Server communicates with the Job Server to get the repository data needed to run a real-time service and process the message. A reply comes back through the Access Server to the message originator and the Access Server log records the event, which you can monitor from the
Administrator.
Use the Access Servers page to connect an Administrator to a repository.
1. Select Management Access Servers .
2. Click Add.
Table 14:
Option Description
Machine Name Host name of the computer on which the Access Server is installed. Communication Port Port assigned to the Access Server in the Server Manager utility.
4. (Optional) Before attempting to register the Access Server with the Administrator, click Ping to see if the Access Server is available and exists on the computer and port you specified.
5. Click Apply.
The Administrator registers the Access Server, validates the Access Server connection information, and displays the information on the Access Servers page.
To view a list of Access Servers connected to the Administrator, select Management Access Servers .
The Access Servers page lists the Access Servers that are connected to the Administrator. You can also remove a connection to an Access Server from this page.
3.2.5 Setting the status interval
Use the Status Interval page to specify the time period for which the Administrator displays the status (using the red, yellow, and green status icons) on the Batch Job Status page and the Real-Time History page.
1. Select Management Status Interval .
2. On the Status Interval page, specify the time period.
You can filter the information for Batch and Real-time jobs in the following ways:
○ By the last execution of each job
○ By number of days
Note
The default for Real-Time Display is 5 days.
○ By range of dates
3. Click Apply.
The Administrator updates the list of job executions and the status interval displays on the Batch Job Status page and the Real-Time History page.
3.2.6 Exporting certification logs
When you run address cleanse jobs with the appropriate options set, you can generate reports to qualify for mailing discounts with certain countries' postal authorities. In the Management Console, you can generate the certification log files required for those certifications.
Related Information
Exporting NCOALink certification logs [page 26] Exporting New Zealand SOA certification logs [page 27] Exporting DSF2 certification log [page 27]
3.2.6.1
Exporting NCOALink certification logs
Before you export the certification log, you must have run a job containing a USA Regulatory Address Cleanse transform with the NCOA certification options set appropriately. You must also configure your repository in the Central Management Console (CMC).
You can export the certification log for the data in one repository or in all repositories.
Caution
If you select all repositories and have more than one connection to the same repository, your results may contain duplicate records.
1. Select Management Certification Logs , and select the repository that contains the certification log that
you want to export. 2. Click the NCOALink tab.
3. Select the date range that contains the data that you want to export. 4.
5. Specify the location where the certification logs will be exported. Select the NCOALink licensee ID for the logs that you want to export, or select All NCOA Licensee IDs.
Note
The location that you specify is relative to the web application server.
To reset the export location to the default, click the Reset button. The default location is <DS_COMMON_DIR>
\DataQuality\certifications\CertificationLogs\<repository>\. 6. If you want to overwrite an existing log file, click the Overwrite option.
7. Click the Search button. The page displays the available log files with the specified criteria. You can sort the log files using the column headers.
The Data Available column has a Yes status when there is data for at least one of the log types (PAF, Bala, or CSL). A No status indicates that no data is available and will result in an empty log file for each type.
8. Select the log file(s) that you want to export or select the checkbox next to Select All. 9. Click the Export button.
Related Information
NCOALink Processing Summary Report [page 126]
3.2.6.2 Exporting New Zealand SOA certification logs
Before you export the certification log, you must have run a job containing a Global Address Cleanse transform with the New Zealand SOA certification options set appropriately. You must also configure your repository in the CMC.
You can export the certification log for the data in one repository or in all repositories.
Caution
If you select all repositories and have more than one connection to the same repository, your results may contain duplicate records.
1. Select Management Certification Logs , and select the repository that contains the certification log that
you want to export.
2. Click the New Zealand SOA tab.
3. Select whether you want to export all certification log data that is in the selected repository or just the data within a specified date range.
The Year list contains the current year and the two previous years, because certification logs are required to be retained for two years.
4. Specify the location where the certification logs will be exported.
The default location is <DS_COMMON_DIR>\DataQuality\certifications\CertificationLogs
\<repository>\. To reset the export location to the default, click the Reset button. 5. If you want to overwrite an existing log file, click the Overwrite option.
6. Click the Export button.
After the log file is exported, a confirmation message is displayed at the top of the page.
Related Information
New Zealand Statement of Accuracy (SOA) report [page 136]
3.2.6.3 Exporting DSF2 certification log
Before you export the certification log, you must have run a job containing a USA Regulatory Address Cleanse transform with the DSF2 certification options set appropriately. You must also configure your repository in the Central Management Console (CMC).
Caution
If you select all repositories and have more than one connection to the same repository, your results may contain duplicate records.
1. Open the Data Services Management Console. 2. Click the Administrator icon.
3. Select Management Certification Logs , and select the repository that contains the certification log that
you want to export. 4. Click the DSF2 tab.
5. Select the date range that contains the data that you want to export.
6. Select the DSF2 licensee ID drop list and select the logs that you want to export, or select All DSF2 Licensee IDs.
7. Specify the location where the certification logs will be exported.
Note
The location that you specify is relative to the web application server.
To reset the export location to the default, click the Reset button. The default location is <DS_COMMON_DIR>
\DataQuality\certifications\CertificationLogs\<repository>\. 8. If you want to overwrite an existing log file, click the Overwrite option.
9. Click the Search button. The page displays the available log files with the specified criteria. You can sort the log files using the column headers.
The Data Available column has a Yes status when there is data for the log file. A No status indicates that no data is available and will result in an empty log file.
10. Select the log file(s) that you want to export or select the checkbox next to Select All. 11. Click the Export button.
After the log file is exported, a confirmation message is displayed at the top of the page.
Related Information
US Addressing Report [page 129]
3.3 Central Repository management
This section describes how to manage your secure central repositories using the Administrator.
When you log into the Management Console as a user with the appropriate rights, the name of each secure central repository appears under the Central Repositories node. Links under this node include:
● Users and groups
● Reports
Use to generate reports for central repository objects such as viewing the change history of an object.
Note
Before you can manage a secure central repository, it must be registered in the Central Management Console (CMC) and have appropriate user access applied.
3.3.1 Setting up users and groups
The general process for setting up secure central repository users and groups is as follows: 1. Register the secure central repository in the Central Management Console (CMC). 2. Add central repository groups.
3. Associate users with groups.
The following sections describe these procedures.
3.3.1.1
Adding a group to a central repository
Groups are specific to a secure central repository and are not visible in any other local or central repository. 1. Expand the Central Repositories node in the navigation tree and expand the repository to configure. 2. Click Users and Groups.
The Groups and Users page displays. 3. On the Groups tab, click Add. 4. Type a Name for the group.
5. Optionally, type a Description for the group. 6. Click Apply.
The group appears on the Groups tab.
3.3.1.2
Adding users
1. Expand the Central Repositories node in the navigation tree and expand the repository to configure. 2. Click Users and Groups.
The Groups and Users page displays. 3. Click the Users tab.
4. Click Add.
Table 15:
Option Description
User name Select the user to add to the group.
Note
The list of available users includes all users defined in the Central Management Console (CMC).
Default group The default central repository group to which the user belongs. You can change the default by selecting another from the drop-down list. Status Select a value from the drop-down list:
○ Active
Enables the user's account for normal activities. ○ Suspended
Select to disable the login for that user. Description Optionally, type a description for the user.
The User is a member of list on the left shows the groups to which this user belongs. 5. Click Apply.
Clicking Reset returns all fields to the last set of values applied.
3.3.1.3
Adding or removing a user from a group
1. Expand the Central Repositories node in the navigation tree and expand the repository to configure. 2. Click Users and Groups.
3. Click the Group tab. 4. Click the group name.
5. The Members list on the left shows the users in this group.
To add users to a group, click the user names from the Not Members list and click Add Users. Select multiple user names using the Ctrl or Shift keys.
To remove a user from the group, select a user name from the Members list and click Remove Users. Select multiple user names using the Ctrl or Shift keys.
6. Click Apply.
Clicking Reset returns all fields to the last set of values applied.
Alternately, click the Users tab, click the user name, and associate the user with one or more groups by selecting group names and adding or removing them.
3.3.1.4
Deleting a group
1. Expand the Central Repositories node in the navigation tree, expand the repository to configure, and click Users and Groups.
2. Click the Group tab.
3. Select the check box for the group. 4. Click Remove.
Note
You cannot delete a group in the following instances:
● It is the default group for any user (whether or not they are active).
● It is the only group with full permissions for an object.
● A member of the group is undertaking any central repository tasks using the Designer.
3.3.2 Viewing reports
You can generate reports about objects in a central repository such as which objects a user currently has checked out or the changes made to an object over a specified time frame.
Expand the central repository to view and expand the Reports link.
Related Information
Object state report [page 31] Change report [page 32]
3.3.2.1
Object state report
Use the object state report to view details on one or more objects such as whether the objects are checked out and by whom.
Click the Object State Report link to display a search page with the following criteria (all fields are optional):
Table 16:
Option Description
Object name Type an object name. You can use the % symbol as a wildcard. Object type For example select Batch job, Table, or Stored procedure.
Option Description
User Select a central repository user name.
Click Search to generate the report. The report has the following columns:
● Object name
● Object type
● State
● User name—The user account associated with the check-out or check-in.
● Associated repository—The repository to which the object belongs.
● Time—Check-out or check-in date and time.
● Comments—Comments added when user checked out or checked in the object.
Click the object name to display the object's history.
3.3.2.2 Change report
Use the change report to view the change history for an object over a specified period of time. Click the Change Report link to display a search page with the following criteria:
● Start date—Enter a date or click the calendar icon to select a start date.
● End date—Enter a date or click the calendar icon to select an end date.
● Object type—Optionally select an object type; for example batch job, table, or stored procedure.
● State—Optionally select an object state; for example Checked out.
● User—Optionally select a central repository user name.
Click Search to generate the report. The report has the following columns:
● Object name
● Object type
● State
● Version—The version number of the object.
● User name—The user account associated with the check-out or check-in.
● Associated repository—The repository to which the object belongs.
● Time—Check-out or check-in date and time.
● Comments—Comments added when user checked out or checked in the object.
3.4 Server Groups
Use the Administrator to create and maintain server groups. This section describes how to work with server groups.
3.4.1 Server group architecture
You can group Job Servers on different computers into a logical SAP Data Services component called a server group. A server group automatically measures resource availability on each Job Server in the group and distributes scheduled batch jobs to the Job Server with the lightest load at runtime.
There are two rules for creating server groups:
● All the Job Servers in an individual server group must be associated with the same repository, which must be defined as a default repository. The Job Servers in the server group must also have:
○ Identical SAP Data Services versions
○ Identical database server versions
○ Identical locale
● Each computer can only contribute one Job Server to a server group.
The requirement that all Job Servers in a server group be associated with the same repository simply allows you to more easily track which jobs are associated with a server group. It is recommended that you use a naming convention for server groups that includes the name of the repository. For example, for a repository called DEV, a server group might be called SG_DEV.
On startup, all Job Servers check the repository to find out if they must start as part of a server group. Compared to normal Job Servers, Job Servers in a server group each:
● Collect a list of other Job Servers in their server group
● Collect system load statistics every 60 seconds:
○ Number of CPUs (on startup only)
○ Average CPU load
○ Available virtual memory
● Service requests for system load statistics
3.4.1.1
Load balance index
All Job Servers in a server group collect and consolidate system load statistics and convert them into a load balance index value for each Job Server. A Job Server's load balance index value allows the software to normalize statistics taken from different platforms. The Job Server with the lowest index value is selected to execute the current job. The software polls all Job Server computers every 60 seconds to refresh the load balance index.
3.4.1.2
Job execution
After you create a server group, you can select a server group to execute a job from the Designer's Execution Properties window or from the Execute Batch Job, Schedule Batch Job, and Export Batch Job pages in the Administrator.
When you execute a job using a server group, the server group executes the job on the Job Server in the group that is running on the computer that has the lightest load. The Administrator will also resynchronize a Job Server with its repository if there are changes made to the server group configuration settings.
You can execute parts of your job on different Job Servers in a server group. You can select the following distribution levels from the Designer's Execution Properties window or from the Execute Batch Job, Schedule Batch Job, and Export Execution Command pages in the Administrator:
● Job level
A job can execute on an available Job Server.
● Data flow level
Each data flow within a job can execute on an available Job Server.
● Sub data flow level
A resource-intensive operation (such as a sort, table comparison, or table lookup) within a data flow can execute on an available Job Server.
3.4.1.3
Job launcher
The Job Launcher, exported as part of a job's execution commands, includes a specific command line option for server groups. You can use this option to change the Job Servers in a server group.
Related Information
3.4.1.4 Working with server groups and Designer options
Some Designer options assume paths are relative to a Job Server. If your Job Servers are on different machines from your Designer (typically the case in a production environment) you must ensure that connections and directory paths point to the Job Server host that will run the job. Such options include:
● Source and target directories for files
● Bulk load directories
● Source and target connection strings to databases
● Path to repositories
When using server groups consider the additional layer of complexity for connections. For example, if you have three Job Servers in a server group:
● Use the same directory structure across your three host computers for source and target file operations and use relative paths for file names.
● Use the same connection strings to your databases for all three Job Server hosts.
If you use job distribution levels, the Job Servers in the server group must have:
● Identical SAP Data Services versions
● Identical database server versions
● Identical locale
● Identical operating systems
Thoroughly test the Job Server job options when working with server groups. Adding a server group:
● In the Administrator, use the Server Groups node to create and add a server group.
3.4.1.4.1
Adding a server group
1. Select Server Groups All Server Groups .
2. Click the Server Group Configuration tab. 3. Click Add.
4. Follow the instructions on the Add Server Group page to create a server group.
○ When you select a repository, all Job Servers registered with that repository display. You can create one server group per repository.
○ Notice that the Administrator provides a default server group name. It is the name of your repository with the prefix SG_ (for server group). You can change the default name, however, labeling a server group with the repository name is recommended.
○ One Job Server on a computer can be added to a server group. Use the Host and Port column to verify
that the Job Servers you select are each installed on a different host. 5. After you select the Job Servers for a server group, click Apply.
Related Information
Monitoring Job Server status in a server group [page 36]
3.4.2 Editing and removing a server group
You can select a new set of Job Servers for an existing server group or remove a server group.
Trace messages are written for a change in Job Server status when you create, edit, or remove server groups.
● When a Job Server is upgraded to membership in a server group, the trace message is:
Collecting system load statistics, maintaining list of Job Server(s) for this server group, and accepting Job Server execution requests.
● When a Job Server is downgraded out of a server group, the trace message is:
Deleting current system load statistics, and not collecting more. Not accepting job execution requests from a server group.
3.4.2.1
Editing a server group
1. Select a server group from the navigation pane on the left.
2. In the Server Groups page, click the Server Group Configuration tab. 3. Select a new set of Job Servers.
4. Click Apply.
Your edited server group is saved and the display returns to the Server Groups Configuration tab.
3.4.2.2 Removing a server group
1. In the Server Groups page, click the Server Group Configuration tab. 2. Select the check box for the server group(s) that you want to remove. 3. Click Remove.
Note
If you delete Job Servers from a repository in order to delete all the Job Servers in a server group, the Administrator displays an invalid status for the server group.
3.4.3 Monitoring Job Server status in a server group
● To monitor the status of these Job Servers, select Server Groups All Server Groups .
The Server Group Status page opens. All existing server groups are displayed with the Job Servers they contain.
Table 17:
Indicator Description
A green icon indicates that a Job Server is running. A yellow icon indicates that a Job Server is not running.
A red icon indicates that the Job Server cannot connect to the repository.
If a server group contains Job Servers with a mix of green, yellow, or red indicators, then its indicator appears yellow:
Otherwise, a server group indicator displays the same color indicator as its Job Servers.
● To view the status for a single server group, select its name.
3.4.4 Executing jobs using server groups
After you create a server group, you can select a server group to execute a job from the Designer's Execution Properties window or from the Execute Batch Job and Schedule Batch Job pages in the Administrator.
Related Information
Batch Jobs [page 37]
3.5 Batch Jobs
This section describes how to execute, schedule, and monitor batch jobs from the Administrator. Before you can manage batch jobs with the Administrator, add repository connections.
You can control some of the behavior in the Batch Job Status tab by making settings in the Central Management Console (CMC). For example, set the number of days to retain the job execution history or the Job Server log. Or set the number of seconds from the job start time that the Managemet Console displays an accurate job status for jobs that crash mid-execution.
For complete descriptions of these options, see the Server Management section of the Administrator Guide, or search for History Retention Period, Job Server Log Retention Period, or Job History Cleanup Period.
3.5.1 Executing batch jobs
You can execute batch jobs from the Administrator if their repositories are registered in the Central Management Console (CMC) and your user has the appropriate rights.
1. Select Batch <repository> .
The Administrator opens the Batch Job Status page, which lists all of the jobs in the selected repository. To view jobs in all repositories from this page, select Batch All Repositories . (The All Repositories option appears under the Batch Job node if more than one repository is connected to the Administrator.) 2. Click the Batch Job Configuration tab.
3. To the right of the job you want to run, click Execute. The Administrator opens the Execute Batch Job page.
4. Under Enter Execution Options, set the parameters for the execution of this job. 5. Under Select Trace Options, set the trace properties for this execution of the job. 6. To create a debug package, select the Debug Package option.
You can download the package from the Batch Job Status page. 7. Click Execute to run the job.
The Administrator returns to the Batch Job Status page.
3.5.2 Scheduling jobs
There are three ways to manage job schedules.
Related Information
Using the job scheduler [page 38]
Scheduling jobs in SAP BusinessObjects Business Intelligence platform [page 43] Using a third-party scheduler [page 45]
3.5.2.1
Using the job scheduler
When you schedule batch jobs using the SAP Data Services job scheduler, it creates an entry in the operating system's scheduling utility on the Job Server computer. Windows uses the Task Scheduler and UNIX systems use the CRON utility. (Note that if you make changes to a schedule directly through these utilities, the job scheduler will not reflect those changes.)
3.5.2.1.1
Adding a job schedule
1. Select Batch <repository> .
2. Click the Batch Job Configuration tab. 3. For the job to configure, click Add Schedule.
4. On the Schedule Batch Job page, enter the desired options:
Table 18:
Option Description
Enter a job schedule
Schedule name Enter a unique name that describes this schedule.
Note
You cannot rename a schedule after you create it.
Active Select this box to enable (activate) this schedule, then click Apply. This op tion allows you to create several schedules for a job and then activate the one(s) you want to run.
Select a scheduler
Data Services scheduler Creates the schedule on the Job Server computer.
BOE scheduler Creates the schedule on the selected Central Management Server (CMS). Select scheduled day(s) for executing the job
Calendar From the drop-down list on the calendar, select:
○ Day of Week to schedule the job by the day of the week. You can select one or more days. Click again to deselect.
○ Day of Month to schedule the job by date. You can select one or more dates. Click again to deselect.
If Recurring is selected, then the Administrator schedules this job to repeat every week or month on the selected day. Note that if you select multiple days of the week or month, the job will run on a recurring basis by default. Select scheduled time for executing the jobs
Once a day Enter the time for the scheduler to start the job (hours, minutes, and either AM or PM).
Multiple times a day ○ For the Data Services scheduler, enter the time (hours, minutes, and either AM or PM) for the scheduler to repeatedly run the job for the se lected duration (in minutes) at the selected interval (in minutes). ○ For the BOE scheduler, enter (in minutes) the repeat interval to run
the job. You must also select all days in the calendar (for weekly or monthly).
Select a time when all of the required resources are available. Typically, you want to schedule jobs to ensure they finish before the target database or data warehouse must be available to meet increased demand.
![Crystal structure of poly[[μ3 4,4′ (4,4′ bipyridine 2,6 diyl)dibenzoato]{μ2 4 [6 (4 carboxyphenyl) 4,4′ bipyridin 4′ ium 2 yl]benzoato}manganese(II)] hemihydrate]](data:image/gif;base64,R0lGODlhAQABAIAAAP///wAAACH5BAEAAAAALAAAAAABAAEAAAICRAEAOw==)