APPLICATION OF WOOD SAWDUST MODIFIED WITH
CATIONIC SURFACTANTS FOR EFFICIENT REMOVAL OF
ACIDIC DYES FROM AQUEOUS SOLUTIONS: KINETIC AND
THERMODYNAMIC STUDIES
Reza Ansari
[a]*and Babak Seyghali
[a]Keywords: Removal,acidic dyes, modified sawdust, cationic surfactant, isotherm, kinetic, thermodynamic
In this paper, application of sawdust prepared from Narra wood (SD) modified with cationic surfactant of cetyltrimethylammonium bromide (SD/CTAB) was used for removal of two typical acid dyes commercially named as Acid Green 25 (AG25) and Acid Red 14 (AR14) from aqueous solutions. The effects of experimental variables, such as pH, initial dye concentration, adsorbent dose, contact time and temperature were investigated in order to find out the optimized conditions for removal of selected test dyes. Langmuir and Freundlich Isotherms were used to analyse the experimental adsorption data. Pseudo- first and second order models suggested by Lagergren, Ho & McKay were used for kinetic study. Thevan 't Hoff equation employed for obtaining of thermodynamic parameters. It was found that upon simple treatment of sawdust with a cationic surfactant, the adsorption capacity of sawdust for uptake of anionic dyes is improved considerably. The monolayer maximum adsorption capacity of SD/CTAB toward AG25 and AR14 dyes calculated using Langmuir isotherm model was 17.5 and 18.9 mg g−1 at 298 K, respectively. Based on kinetics and thermodynamic studies, it was found that adsorption process using SD/CTAB follows pseudo second-order rate equation and the adsorption investigated system is spontaneous and endothermic in nature. Exhausted adsorbent can also be regenerated for reuse with high performance. It was found that via simple treatment of agricultural wastes such as wood sawdust with cationic surfactants it is possible to improve the sorption capacity of sawdust for removal of anionic dyes from aqueous wastes considerably.
Corresponding Authors
E-Mail: [email protected]; [email protected] Tel: +98-1313243630-4 (Ext. 226)
Fax: +98-131-3233262
[a] Chemistry Department, Faculty of Science, University of Guilan, Rasht, Iran, POB: 41635-1914
Introduction
Dyes have been widely used in textile, paper, rubber, plastics, leather, cosmetic, pharmaceutical, and food industries, which generated huge volume of wastewater every year. The disposal of dye wastewater without proper treatment is a big challenge and has caused harms to the aquatic environment, such as reducing light penetration and photosynthesis.1,2 Due to the complex molecular structure,
dyes are usually very difficult to be biodegraded, making them hardly eliminated under natural aquatic environment [3].
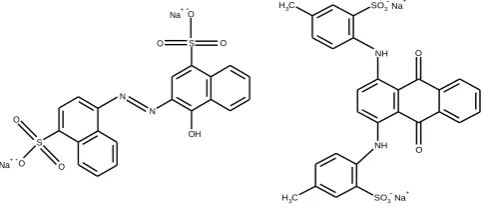
Acid dyes are anionic compounds mainly used for dyeing nitrogen-containing fabrics like wool, polyamide, modified acryl and silk. Acid Green 25 (1,4-di-[(2-sulfono-4-methylphenyl) amino]-9,10-anthracenedione, disodium salt) (Fig. 1a) in particular belongs to the commercial acid dye often used in textile, hair dye formulation and cosmetic product.4 Acid Red 14
(4-hydroxy-3-(4-sulfonato-1-naphthylazo)-1-naphthalenesulfonate disodium salt) (Fig. 1b) is a synthetic azo class of dye, imparting red color to foods. Being a typical azo dye the effluent containing AR14 dye is also difficult to treat in environmental systems due to the sulfonic group, which makes it polar and soluble in water. For many years it was used as coloring material for edibles like jams and preservatives; however, most of the developed countries finally prohibited its use in edibles due to the presence of β-naphthylamine, a well-known
carcinogen in it. These dyes also cause asthma or drug intolerance, including nettle rash and water retention to many people.5,6 So its removal from wastewaters before its
discharge in the environment seems to be very essential.
Figure. 1.Molecular structure of (a) AG25 and (b) AR14 dyes.
Several physical, chemical and biological treatment methods (e.g. adsorption, coagulation-flocculation, biodegradation, ion-exchange, chemical oxidation, ozonation, reverse osmosis, membrane filtration and electrochemical methods) have been applied to remove dye molecules from such effluent. However, these processes vary in their effectiveness, cost and environmental impact.7-9
Adsorption has been found to be one of the promising techniques for dye wastewater treatment because of its simplicity, high efficiency, and wide-ranging availability. Different types of dye molecules can be removed very effectively by adsorption techniques and this process also removes the complete dye molecule, leaving no fragments in the wastewater. 10-13 In some recent publications, different
low-cost adsorbents such as chitosan, seashells, soy meal hull, palm ash and chemically modified sawdust have been used for various dyes removal from aqueous solutions.14-22
However, these adsorbents do not have good adsorption NH
NH C
H3 SO3
C
H3 SO3
-Na+
Na+ O
O OH
S
N O
O O
N
S O O
O Na+
Na+
-capacities toward acid dye due to their negatively charged functional groups on their surfaces.22 Therefore, to improve
the adsorption capacity of these adsorbents, surface modification such as cationic surfactant treatment seems to be effective. Detergents or surface-active agents are organic molecules that, when dissolved in a solvent at low concentration, have the ability to adsorb (or locate) at interfaces, thereby altering significantly the physical properties of those interfaces. This adsorption behavior can be attributed to the solvent nature and to a chemical structure for surfactants that combine both a polar and a non-polar (amphiphilic) groups into a single molecule. It has been reported that the cationic surfactants mostly quaternary ammonium salts such as hexadecyltrimethylammonium (HDTMA) or cetyltrimethylammonium bromide (CTAB) provide potential positively charged active sites for efficient removal of anionic contaminants from aqueous solutions.23
The same improvement in cationic dye removal was observed when sawdust modified with anionic surfactant of SDS.19
In this work, the removal of two acid dyes (AG25 and AR14) from aqueous solutions was investigated using cetyltrimethylammonium bromide modified sawdust (SD/CTAB) and adsorption capacity compared with untreated sawdust (SD). The study includes an evaluation of the effects of various operational parameters such as initial dye concentration, adsorbent dose, contact time, temperature and pH on the dye adsorption process. The adsorption kinetic models, equilibrium isotherm models, thermodynamic parameters and regeneration study related with the process were also performed and are reported.
Experimental and Measurements
Materials and methods
All chemicals used were analytical reagent grades and used without further purification. All experiments were carried out in aqueous solutions prepared with distilled water. Sawdust samples (SD) from Nara wood were obtained from a local carpentry workshop (North of Iran). AG25 (C28H22N2O8S2 .2Na MW=622.59 g mol-1), Acid red
14 dye (C32H22N6O6S2. 2Na, MW=696.66 g mol-1) and
cetyltrimethylammonium bromide (C19H42NBrMW=364.46
g mol-1) were purchased from Merck chemical company.
Solutions with concentration of 200 mg L-1 for both dyes
were prepared in distilled water as stock solution and the other working solutions were prepared by diluting the stock solution with distilled water to the needed concentration. AG25 and AR14 show intense absorption peaks in the visible region at 605 nm and 500 nm, respectively. A single beam Perkin-Elmer UV-Vis spectrophotometer with a glass cell (b=1.0 cm) was used for measuring all the absorption data at the maximum wavelength of each dye. A calibration curve based on Lambert-Beer law (A=bc) obtained for each dye was used for quantitative analysis of the unadsorbed dye. The pH adjustments were carried out using dilute NaOH and HCl solutions (0.10 M). A pH meter (Metrohm, model 827) with a combined double junction glass electrode was used for pH measurements.
Preparation of sawdust modified by cetyltrimethyl-ammonium bromide (SD/CTAB)
Sawdust was first washed with distilled water in order to remove any dust or impurities and then dried at temperature of about 60 oC for 5 h in an air circulating oven. In order to
have uniform modification and reproducible results, sawdust particles sieved pass through a 35-50 mesh (317-508 μm) screen before surfactant treatment. 35 g of sawdust was weighed and mixed with 500 mL of CTAB solution having a concentration of 4.0 g L-1. The mixture was shaken for 5 h
at room temperature. The aqueous samples were then filtered, washed with distilled water in order to remove any loosely adsorbed surfactant, dried about 50 oC and sieved
before use.
Adsorption experiments
Batch mode studies were conducted with treatment of different amount of adsorbent in range of 0.20 to 1.0 g with 50 mL of aqueous dye solution of dyes having different known concentrations (50–200 mg L−1). The mixtures were shaken using a mechanical shaker (150 rpm) for different periods of time exposures. At the end of each established contact time, the supernatant were analyzed for residual dye concentration. All experiments were carried out for at least three times with respect to each condition, mean values are presented. The amount of dye retained by the adsorbent (qt) at each time interval t, was calculated using the following equation:
where
qt is the amount of dye adsorbed per unit weight of adsorbent at time t (mg g-1);
C0 and Ct are the initial and liquid-phase concentrations of the dye solution at time t (mg L-1),
respectively;
V is the volume of the dye solution (L); and m is the amount of the adsorbent (g).
When t is equal to the equilibrium agitation time (i.e., Ct=Ce, qt=qe), then the amount of dye adsorbed at equilibrium, qe (mg g-1), was calculated using Eq.1.
Regeneration study
For regeneration study, 1.0 g of the selected adsorbent particles were packed into glass columns. Solutions of both dyes with constant concentration of 20 mg L-1 and optimum
pH values (pH 4 for AG25 and pH 6 for AR14 dye) were passed through the columns at a constant flow rate of 3.0 mL min−1.
The exhausted or dye uploaded columns were regenerated using different washing solutions including NaOH, HCl, NaCl (0.10 M each) and commercial ethanol (96%) at the rate of 3 (mL min−1).
( 0 )
(1) C C Vt
qt
m
The column adsorption capacity (qc , mg g -1) was estimated as follows: 22
where
C0 and Ci are the initial and effluent concentration of
dye in the liquid phase (mg L−1),
Veff is the volume of the effluent solution (L) and
m isthe mass of adsorbent (g).
The regeneration efficiency (RE) was subsequently calculated using the following equation:
where
Vb is the breakpoint volume of the regenerated used column and
Vb is the breakpoint volume of the virgin SD/CTAB column.
It might be needed to mention that a plot of effluent concentration vs. time or volume of effluent usually yields an S- shaped curve referred to as a breakthrough curve. The point on the S- shaped curve at which the effluent concentration reaches to 5% and 95% of the influent concentration are usually called breakpoint and point of column exhaustion, respectively.
Adsorption isotherms
Adsorption isotherms, describe how adsorbate molecules interact with adsorbent particles and are thus critical in optimizing the use of chemically modified solid materials. 25-27 It is possible to depict the equilibrium adsorption
isotherms by plotting the concentration of the dye in the solid phase vs. that in the liquid phase. In the present study, experimental data were compared by using two well-known and widely applied isotherm models equations, namely Langmuir and Freundlich.28-30 The application of the
Langmuir isotherm model suggests that adsorption takes place as monolayer coverage on homogeneous surface containing a finite number of vacant sites energetically equivalent to each other in respect of adsorption phenomenon and with negligible interaction between adsorbed molecules. The energy of adsorption is constant and does not depend on the degree of occupation of the adsorbent active centers. The empirical non linear Langmuir equation is given by Eq. (4) as shown in the following:
where
qe is the equilibrium dye concentration on the
adsorbent (mg g−1);
Ce , the equilibrium dye concentration in solution
(mg L−1);
qm, the monolayer capacity of the adsorbent
(mg g−1);
KL, the Langmuir constant (L mg−1) related to
energy of adsorption.
The linearized equation of Langmuir is represented as follows (Eq.5):
The values of KL and qm were determined from the slope
and intercept of the representation 1/qe versus 1/Ce of Eq.
(5), respectively. The essential features of the Langmuir isotherm can be expressed in terms of a dimensionless constant called separation factor (RL) which is defined by Eq.
6.
where Cm is the maximum initial dye concentration (mg L−1).
The values of this parameter indicated the shape of the isotherm: for in which RL>1 is unfavorable, RL=1 is linear,
0<RL<1 is favorable, and RL=0 is irreversible. The
Freundlich adsorption isotherm model can be applied for non-ideal adsorption on heterogeneous surfaces and multilayer adsorption. This model is the earliest known empirical equation and is shown to be consistent with exponential distribution of active centers, characteristic of heterogeneous surfaces. It is expressed by the following equation:
where
qe is the amount of dye adsorbed per unit of adsorbent
(mg g−1),
Ce is the concentration of non-retained dye at
equilibrium (mg L−1),
KF (mg (1-1/n)/g L1/n) and 1/n are Freundlich empirical parameters relating to multilayer adsorption capacity and adsorption intensity, respectively.
For a suitable adsorption system1/n value varies between 0 and 1.31 Linear form of the Freundlich isotherm model is
given by Eq. 8. The values of KF and 1/n can be obtained
from the linear plot of log qe versus log Ce.
0
(2) C Ci Veff
qc
m
b
% 100 (3)
b
V RE
V
(4) 1
K C qe L e qm K CL e
1 1 1 1
(5) qe qm K qL m Ce
1
(6) 1
RL
K CmL
1
(7) n
qe K CF e
1
logqe logKF logCe (8)
n
Kinetics study
Adsorption kinetic studies are significant since they not only provide valuable insights into the reaction pathways, but also describe the solute uptake rate which in turn controls the residence time of adsorbate at the solid–liquid interface. The experimental data were processed on the basis of three of the most commonly used kinetic models suggested by Lagergren, Ho McKay, Weber and Morris.32-34
Pseudo-first order kinetic equation suggested by Lagergren shown by Eq. (9) is based on the assumption that the rate of change of adsorptive solute uptake with time is directly proportional to the difference in saturation concentration and the amount of adsorptive solid uptake with time.
w here
qe and qt is the amount of dye adsorbed per unit of
adsorbent (mg g−1) at equilibrium and at time t, k1 is the pseudo-first order rate constant (min−1), and
t is the contact time (min).
The pseudo-first order rate constant (k1) was calculated
from the plot of log (qe-qt) against t. Another commonly
used kinetic model is the pseudo - second-order kinetic model (McKay Ho model) which its linear form can be expressed as:
where k2 is the pseudo-second order rate constant (g mg−1
min−1).
A plot of t/qt against t provides second order adsorption
rate constants k2 and qe2 values from the slopes and
intercepts. Both pseudo-first order equation or Lagergren's kinetics equation (Eq. 9) and pseudo-second order or HO and McKay (Eq.10) assume that adsorption rates are proportional to free available active sites on the surface of adsorbents for binding of adsorbate and Pseudo-second order equation which is based on the assumption that the adsorption process involves chemisorption mechanism. Weber and Morris proposed the intra-particle diffusion model to identify diffusion mechanisms of adsorption process. The effect of intra-particle diffusion resistance on adsorption can be determined by the following relationship.
where kid is the intra-particle rate constant (g mg−1 min−1/2 ),
and the intra-particle rate constant kid is a function of
equilibrium concentration in solid phase qe and intra-particle
diffusivity. Adsorption mechanism follows the intra-particle diffusion model, a plot of qt against t1/2should give a linear
line with slope kid and intercept C. Values of C give information about the thickness of the boundary layer, i.e.
the larger intercept the greater is the boundary layer effect.35
If the plot of uptake, qt, versus square root of time, t1/2
passes through the origin, the intra-particle diffusion will be the sole rate limiting process.
Thermodynamic study
The equilibrium constant (Kc) is a measure of adsorption
which is defined as the ratio of the quantity of the adsorbate retained by the adsorbent to the amount of the adsorbate remaining in solution.22,36,37 The equilibrium constant was
calculated from the following equations (Eqs. 12-15):
where
∆G0, ΔH0 and ΔS0 are standard Gibb’s free energy,
enthalpy, and entropy changes, respectively. R is universal gas constant (8.314 J mol K-1),
T is absolute temperature (K),
Kc (L g-1) is the adsorption equilibrium constant,
CAe is the amount of dye adsorbed on the adsorbent
(mg g-1),
Ce is the equilibrium or unadsorbed concentration of
the dye in the solution (mg L-1).
ΔG° is in fact the most fundamental criterion of spontaneity of any reaction. The slope and intercept obtained by the plot of ln Kc against 1/T were used to
calculate the ΔH0 and ΔS0, respectively.22 Gibbs free energy
changes (ΔG°) was then calculated from Eq. (12).
Results and Discussion
Effect of pH
The initial pH value of the solution is an important factor which can determine the surface charge of the adsorbent and the degree of ionization of the adsorbate.21 Theeffect of pH
on the uptake of dyes was analyzed over the pH range from 2 to 10. In this investigation, 0.40 g of adsorbent was treated with 50 mL of dye solution (100 mg L-1) for 1 h at room
temperature. It was observed that maximum adsorption for SD/CTAB occurred at pH value of 4 for AG25 and pH 6 for AR14. Therefore all of the next adsorption experiments for dye removal using SD/CTAB adsorbent were carried out at the optimum pH values of 4 (for AG25) and 6 ( for AR14), respectively. The pH of dye solutions was adjusted to value of 2 in the case of untreated sawdust because of its maximum adsorption at this pH value.
1log log 1 (9)
2.303 k qeqt qe t
1 1
(10) 2
2
2 2
t
t qt k qe qe
1
2 (11)
qt k tid C
0 0 0
(12) 0
ln (13)
0 0
ln (14)
(15)
G H T S
G RT Kc
H S
KC
RT R CAe
KC Ce
Effect of initial dye concentration
For this investigation, the adsorption experiments were carried out with initial dye concentration range of 50-200 mg L−1, 0.40 g adsorbent dose, 298 K and 60 min contact time. The Figure 2 show that the amount of dye adsorbed increased with increasing the initial dyeconcentration in the case of modified sawdust. At higher concentrations, more dye molecules were left in solution due to the saturation of the limited binding sites on the adsorbent.
As the results show, adsorption capacities (mg g−1) of SD/CTAB toward uptake of AG25 increased from 6.1 to 20.0 (~ 3.5 times improvement) and for uptake of AR14 dye, it was increased from 5.5 to 17.3 (~3 times improvement). In the case of untreated sawdust (SD), the dye uptake was slow and gradually increased to the maximum adsorption values of 3.3 and 3.8 mg g−1 for AG25 and AR14, respectively.
As the data clearly show adsorption capacity of surfactant-modified sawdust (SD/CTAB) for both dyes is considerably higher than untreated sawdust (at least 5 times) especially at higher initial dye concentrations.
Effects of adsorbent dose
The effect of adsorbent dose on the removal of AG25 and AR14 at initial dye concentration of 100 mg L-1, 298 K
temperatureand 60 min contact time for SD/CTAB and SD is shown in Fig. 3. Adsorbent dose was varied from 0.10 to 0.50 g for both adsorbents. The results obtained clearly indicate with increasing of adsorbent dose, the amount of dye uptake is increased and maximum adsorption of the dyes occurred by SD/CTAB at 0.40 g of adsorbent (Fig. 3). Therefore, further investigations were carried out using 0.40 g of adsorbent. SD/CTAB has also shows to be a more efficient adsorbent for the removal of acid dyes from aqueous solutions than the untreated SD. Increasing of adsorption with increasing of adsorbent dose can be due to the more availability of free binding sites with increasing of the amount of adsorbent.
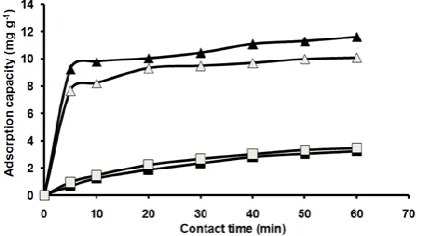
Effect of contact time
In this investigation, fixed amounts of adsorbents (0.40 g) were agitated with constant volumes of dye solutions (50 mL) having initial dye concentration of 100 mg L−1 at established pH values. The mixtures were shaken at room temperature for different periods of contact times (5-60 min). The results obtained are presented in Figure 4. As the results show, the adsorption rate of acid dyes in the first 5 min for SD/CTAB is very fast. Highest amount of dye retained is occurred within the initial 10 minutes of contact time. After reaching the saturation value in 60 min of contact, a continuous and smooth curve is obtained for both adsorbents. Based on these results, 60 min was taken as the equilibrium time in batch adsorption experiments. Again as the results of this part of investigation clearly show, the uptake rate and adsorption amount of acid dyes onto SD/CTAB is much higher than that of SD at any contact time. The difference in the equilibrium time for both adsorbents may be due to strong attractive forces such as electrostatic between the dye molecules and the surfactant-modified sawdust.
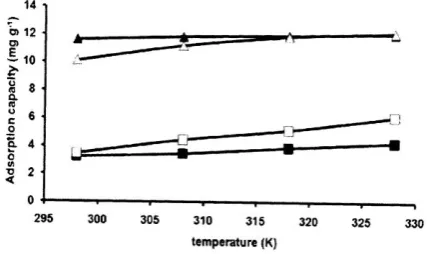
Effect of solution temperature
Investigation of temperature effect is very important from both kinetics and thermodynamic points of view. The effect of temperature (298-328 K) on adsorption of AG25 and AR14 by two selected adsorbents is illustrated in Fig. 5. In this investigation, constant amounts of adsorbents (0.40 g) were agitated with 50 mL of dye solutions with concentration of 100 mg L-1. The results reveal (Fig. 5) that
solution temperature does not affect the sorption efficiency. It might be concluded that the adsorption system investigated is not accompanied by considerable enthalpy changes. However, increasing of dye solution temperature seems to be more effective in the case of unmodified sawdust.
Figure 2. Effect of initial dye concentration on the adsorption of dyes by SD/CTAB (▲: AG25; ∆: AR14) and SD (■: AG25; □: AR14).
Figure 3. Effect of adsorbent dose on the adsorption of dyes by SD/CTAB (▲: AG25; ∆: AR14) and SD (■: AG25; □: AR14).
Table 1. Isotherm parameters obtained for adsorption of AG25 and AR14 dyes onto SD/CTAB and SD.
Adsorbent Dye
Langmuir constants Freundlich constants
qm
(mg g-1)
qm (exp)
(mg g-1)
KL
(L mg-1) RL R2
KF
(mg(1-1/n)/g L1/n) 1/ n R2 SD/CTAB AG25 17.45 20.38 0.431 0.011 0.953 5.77 0.35 0.998
AR14 18.87 17.30 0.066 0.070 0.986 2.33 0.48 0.997
SD AG25 3.81 3.33 0.045 0.100 0.996 1.02 0.24 0.943 AR14 4.33 3.83 0.041 0.108 0.999 1.00 0.27 0.979
Table 2. Kinetic parameters obtained for adsorption of AG25 and AR14 dyes onto SD/CTAB and SD.
Adsorbent Dye
Pseudo first-order model Pseudo second-order model Intraparticle diffusion model
qe1
mg g-1
k1
min-1 R
2 qe2
mg g-1
qe (exp)
mg g-1
k2,
g mg-1 min-1 R
2 Kid
g mg−1 min−1/2
R2
SD/CTAB AG25 3.20 0.043 0.949 11.89 11.60 0.032 0.997 0.420 0.981 AR14 3.46 0.064 0.945 10.42 9.43 0.040 0.999 0.435 0.935
SD AG25 3.82 0.057 0.975 4.97 3.22 0.006 0.996 0.472 0.991 AR14 3.92 0.061 0.956 4.65 3.45 0.010 0.997 0.463 0.976 *qe1 and qe2 stand for calculated qe based on pseudo first and second-order models respectively.
Isotherm investigation
The adsorption isotherm based on linear form of Langmuir and Freundlich equations were plotted (not shown) and the estimated parameters obtained from intercepts and slopes of the corresponding linear plots (log q versus log C and 1/q versus 1/C) are summarised in Table 1. Based on the regression analysis (value of R2), adsorption
data obtained for CRAB/SD is better fitted with Freundlich model.The RL and 1/n values (between 0 and 1) obtained for both adsorbents revealing the favorable adsorption too.
Figure 5. Effect of temperature on the adsorption of dyes by SD/CTAB (▲: AG25;
∆
:AR14) and SD (■
: AG25;□
:AR14).Kinetics investigation
The results of adsorption kinetics were processed based on the three kinetic models: pseudo-first order, pseudo-second and intraparticle diffusion models. The kinetic parameters related to each kinetic model were calculated from the intercepts and slopes of the corresponding linear plots (not shown) and the estimated parameters are summarised in Table 2.
The correlation coefficients (R2) obtained for both adsorbents using pseudo-second-order model (0.996 and 0.999) are higher than those obtained for pseudo-first-order model (0.945-0.975). The calculated adsorption capacity value obtained from pseudo-second-order model (qe2) agrees well with the related experimental value (qe, exp). It could be
concluded that the adsorption systems are fitted well to the pseudo-second-order model which confirms chemisorption mechanism. These results suggested that such adsorption of dyes might take place via surface ion exchange reaction until the surface function sites are fully occupied. The intra-particle diffusion plots for adsorption of AG25 and AR14 were linear but did not pass through the origin, indicated that the pore diffusion isn’t the rate limiting step of the studied adsorption process.
Thermodynamic investigation
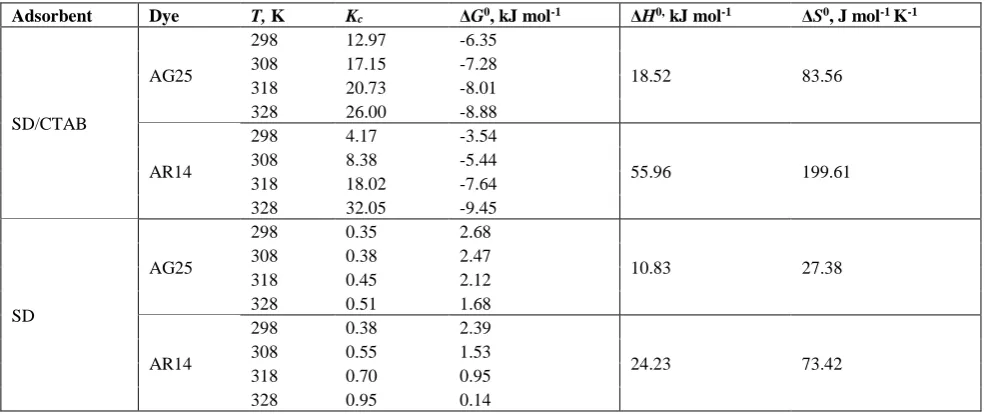
Thermodynamic study provides useful information about the spontaneity of a given adsorption processes point as well as calculating of fundamental thermodynamic parameters, such as ∆G°, ∆H° and ΔS°. The effect of temperature on the adsorption equilibrium constants and thermodynamic parameters of the adsorption equilibriums derived from the linear plot of ln K versus 1/T (not shown) deduced from Fig. 6 and van't Hoff equation (Eq. 14) are presented in Table 3.
As the data show (Table 3), the value of Kc increases with increasing temperature from 298 to 328 K, suggested the endothermic nature of adsorption process (ΔH0 > 0). The
negative values of ΔG0 indicated the spontaneous nature of
the studied adsorption system. The more negative values obtained for ΔG0 with increasing temperature indicates that
the adsorption process is more favorable at higher temperature. The positive values of ΔG0 obtained for
Table 3. Thermodynamic parameters obtained for adsorption of AG25 and AR14 dyes onto SD/CTAB and SD.
Adsorbent Dye T, K Kc ΔG0, kJ mol-1 ΔH0, kJ mol-1 ΔS0, J mol-1 K-1
SD/CTAB
AG25
298 12.97 -6.35
18.52 83.56
308 17.15 -7.28 318 20.73 -8.01 328 26.00 -8.88
AR14
298 4.17 -3.54
55.96 199.61
308 8.38 -5.44 318 18.02 -7.64 328 32.05 -9.45
SD
AG25
298 0.35 2.68
10.83 27.38
308 0.38 2.47 318 0.45 2.12 328 0.51 1.68
AR14
298 0.38 2.39
24.23 73.42
308 0.55 1.53 318 0.70 0.95 328 0.95 0.14
Regeneration investigation
For desorption study, various chemicals such as dilute solutions (0.10 M) of NaOH, HCl, and NaCl. The regeneration efficiency (%RE) was calculated using Eq. (3). The results indicate that among the tested washing solutions, NaOH (0.10 M) led to obtaining the best results. Before regeneration experiment, a glass column was first packed with SD/CTAB (1.0 g) and dye solutions (AG25 and AR14) with initial concentration of 20 mg L−1 were passed through the columns with flow rate of 3.0 mL min−1. The dye
uploaded columns were then washed with 0.10 M NaOH in order to regeneration and desorbing dyes. The results obtained for AG25 dye are illustrated in Fig. 6.
Figure 6. Breakthrough curves obtained for removal of AG25 by SD/CTAB regenerated column (
●
: Cycle 1;■
: Cycle 2; ▲: Cycle 3)As the results represent the adsorption capacity of bed decreases as cycle proceeds and this is because of adsorbing sites, whose accessibility becomes difficult as the cycles progressed. Maximum decay observed after three run was about 20% of its initial performance. The results clearly indicate that both dyes retained good adsorption efficiency even after three runs. It was also found that simple pretreatment of the regenerated column with surfactant in each run leads to further improvement of sorption capacity of sawdust for dye removal.
Conclusion
Sawdust modified with cetyltrimethylammonium bromide (SD/CTAB) can be obtained by simple treatment of sawdust with surfactant solution and was proved to be an efficient low cost adsorbent for removal of AG25 and AR14 acid dyes. The adsorption process is influenced by some physical parameters such as solution pH, initial dye concentration, adsorbent dose, contact time and temperature. Adsorption capacity of the adsorbents increased with increasing initial dye concentration, contact time and temperature. The optimal pH of adsorption of AG25 and AR14 dyes onto SD/CTAB were found to be 4 and 6, respectively, while maximum adsorption capacity of these two dyes onto SD occurred at pH 2.
Freundlich isotherm described the equilibrium data of both dyes on SD/CTAB better than Langmuir isotherm, while Langmuir isotherm fitted better to the equilibrium data of dyes on untreated sawdust. The maximum adsorption capacity of SD/CTAB for AG25 and AR14 were found to be 17.5 and 18.9 mg g−1, respectively, based on monolayer coverage of Langmuir model. Pseudo-second-order equation generated the best agreement with experimental data for adsorption systems for the two acid dyes. Thermodynamic analysis suggests that adsorption of dyes by SD/CTAB was a spontaneous and endothermic process.
High regeneration of the used SD/CTAB is quite possible using 0.01 M NaOH and the regenerated adsorbent can be reused without any considerable decay in its removal performance. Because of endothermic nature of the studied adsorption system, it may conclude that spontaneity is mainly governed by entropy factor (S0>0). Upon simple
Acknowledgement
Partial support of this study by the Research Council of University of Guilan is acknowledged.
References
1Mondal, S., Environ. Eng. Sci. 2008, 25, 383.
2Garcia-Montano, J., Torrades, F., Perez-Estrada, L. A., Oller, I.,
Malato, S., Maldonado, M. I., Peral, J. Environ. Sci. Technol.
2008, 42, 6663.
3Kar, A., Smith, Y. R., Subramanian, V., Environ. Sci. Technol.
2009, 43, 3260.
4Koswojo, R., Utomo, R. P., Ju, Y.H.; Ayucitra, A. F., Soetaredjo,
E., J., Appl. Clay. Sci.2010, 48, 81.
5Tuorma, T. E., J. Orthomol. Med. 1994, 9, 225-243.
6Gaunt, I. F., Farmer, M., Grasso, P., Gangoli, S. D., Food.
Cosmet. Toxicol. 1967,5, 179.
7Blackburn, R. S., Environ. Sci. Technol.2004, 38, 4905. 8Crini, G., Bioresour. Technol.2006,97, 1061.
9Chakraborty, S., Purkait, M. K., Gupta, S. D., De, S., Basu, J. K.,
Sep. Purif. Technol. 2003, 31, 141.
10Garg, V. K., Gupta, R., Yadav, A. B. Kumar, R., Bioresour.
Technol.2003, 89, 121.
11Allen, S. J., McKay, G., Porter, J. F., J. Colloid. Interf. Sci. 2004,
280, 322.
12Jain, A. K., Gupta, V. K., Bhatnagar, A., Suhas, I. A., J. Hazard.
Mater.2003, B101, 31.
13Chatterjee, S., Lee, D. S., Lee, M. W., Woo, S. H., Bioresour.
Technol.2009, 100, 3862.
14Kadirvelu, K., Kavipriya, M., Karthika, C., Radhika, M.,
Vennilamani, N, Pattabhi, S., Bioresour., Technol. 2003, 87(1), 129.
15Suteu, D., Bilba, D.; Dorofte, F., Malutan, T., Sep. Sci. Technol.
2011, 46, 1462.
16Arami, M., Limaee, N.Y., Mahmoodi, N. M., Tabrizi, N. S., J.
Hazard. Mater.2006, B135, 171.
17Hameed, B. H., Ahmad, A. A., Aziz, N., Chem. Eng. J.2007, 133,
195.
18Ansari, R., Keivani, M. B., Delavar, A. F., J. Appl. Polym. Sci.
2011, 122, 804.
19Ansari, R., Seyghali, B., Mohammad-khah, A., Zanjanchi, M.
A., Sep. Sci. Technol., 2012, 47, 1802.
20Ansari, R., Tehrani, S. M., Mohammad-Khah, A., J. Wood Chem.
Technol. 2012, 32, 198.
21Ansari, R., Tehrani, S. M., Keivani, M. B., J. Wood Chem.
Technol. 2013, 33, 19.
22Ansari, R., and Dezhampanah, H., Eur. Chem. Bull. 2013, 2(4),
220.
23Bingol, A., Aslan, A., Cakici, A., J. Hazard. Mater.2009, 161,
747.
24Balistrieri, L. S., Murray, J. W., Am. J. Sci. 1981, 281, 788.
25Gupta, V. K., Sharma, S., Environ. Sci. Technol.2002, 36, 3612. 26Anirudhan, T. S., Suchithra, P. S., J. Environ. Sci.,2009, 21, 884. 27Al-Duri, B., Adsorption modelling and mass transfer. CRC Press,
1996, 133.
28Langmuir, I., J. Am. Chem. Soc.1918, 40, 1361.
29Hall, K. R., Eagleton, L. C., Acrivos, A., Vermeulen, T., Ind. Eng.
Chem. Fundament.1966, 5, 212.
30Freundlich, H. M. F. , Phys. Chem. 1906, 57A, 385. 31Coles, C. A., Yong, R. N., Eng. Geol., 2006, 85, 19. 32Lagergren, S., Kung. Sven. Vetenskapsak. Handl. 1898, 24, 1. 33Ho, Y. S., McKay, G., Process. Biochem. 2009, 34, 451. 34Weber, W. J., Morris, J. C., J. Sanit. Eng. Div. Am. Soc. Civ. Eng.
1963, 89, 31.
35Vimonses, V., Lei, S., Jin, B.; Chow, C. W. K., Saint, C., Appl.
Clay Sci.2009, 43, 465.
36Lian, L., Guo, L., Guo, C., J. Hazard. Mater. 2009, 161, 126. 37Nigam, P., Armour, G., Banat, I. M., Singh, D., Marchant, R.,
Bioresour. Technol.,2000, 72, 219.