669
GENETIC DIVERSITY AND POPULATION STRUCTURE OF THE NARROW ENDEMIC
AND ENDANGERED SPECIES
HETEROPLEXIS MICROCEPHALA
Y. L. CHEN. IN CHINA
REVEALED BY RANDOM AMPLIFIED POLYMORPHIC DNA MARKERS
Yancai Shi1,2,3, Xiao Wei2,3, Jiqing Wei2,3, Yongtao Li1,*, Shengfeng Chai2,3 and Jianming Tang2,3
1 College of Natural Resources and Environment, South China Agriculture University, Guangzhou 510000, PR China 2 Guangxi Key Laboratory of Functional Phytochemicals Research and Utilization, Guilin 541006, PR China 3 Guangxi Institute of Botany, Chinese Academy of Sciences, Guilin 541006, PR China
*Corresponding author: [email protected]
Received: September 21, 2015; Revised: October 12, 2015; Accepted: October 20, 2015; Published online: June 16, 2016
Abstract: Heteroplexis microcephala Y. L. Chen. is an endemic and endangered species found only in karst limestone regions in the Yangshuo County of the Guangxi Zhuang Autonomous Region in China: it is a habitat representative of species in the
Heteroplexis genus. To provide basic genetic information for its conservation, in this study we evaluated the genetic varia-tion and differentiavaria-tion among six wild populavaria-tions of H. microcephala by random amplified polymorphic DNA markers (RAPD). The leaves of 141 individuals were sampled. Based on 12 primers, 113 DNA fragments were generated. Genetic diversity was low at the population level (Nei’s gene diversity (h)=0.0579; Shannon information index (I)=0.0924; percent-age of polymorphic bands (PPB)=23.30%), but relatively high at the species level (h=0.1701; I=0.2551; PPB=46.34%). The coefficient of genetic differentiation based on Nei’s genetic diversity analysis (0.6661) was high, indicating that there was significant genetic differentiation among populations, which was confirmed by AMOVA analysis exhibiting population differentiation among populations of 68.77%. Low gene flow among populations (0.2507) may result from several factors, such as a harsh pollination environment, population isolation and low seed dispersal distance. Limited gene flow and self-compatibility are the primary reasons for the high genetic differentiation observed for this species. We propose the collection of seeds from more populations with fewer individuals and core populations for ex situ conservation and suggest methods to increase seed germination rates.
Key words: endangered species; random amplified polymorphic DNA; genetic variability; population differentiation; conservation
INTRODUCTION
Heteroplexis Chang was first reported as a new genus belonging to the family Asteraceae. At present, the genus includes the five species: H. vernonioides C. C. Chang, H. microcephala Y. L. Chen, H. sericophylla
Y. L. Chen, H. impressinervia J. Y. Liang and H. in-cana J. Y. Liang, all of which are endemic to Guangxi, China [1]. H. microcephala distribution is restricted to Yangshuo County in Guangxi, China, and occurs on the steep cliffs or upper slopes of karst limestone regions at an elevation of approximately 150-450 m, where the environment is very severe. Our investiga-tions indicated that the range of this species has
signif-icantly decreased, and the number has been reduced to zero in Bilianfeng, the site where the model speci-men was discovered. H. microcephala can provide im-portant information leading to a better understanding of the evolution of Asteraceae. It has been designated as a class II nationally protected plant in China [2].
species and make plans for conservation [5]. Previous studies of H. microcephala were primarily devoted to its chemical components [6], karyotype analysis [7] and biological characteristics [8]. However, no genetic variability has been carried out on this species, and we have no information about the genetic diversity of
H. microcephala.
A number of PCR-based DNA markers have been used to analyze the population genetic structure of endemic and endangered plants [9], such as random amplified polymorphic DNA analysis (RAPD), inter simple sequence repeat (ISSR) and amplified fragment length polymorphism (AFLP) [10,11]. RAPD does not require prior genomic knowledge, and is a fast and
relatively cheap method for evaluating a population’s genetic differentiation, especially when molecular in-formation is lacking on a certain species [12]. The lim-itation of low reproducibility and dominant nature in early RAPD can now be overcome through improved laboratory techniques and band scoring procedures, and analysis of molecular variance (AMOVA) [12-15]. Although RAPD analysis has some disadvantages, it is a useful technique for investigating population genetic diversity and has been applied to many rare plants [16,17]. The aim of this study was to use RAPD markers to characterize genetic diversity in H. mi-crocephala, to investigate the genetic variation and to propose conservation strategies for H. microcephala.
MATERIALS AND METHODS
Plant materials
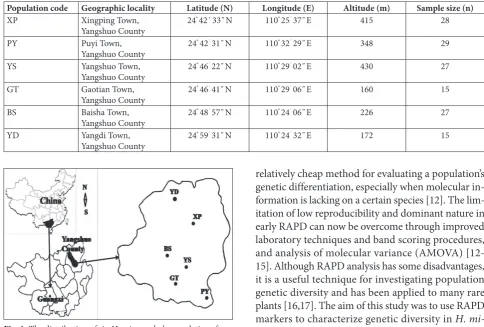
In our field investigation, six populations of H. m i-crocephala from Yangshuo County in Guangxi, Chi-na, were surveyed and 141 samples representing six populations were collected in 2013. The sampling sites are shown in Table 1 and Fig. 1. Tender leaves were collected from six populations and placed in a bag container with approximately 100 g of silica gel, then stored at -80°C until DNA extraction.
Table 1. Population location, number and sample size of six populations of H. microcephala.
Population code Geographic locality Latitude (N) Longitude (E) Altitude (m) Sample size (n)
XP Xingping Town,
Yangshuo County 24
° 42´33˝N 110° 25´ 37˝E 415 28
PY Puyi Town,
Yangshuo County 24
° 42´ 31˝N 110° 32´ 29˝E 348 29
YS Yangshuo Town,
Yangshuo County 24
° 46´ 22˝N 110° 29´ 02˝E 430 27
GT Gaotian Town,
Yangshuo County 24
° 46´ 41˝N 110° 29´ 06˝E 160 15
BS Baisha Town,
Yangshuo County 24
° 48´ 57˝N 110° 24´ 06˝E 226 27
YD Yangdi Town,
Yangshuo County 24
° 59´ 31˝N 110° 24´ 32˝E 172 15
DNA extraction and polymerase chain reaction (PCR) amplification
Equal amounts (0.5 g dry weight) of leaf tissue were placed in porcelain mortars with liquid nitrogen. Ge-nomic DNA was extracted according to the CTAB method. The DNA quality was checked by gel electro-phoresis [18]. The RAPD primers were synthesized by Shanghai Sangon Biological Engineering Technology and Service Co., Ltd., according to the primers pub-lished by the University of British Columbia (UBC) [19]. For preliminary screening, 100 primers were tested on six individuals from six populations. Twelve primers (Table 2) that produced clear and reproduc-ible bands were chosen for analysis.
PCR was performed in a 25-µL reaction volume containing 50 ng DNA template, 1.5 mM MgCl2, 0.5 µM primer, 0.2 mM dNTP, 2.5 µL 10×buffer, and 1.5 units Taq polymerase. Amplifications were conducted in a Biometra TProfessional Thermocycler as follows: initial denaturation at 94°C for 5 min; 40 cycles of 94°C for 40 s, annealing temperature (Table 2) for 45 s, 72°C for 1.5 min; final extension at 72°C for 7 min [20].
Electrophoresis was performed with 5 µL of am-plified products in a 1.5% agarose gel at 120 V for 1 h. The bands were detected with ethidium bromide under UV light. Molecular weights were estimated us-ing a 2000-bp DNA ladder (Takara Biotech). To ensure the reproducibility, each amplification reaction and gel running was repeated three times and only clear and reproducible fragments were recorded. Negative controls, replacing template DNA with ddH2O, were included in each amplification to check the possibility of contamination.
Data analysis
RAPD profiles were scored as the presence (1) or absence (0) of specific bands. Statistical analysis was performed using POPGENE 32 [21], including the percentage of polymorphic loci (PPB), Nei’s genetic distance (h), Shannon’s information index (I), ob-served allele number (Na), effective allele number (Ne), gene diversity within populations (Hs), total
gene diversity (Ht), the coefficient of Nei’s gene dif-ferentiation among populations (Gst), gene diversity among populations (Dst), and gene flow among popu-lations (Nm). Analysis of molecular variance (AMO-VA) was performed using WINAMOVA 1.55 [22]. An unweighted pair group method using arithmetic aver-ages (UPGMA) cluster analysis was carried out using the NTSYS-pc version 2.02 software package [10].
RESULTS
Genetic diversity of H. microcephala
One hundred RAPD primers were screened in six se-lected individuals. A total of 113 bands were obtained from the 12 selected primers across 141 individuals of the six populations, corresponding to an average of 9.41 bands per primer (Table 2). The percentage of polymorphic loci and average genetic diversity are summarized in Table 3. The percentages of polymor-phic loci (PPB) for the populations ranged from 18.58 to 28.32% with an average of 23.32%. The average ob-served allele number (Na) per locus is 1.2330 and the effective number of alleles (Ne) per locus is 1.0926. Shannon indices (I) and Nei’s gene diversity (h) varied
Table 2. Characteristics of the 12 RAPD primers used for ampli-fied DNA products in this research.
Primer Sequence (5´to 3´) TA (°C) NPL/NL
812 CCTTGACGCA 36.9 3/8
819 ACCCCCGAAG 41 6/11
831 CAATCGCCGT 36.9 4/9
837 GACCGCTTGT 36.9 5/9
846 ACCTGAACGG 36.9 5/10
866 GAACGGACTC 36.9 3/10
867 GTCCCGACGA 41 3/8
869 CTCACCGTCC 41 5/8
871 AAAGCTGCGG 36.9 4/9
880 ACTTCGCCAC 36.9 6/10
881 CTACGGAGGA 36.9 8/12
886 GTGCCTAACC 36.9 5/9
TA − annealing temperature (°C); NL − number of loci scored; NPL −
from 0.0769 to 0.1076 and 0.0455 to 0.0707, with an average of 0.0924 and 0.0579 at the population level and 0.2551 and 0.1701 at the species level. The XP population exhibited the greatest level of variability (PPB=28.32%, Na=1.2832, Ne=1.0987, h=0.0640, I=0.1049), whereas the GT exhibits the lowest level (PPB=18.58%, Na=1.1858, Ne=1.0896, h=0.0531, I=0.0822, respectively) (Table 3).
Genetic differentiation of H. microcephala
The genetic differentiation (Gst) among populations was 0.6661 (Table 4), which indicated that 66.61% of the genetic variability was distributed among populations, and only 33.39% of the variation existed within popu-lations. Molecular variance was also examined using AMOVA based on RAPD banding patterns. The
vari-ance component found within populations was 31.23%, and a variance of 68.77% was found among popula-tions (Table 5). The number of individuals exchanged between populations per generation (Nm) was 0.2507, indicating that there is a low migration rate.
Genetic relatedness among populations
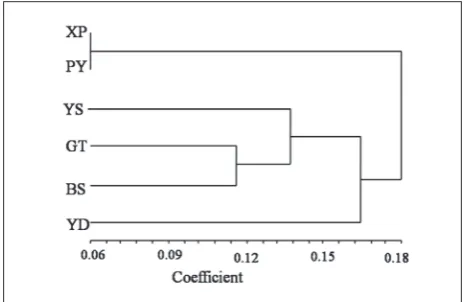
Table 6 shows Nei’s genetic identities and genetic distance for all population pairs. The highest genetic distance was 0.2232 between populations XP and GT, while the lowest was 0.0576 between XP and PY. Six populations clustered into two main groups (Fig. 2), one containing populations XP and PY, and the other containing YS, GT, BS, and YD. The latter was divided into three subgroups, one containing populations GT and BS, one population YS, and the last population YD.
DISCUSSION
Genetic diversity
Low genetic diversity is a common feature of endemic and endangered plant species [23,24]. Loss of genetic diversity reduces the ability of species to cope with environmental change, which is the main reasons for plant rarity. In our study, the genetic diversity of H. mi-crocephala was relatively low. PPB values ranged from
Table 3. Genetic diversity parameters of six sampled population of H. microcephala based on 113 RAPD loci using POPGENE 32.
Populations Np PPB (%) Na Ne h I
XP 32 28.32 1.2832 1.0987 0.0640 0.1049
PY 30 26.55 1.2655 1.1029 0.0657 0.1057
YS 24 21.24 1.2124 1.0782 0.0481 0.0776
GT 21 18.58 1.1858 1.0896 0.0531 0.0822
BS 26 23.01 1.2301 1.0663 0.0455 0.0769
YD 25 22.12 1.2212 1.1200 0.0707 0.1076
Mean 26 23.30 1.2330 1.0926 0.0579 0.0924
Species level 57 46.34 1.4867 1.2859 0.1701 0.2551
SD 0.5021 0.3495 0.1956 0.2838
Note: Np − number of polymorphic loci; PPB − percentage of polymorphic loci; Na − observed allele number; Ne − effective allele number; I − Shan-non’s information index; h − Nei’s gene diversity
Table 4. Analysis of genetic variability within and among six H. mi-crocephala populations based on RAPD data using POPGENE 32.
Ht Hs Dst Gst Nm
Mean 0.1732 0.0579 0.1153 0.6661 0.2507
S.D 0.0391 0.0080
Ht − total gene diversity; Hs − gene diversity within populations; Dst − gene diversity among populations; Gst − the coefficient of Nei’s gene differentiation among populations; Nm − gene flow among populations
Table 5. Analysis (AMOVA) of genetic variability within and among six H. microcephala populations based on RAPD data.
Source of variance d.f. Sum of squares Mean squares Variance component Percentage of total (%) P value
Among populations 5 855.2977 171.060 7.2351 68.77% <0.001
Within populations 135 443.5675 3.286 3.2856 31.23% <0.001
Note: d.f. − degrees of freedom. P-value denotes the probability of null hypothesis; significance tests after 1000 permutations
Table 6. Nei’s measures of genetic identity (above diagonal) and
genetic distance (below diagonal) among six populations of H.
microcephala.
Populations XP PY YS GT BS YD
XP **** 0.9440 0.8280 0.8000 0.8309 0.8304
PY 0.0576 **** 0.8825 0.8306 0.8448 0.8267
YS 0.1888 0.1250 **** 0.8900 0.8535 0.8141
GT 0.2232 0.1856 0.1165 **** 0.8908 0.8585
BS 0.1852 0.1687 0.1584 0.1156 **** 0.8703
18.58 to 28.32% with an average of 23.32%, which are smaller than seed plants in general (PPB=34.2%) and other endangered plants that have been examined using RAPD markers, such as Dracocephalum aus-triacum L. (PPB=80.14%) [25] and Centaurea nivea
(PPB=72.90%) [26]. The genetic variation was also low compared to some other species in the Astera-ceae family, such as Centaurea nivea (PPB=72.90%) [26], Aster spathulifolius Maxim (PPB=43.74%) [27] and Nouelia insignis (PPB=65.05%) [28]. Shannon’s information index and Nei’s gene diversity also re-vealed low genetic variation at the population (0.1328 and 0.0880) and species levels (0.2551 and 0.1701). The low genetic diversity observed in H. microcephala
might be due to its restricted geographic distribution, breeding system, or inbreeding, as well as the decline in population size.
H. microcephala grows in harsh environments, which can easily result in a low survival ratio. It usu-ally forms small populations at the top of hills with a discrete distribution area of only 600~1000 m2. In its habitat, some seedlings fall to the bottom layer of vegetation with weak light during the growth process, leading to unbalanced seedling growth. The environ-ment reduces the seedling survival ratio, and the spe-cies’ natural regeneration ability is poor. However, the distribution of H. microcephala was expected to be narrower and more fragmented than the current one.
In general, clonal and selfing plants have high differentiation and low genetic diversity compared to out-crossing species [29]. According to our field investigation, the breeding system of H. microcephala
prioritizes out-crossing but maintains self-compati-bility. The H. microcephala population is fragmented, so pollen travel between populations is difficult. In general, the number of individuals in a population is between 10 to 100, which is very small and results in a decrease of population genetic diversity because of long-term self-compatibility.
All these factors may have led to a decrease in population size and increase in inbreeding, perhaps explaining the low genetic diversity observed in H. microcephala.
Population genetic structure
In this study, analyses of the RAPD markers using Shannon’s diversity index, Nei’s genetic diversity analysis and AMOVA yielded similar interpretations of the H. microcephala population genetic structure. The estimated Nei’s genetic differentiation (Gst) calcu-lated for all polymorphic loci suggested that a genetic differentiation has occurred (66.61%) among popu-lations of H. microcephala. Furthermore, AMOVA showed that 68.77% of the total variation results from differentiation among populations. The genetic struc-ture of plant populations reflects interactions among various factors, including habitat fragmentation and population isolation, mating system, genetic drift and gene flow [30].
One possible explanation for the lack of genetic variation within populations of H. microcephala may be genetic drift. The endemic plant possesses gener-ally low genetic variation due to genetic drift. Genetic drift decreases the variation within populations and increases the differentiation among populations.
Another possible explanation for the genetic dif-ferentiation between populations is gene flow. The gene flow was only 0.2507, which is far below the baseline value of 1, indicating a genetic differentia-tion among populadifferentia-tions of H. microcephala. As in our
Fig. 2. Dendrogram of the six sampled locations of H. micro-cephala obtained by unweighted pair-group method with arith-metic average (UPGMA) cluster analysis and SM coefficient using NTSYS-pc version 2.02 software package.
study, genetic differentiation was found in several rare or endangered plant species and attributed to low or absent gene flow [31-33].
This species grows on the upper slopes or steep cliffs of karst limestone regions known for drastic cli-mate change during the flowering season. According to our field observations, gene flow among popula-tions of H. microcephala occurs mainly through polli-nators (the flowers are visited by bees such as Eristalis cerealis and Vespa ducalis). Changes in the weather lead to the quick loss of pollen vitality and affect the number of pollinators. The restrictive geographical distribution and isolated populations separated by several limestone regions can make pollen interac-tion between populainterac-tions difficult.
Seed produce varies widely from 2000 to 5000 per seeding, and the seeds are small (weight per thousand seeds is only 0.34 g). The distance of seed dispersal of H. microcephala is short. Seeds usually drop to the ground during the rainy season and stay on the soil surface, although others are dispersed by wind or birds. Seeds falling around mother plants might be partly responsible for the low population genetic di-versity in this species. In addition, seed germination rates are extremely low under natural conditions, even if rates are below 1% under experimental conditions. Germination and propagation are very rare events even though the seeds can disperse. Gene flow via seed and pollen dispersal may be very restricted.
Some genetic studies have confirmed a positive correlation between population size and genetic di-versity [9]. Our results indicated that genetic didi-versity is related to population size. The genetic diversity of the smallest population, GT (approximately 15 plants), was the lowest, while that of the largest population, XP (more than 100 plants remaining), was the highest.
Conservation recommendations
Based on the observed genetic diversity, conservation strategy proposals for H. microcephala are as follows: first, the large populations with higher genetic varia-tion in H. microcephala should be given priority for
conservation: the PY and XP populations should be a priority for conservation action. Second, replacement of the lost population can be achieved by transplant-ing seedltransplant-ings, and through other actions to artificially increase the gene flow and maintain sufficient genetic richness. Specifically, we propose a practical ex situ
conservation strategy of collecting seeds for propaga-tion under greenhouse condipropaga-tions. This could increase the genetic diversity in combination with transplant-ing seedltransplant-ings among extant populations. The seed germination ratio in nature is extremely low, so suc-cessful propagation and planting will require the de-velopment of methods to increase seed germination.
Acknowledgments: This research was supported by grants from the Natural Science Foundation of Guangxi (2013GXNS-FBA019054 and 2014GXNSFAA118093), and the Basic Business Expenses Project of Guangxi Institute of Botany (Guizhiye 12011).
Authors’ contributions: Xiao Wei designed the experiments; Jian-ming Tang performed the experiments; Jiqing Wei and Yongtao Li analyzed the data; Yancai Shi and Shengfeng Chai wrote the paper.
Conflict of interest disclosure: This manuscript has not been published before and is not under consideration for publication anywhere else. The publication of this article was approved by all authors.
REFERENCES
1. Haining T, Yan L. Qin HN, Liu Y. [A checklist of vascular plants of Guangxi]. Beijing: Science Press; 2010. p. 625. Chi-nese.
2. Fu LG. Chinese plant red book. Beijing: Science Press; 1992. p. 654. Chinese.
3. Futuyma DJ. The evolution of evolutionary ecology. Isr J Ecol Evol. 2013;59(4):172-80.
4. Jeong JH, Kim EH, Guo WH, Yoo KO, Jo DG, Kim ZS. Genetic diversity and structure of the endangered species
Megaleranthis saniculifolia in Korea as revealed by allozyme and ISSR markers. Plant Syst Evol. 2010;289(1):67-76. 5. Furches MS, Wallace LE, Helenurm K. High genetic
diver-gence characterizes populations of the endemic plant
Litho-phragma maximum (Saxifragaceae) on San Clement Island. Conserv Genet. 2009;10(1):115-26.
6. Fan XN, Lin S, Zhu CG, Hu JF, Hu JF, Liu Y, Chen XG, Chen
NH, Wang WJ, Shi JG. [Terpenoids of Heteroplexis
micoceph-ala and their bioactivities]. Chinese. China J Chinese Materia
7. Zhang Gl, Guo X. The karyotype analysis of Anemoclema glaucifolium and Heteroplexis microcephala both endemic to China (in Chinese). Acta Bot Yunnanica. 2002;24(6):765-8. 8. Wang CM, Huan SX, Wang Y. [A preliminary study on
eco-logical and biologcal characteristics of Heteroplexis
micro-cephala-A protected and endemic species from Guangxi]. Guihaia. 1994;12(4):356-8.
9. Qiu YX, Hong DY, Fu CX, Cameron KM. Genetic variation in
the endangered and endemic species Changium smyrnioides
(Apiaceae). Biochem Syst Ecol. 2004;32(6):583-96.
10. Badfar-Chaleshtori S, Shiran B, Kohgard M, Mommeni H. Hafizi A, Khodambashi M, Mirakhorli N, Sorkheh K. Assess-ment of genetic diversity and structure of Imperial Crown (Fritillaria imperialis L.) populations in the Zagros region of Iran using AFLP, ISSR and RAPD markers and implications for its conservation. Biochem Syst Ecol. 2012;42:35-48. 11. Pineda-Martos R, Velasco L, Perez-Vich B. Identification,
characterisation and discriminatory power of microsatellite
markers in the parasitic weed Orobanche cumana. Weed Res.
2014;54(2):120-32.
12. Nybom H. Comparison of different nuclear DNA markers for estimating intraspecific genetic diversity in plants. Mol Ecol. 2004;13(5):1143-55.
13. Excoffier L, Smouse PE, Quattro JM. Analysis of molecular variance inferred from metric distances among DNA haplo-types: Application to human mitochondrial DNA restriction data. Genetics. 1992;131(2):479-91.
14. Huff DR, Peakall R, Smouse PE. RAPD variation within and among natural populations of outcrossing buffalograss [Buchloe dactyloides (Nutt.) Engelm.]. Theo Appl Genet. 1993;86(8):927-34.
15. Diaz V, Muniz LM, Ferrer E. Random amplified polymorphic DNA and amplified fragment length polymorphism
assess-ment of genetic variation in Nicaraguan populations of Pinus
oocarpa. Mol Ecol. 2001;10:2593-603.
16. del Hoyo A, Lopez-Pujol J, Chung MY, de la Vega BL. Popula-tion genetics and conservaPopula-tion of the extremely narrow
Pyre-nean palaeoendemic Glandora oleifolia (Boraginaceae). Plant
Ecol Divers. 2012;5(4):501-11.
17. Bruetting C, Hensen I, Wesche K. Ex situ cultivation affects genetic structure and diversity in arable plants. Plant Biol. 2013;15(3):505-13.
18. Sharma SK, Bhowmik SSD, Kumaria S, Tandon P, Rao SR. Low genetic diversity as revealed by SPAR methods possibly leads to extinction of two critically-endangered and endemic
species of Mantisia. Biol Plant. 2012;56(2):292-300.
19. Chai XY, Chen SL, Xu W. Using inter-simple sequence repeat
markers to analyze the genetic structure of natural Pteroceltis
tatarinowii populations and implications for species conser-vation. Plant Syst Evol. 2010;285(1):65-73.
20. Zhou TH, Wu KX, Qian ZQ, Zhao GF, Liu ZL, Li S. Genetic
diversity of the threatened Chinese endemic plant,
Sinowi-lsonia henryi Hemsi. (Hamamelidaceae), revealed by inter-simple sequence repeat (ISSR) markers. Biochem Syst Ecol. 2014;56:171-7.
21. Silva L, Elias RB, Moura M, Meimberg H, Dias E. Genetic variability and differentiation among populations of the
Azorean endemic Gymnosperm Juniperus brevifolia: baseline
information for a conservation and restoration perspective. Biochem Genet. 2011;49(11):715-34.
22. Yang Q, Fu Y, Wang YQ, Wang Y, Zhang WH, Li XY, Reng YQ, Zhang J. Genetic diversity and differentiation in the critically
endangered orchid (Amitostigma hemipilioides): implications
for conservation. Plant Syst Evol. 2014;300(5):871-9. 23. Ge XJ, Sun M. Reproductive biology and genetic diversity of a
cryptoviviparous mangrove Aegiceras corniculatum
(Myrsina-ceae) using allozyme and inter-simple sequence repeat (ISSR) analysis. Mol Ecol. 1999;8(12):2061-9.
24. Lacerda DR, Acedo MDP, Lemos Filho JP, Lovato MB. Genetic diversity and structure of natural populations of
Plathymenia reticulate (Mimosoideae), a tropical tree from the Brazilian Cerrado. Mol Ecol. 2001;10(5):1143-52. 25. Dostalek T, Munzbergova Z, Plackova I. Genetic diversity and
its effect on fitness in an endangered plant species,
Draco-cephalum austriacum L. Conserv Genet. 2010;11(3):773-83. 26. Sozen E, Ozaydin B. A preliminary study on the genetic
diver-sity of the critically endangered Centaurea nivea (Asteraceae).
Ann Bot Fenn. 2009;46(6):541-8.
27. Nguyen HTT, Choi KS, Park S. Genetic diversity and
differ-entiation of a narrowly distributed and endemic species, Aster
spathulifolius Maxim (Asteraceae), revealed with inter sim-ple sequence repeat markers. J Korean Soc Appl Biol Chem. 2013;56(3):255-62.
28. Luan SS, Chiang TY, Gong X. High genetic diversity vs. low
genetic differentiation in Nouelia insignis (Asteraceae), a
nar-rowly distributed and endemic species in China, revealed by ISSR fingerprinting. Ann Bot. 2006;98(3):583-9.
29. Rossetto M, Weaver PK, Dixon KW. Use of RAPD analysis in devising conservation strategies for the rare and endangered
Grevillea scapigera (Proteaceae). Mol Ecol. 1995;4(3):321-9. 30. Schaal BA, Hayworth DA, Olsen KM, Rauscher JT, Smith
WA. Phylogeographic studies in plants: problems and pros-pects. Mol Ecol. 1998;7(4):65-474.
31. Rajeb C, Messaoud C, Chograni H, Bejaoui A, Boulila A,
Rejeb MN, Boussaid M. Genetic diversity in Tunisian
Cra-taegus azarolus L. var. aronia L. populations assessed using RAPD markers. Ann For Sci. 2010;67(5):512.
32. Chen DX, Li LY, Zhang X, Wang Y, Zhang Z. Genetic diversity
in wild Dipsacus chinensis populations from China based on
ISSR markers. Genet Mol Res. 2013;12(2):1205-13.
33. Harish, Gupta AK, Phulwaria M, Rai MK, Shekhawat NS. Conservation genetics of endangered medicinal
plant Commiphora wightii in Indian Thar Desert. Gene.