ISSN-L: 2501 - 1235 Available on-line at: www.oapub.org/edu
doi: 10.5281/zenodo.1473156 Volume 4 │ Issue 12 │ 2018
DISCRIMINANT ANALYSIS OF ANTHROPOMETRIC
AND BIOMOTOR VARIABLES AMONG GROUPS OF
MALE UNIVERSITY ATHLETES IN THREE SPORTS
Oloo Micky Olutendei,
Jasper Situma Wekesa, Edinah Sabiri Mogaka, Issah Wabuyabo Kweyu
Department of Health Promotion and Sports Science, Masinde Muliro University of Science and Technology,
Kakamega, Kenya
Abstract:
The aim of this study was to identify anthropometric and bio-motor variables that discriminated among groups of university male athletes aged 21.4 ± 2.1 years (mean ± s) from three different sports (soccer, n = 53; rugby, n = 27; basketball, n = 31). Anthropometric parameters included body mass, height and body fat percentage. The bio-motor variables included blood pressure and maximal aerobic power (VO2max) measured using 40meter dash test. Using a cross-sectional design, discriminant analysis was used to determine field tests identifying male university athletes. Young men (n = 111) who were to participate in the East Africa Inter-university games volunteered as subjects (mean ± SD age = 21.4 ± 2.1 years). Discriminant analysis revealed two significant functions (P < 0.05). After validation, the resulting regression equations correctly classified 83.8% of the soccer, rugby and basketball athletes. Six variables significantly contributed to the discriminant analysis (Wilks A = 0.231, x2 = 153.95, df =
14, p < 0.0001, adjusted R2 = 0.788). The interpretation of the obtained discriminant
functions was also based on examination of the structure coefficients greater than 0.30. The athletes were discriminated mainly on height (structure coefficient, SC=0.319), percentage body fat (SC=0.401), Cooper test (SC=0.482), upper body strength (SC=0.404) and abdominal strength (SC=0.253). Our model confirms that university male athletes show physical and bio-motor differences that clearly distinguish them according to their particular sport. Generally, the athletes’ anthropometric and bio-motor variables varied according to sport, probably because of the different training regimens in the different sports that conditioned the athletes differently. In conclusion, these discriminant models could help in player recruitment and improve training programs.
Keywords: talent identification, strength, power, body composition, linear discriminant analysis (LDA), anthropometric, bio-motor, kinanthropometry, multivariate analysis
1. Introduction
Anthropometric and bio-motor characteristics in relation to performance in different sports has been reported by studies in the past; basketball players (Jakovljevic et al.,
2011), volleyball players from colleges and universities of North India (Gaurav & Singh, 2014), wrestlers from Colombia (Ramirez, 2014), Indian elite male hockey players (Koley & Vashisth, 2014), track and field athletes (Singh, 2015), volleyball players (Mielgo et al., 2015), baseball players (Mangine et al., 2015), softball players (Wentzel & Travill, 2015) water sports athletes (Akca, 2014), football players (Brahim, Bougatfa & Mohamed, 2013), handball players (Zapartidis, 2009) and gymnastic players (Douda, 2008). Over the past few years, attention has been focused on the description of bio-motor and anthropometric variables that distinguish between elite athletes from different sports (Smith & Thomas, 1991; Gualdi-Russo et al., 1992; Loko et al., 2000). The significant role of anthropometric characteristics in sport performance besides other factors is well known. Body composition and somatotype of a sportsman has a significant role in sports performance besides other factors like physiological and physical fitness, psychological aspects, skills etc. Requirement of specific physique for good performance in particular sports had been supported by different studies (Carter & Heath, 1990).
2. Methods
One hundred and eleven university athletes aged between 17 and 28 years (mean age 21.4 ± 2.1, CI 21.0-21.8 years) participated in this study. The sample included subjects from three different sports; soccer (n=53), rugby (n=27), basketball (n=31). The investigation took place among participants in the selection of athletes to participate in East Africa Inter University games. Written consent was obtained from all subjects. Variables in our study were of two categories: Anthropometric and bio-motor variables. Anthropometric parameters: body mass, height and body fat percentage. All measurements were taken according to standardized procedures (Callaway et al., 1988). Body weight (kg) was determined with a certified digital scale used for official weigh-ins for each competition. Height (cm) was determined using a wall scale and a Broca plane with the head held in the Frankfort plane. The bio-motor variables included blood pressure and maximal aerobic power (VO2max) measured using Cooper test. Muscular strength was assessed by two tests; push-ups for upper body strength and sit-ups for abdominal strength (Leone & Léger, 1985). All variables were chosen from a battery of tests, and came from the wide variety which has previously been used to describe athletic populations (MacDougall et al., 1988; Carter & Ackland, 1994).
Although most of the tests administered are very standardized and well recognized assessments, test-retest re- liability on the specific subject pool used in the present study could not be obtained. To counter this potential problem, all testers were thoroughly trained and familiarized with proper test administration prior to actual data collection. Additionally, all tests were administered by the same tester to avoid intertester errors. The discriminant analysis is considered to be robust with these variables (Norusis, 1993).
participant. The process is repeated for each participant (n times) and the percentage of correct classifications generated through averaging for the n trials.
Data analysis was done using the statistical program for social sciences (SPSS) version 25. In this study the study variables were assessed by a two-tailed probability value of p<0.05 for significance. Schlomer et al. (2010) outlined guidelines for best practices regarding the handling and reporting of missing data within research. Visual inspection of the data illustrated that missing data appeared to be missing at random. Their guidelines were considered when reviewing the missing data for the current research study. Homogeneity of between groups variance covariance matrix was checked using the Box M test. All assumption for conducting the discriminant analysis were met before undertaking the test. Alpha level for all the computations was considered p <0.05.
3. Results
Means and standard deviations for the four groups of athletes are presented in Table 1. The global test for equality of the mean vectors for the four groups was significant (Hotelling’s T, P<0.01), which showed that the groups were different in all variables except in systolic blood pressure which yielded a statistically non-significant result (see table 2). The Box’s M test was not significant (approximate value of F=140.5, P=0.205), which indicated homogeneous variance-covariance matrices for each group (Norusis, 1993).
Table 1: Descriptive results from the anthropometric and bio-motor variables for the three sports (values are mean, ±SD)
Variable Soccer Rugby Basketball
Height 170.1±9.25 175.25±7.1 178.61±6.86
Weight 65.65±16.67 78.46±5.41 67.24±9.82
Systolic 118.85±17.09 120.78±17.34 118.77±17.25
Abdominal strength 41.96±8.78 51.81±11.36 47.90±12.17
Upper body strength 38.69±10.61 57.85±14.95 50.06±14.07
% body fat 20.01±5.49 27.32±6.51 20.97±4.65
Cooper test 39.82±1.79 42.3±0.84 39.2±2.09
Table 2: Test of equality of group means
Variable Wilks' Lambda F df1 df2 Sig.
Height .827 11.275 2 108 .000
Weight .854 9.254 2 108 .000
Systolic .997 .145 2 108 .865*
Abs Strength .862 8.636 2 108 .000
UBS .713 21.756 2 108 .000
% body fat .768 16.354 2 108 .000
Cooper test .669 26.675 2 108 .000
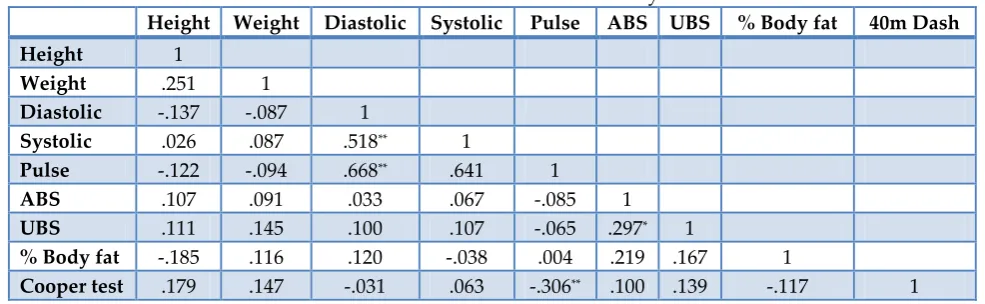
The 7 variables selected for inclusion in the discriminant analysis exhibited low shared variances, as exhibited by their common zero-order correlation coefficients (see Table 3). The only exception to this was the shared variance for systolic blood pressure and diastolic blood pressure (r2 = 0.27), systolic blood pressure and pulse (r2 = 0.41). Hence, pulse and diastolic blood pressure were excluded from the discriminant analysis.
Table 3: Common zero-order correlation coefficients (r) of variables selected for inclusion in the discriminant analysis
Height Weight Diastolic Systolic Pulse ABS UBS % Body fat 40m Dash
Height 1
Weight .251 1
Diastolic -.137 -.087 1
Systolic .026 .087 .518** 1
Pulse -.122 -.094 .668** .641 1
ABS .107 .091 .033 .067 -.085 1
UBS .111 .145 .100 .107 -.065 .297* 1
% Body fat -.185 .116 .120 -.038 .004 .219 .167 1
Cooper test .179 .147 -.031 .063 -.306** .100 .139 -.117 1
ABS- Abdominal strength; UBS-Upper body strength; *-statistically significant
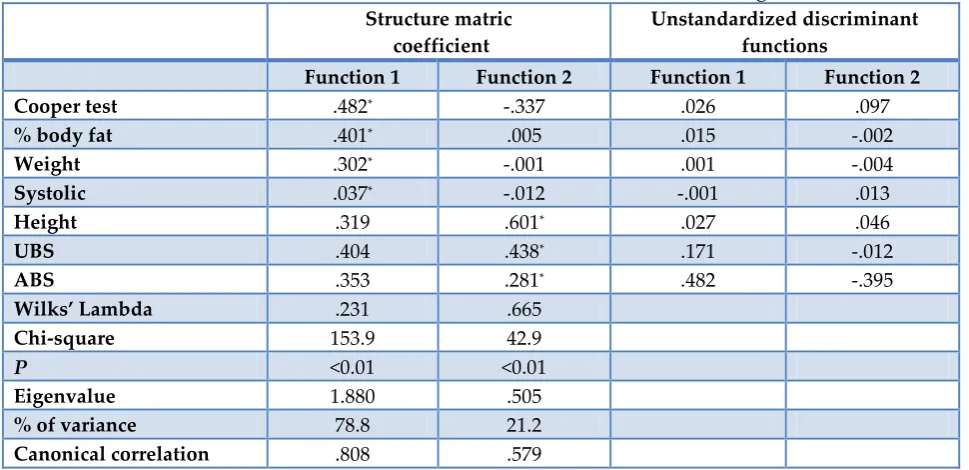
The structure coefficients quantify the potential of each variable to maximize differences between means amongst the soccer, rugby and basketball player. The larger the magnitude of the coefficients, the greater the contribution of that variable to the discriminant function. Multiple discriminant analysis revealed two significant functions (Table 5). Based on values of Wilk’s lambda, discriminant function 1 accounted for 78.8% of the variance, while discriminant functions 2 explained 21.2% of the remaining variance between groups respectively. Unstandardized coefficients allow the derivation of discriminant scores for each individual.
Based on these scores, group membership could be predicted according to the proximity of the respective group centroid values (mean group values) (see Table 4). It is then possible to determine correct classifications. The more correct classifications, the more efficient the model.
Table 4: Functions at group centroids
Function 1 Function 2
Soccer -.912 -.561
Rugby 2.366 -.157
Basketball -.502 1.095
Table 5: Discriminant function coefficients and tests of statistical significance
Structure matric coefficient
Unstandardized discriminant functions
Function 1 Function 2 Function 1 Function 2
Cooper test .482* -.337 .026 .097
% body fat .401* .005 .015 -.002
Weight .302* -.001 .001 -.004
Systolic .037* -.012 -.001 .013
Height .319 .601* .027 .046
UBS .404 .438* .171 -.012
ABS .353 .281* .482 -.395
Wilks’ Lambda .231 .665
Chi-square 153.9 42.9
P <0.01 <0.01
Eigenvalue 1.880 .505
% of variance 78.8 21.2
Canonical correlation .808 .579
UBS- Upper body strength; ABS- Abdominal strength; P- alpha value
The original classification summary shows 84.7% of the cases correctly classified in their respective sports (Table 6). This is significant when compared to the proportional chance (p < 0.05). The leave-one-out test summarizes the ability of the discriminant functions to correctly classify the players in their respective sports (see Table 6). This analysis provided an overall percentage of successful classification of 86.8% for the soccer players, 92.6%% for the rugby players and 71% for the basketball players. Notably, almost all soccer and rugby players were correctly classified on the basis of their anthropometric and bio-motor scores.
Table 6: Classification matrix for the sports according to anthropometric and bio-motor variables of the discriminant functions
Soccer Rugby Basketball Total
Original % Soccer (n=53) 88.7 3.8 7.5 100.0
Rugby (n=27) 7.4 92.6 .0 100.0
Basketball (n=31) 25.8 3.2 71.0 100.0
Cross-validated % Soccer (n=53) 86.8 5.7 7.5 100.0
Rugby (n=27) 7.4 92.6 .0 100.0
Basketball (n=31) 22.6 6.5 71.0 100.0
84.7% of original grouped cases correctly classified; 83.8% of cross-validated grouped cases correctly classified
4. Discussion
of the variability among groups (78.8%) was accounted for by the first discriminant function; this reflected differences in anthropometric and bio-motor variables between soccer players and the other groups of athletes. The results in Table 1 show that soccer players obtained the lowest values for all anthropometric variables. This was particularly true for body mass (65.65±16.67) and height (170.1±9.25). Basketball players had the highest mean in height (178.61±6.86). At the moderate to high levels of basketball competition, success can be mostly dependent on the recruitment of players with complementary skills who are capable of performing according to the demands of the game (Ige & Kleiner, 1998). Studies reveal that height can play a significant role in contributing to success in some sports by offering certain natural advantages. For those sports where this could be a contributing factor, height can be useful (although certainly not in all cases and is not the only factor) since in general it affects the leverage between muscle volume and bone towards greater speed of movement and power, depending on overall build, fitness and individual ability. (Carter, 1984)
Studies done on basketball players, have shown differences between anthropometric and physiological measures of individuals especially height (Ackland, Schreiner, & Kerr, 1997; Bale, 1991; Smith & Thomas, 1991). Height is a significant contributor in the model with a structure coefficient of .319 and .601 in function 1 and function 2 respectively and plays an important role in discriminating basketball players from soccer and rugby players. The results of this study are new insights to the understanding of ball games. In fact, the results describe precisely the actions that distinguish players by their sport and allow us to better understand how team performance depends upon players with complementary skills. This study did not factor female athletes but studies concerning female basketball players have shown they have different anthropometric and physiological measures (Ackland, Schreiner, & Kerr, 1997; Bale, 1991; Smith & Thomas, 1991). The findings of this study also show that weight is a significant contributor to the discriminant model with a structure coefficient of .302 in function 1. Recent studies showed that body mass index (BMI), reflecting greater muscle mass rather than greater adiposity, is the important factor associated with best performance for the world-class sprinters. The study also revealed that in track and field athletes, the reciprocal ponderal index (RPI) was an important indicator of best performance with tall and lean body type (Watts, Coleman & Nevill, 2011). However a recent study by Anup, Nahida, Nazrul Islam, & Kitab, (2014) supported the decade long hypothesis for encouraging the ectomorphic mesomorph body type for the sprinting athletes with higher reciprocal Ponderal index. Percentage body fat was the second largest discriminator with a structure coefficient of .401 in function 1. Negative relationship between sports performance especially sprinting events and adiposity in terms of body fat percentage were revealed by different studies though some of the studies showed less relationship of body fat percentage with endurance activity in terms of maximum oxygen consumption (Sporis et al., 2011).
male athletes in soccer, basketball, football, ice hockey, body building, wrestling, baseball, tennis and powerlifting. However track and field athletes possessed as low as 3.3% body fat for the marathon runners whereas the male sprinters and discus throwers reported to be with a higher value of 16.4%(Anup et al., 2014). Previously reported talent identification test batteries of sports like weightlifting have included or suggested tests for relative fat (Richter,1983), height and weight (Smalcerz, 1994), However as noted by (Fry et al., 2006) many of the characteristics measured may be important contributors for high-level performance in a variety of sports like rugby. From the findings anthropometric variables had more discriminating abilities compared to bio-motor variables.
A study done by Leone, Lariviere, & Comtois, (2002) revealed that in the discriminant analysis, the anthropometric variables contributed more to the model than the motor variables. When the discriminant analysis was repeated without the bio-motor variables, 78% of the athletes were correctly classified, whereas 60% were when the anthropometric variables were excluded from the analysis. (Leone et al., 2002). These results actually confirm that each sport is characterized by athletes with particular anthropometric and bio-motor profiles, conforming previous observations (Housh et al., 1984; Watson, 1988). In general, it would be helpful to develop talent identification test batteries that would provide the most information using the fewest number of simply-administered field tests. If the identification of variables that characterize athletes of different sports is of interest to understand what distinguishes them, their relative contribution is also important (Leone, Lariviere, & Comtois, 2002). There are clear training effects between sports. Thus, the training specific to a particular sport may play an important role in defining certain inter-sport bio-motor difference (Leone, Lariviere, & Comtois, 2002).
5. Conclusions
In this study, we present a model that could be used to predict the sports of an athlete from a number of anthropometric and bio-motor variables. This could be employed to orientate the training of athletes towards a specific sport, but could also be of use in improving performance in deficit areas. Further studies are required to construct models that include sprinters and long-distance runners (marathon). Hence, it could be concluded that anthropometrical characteristics were one of most influential factors in determining good athletic performances in specific sports besides other physiological characteristics.
Reference
Ackland, T., Schreiner, A., & Kerr, D. (1997). Absolute size and proportionality characteristics of World Championship female basketball players. Journal of Sports Sciences, 15, 485-490.
Akca, F. (2014). Prediction of rowing ergometer performance from functional anaerobic power, strength and anthropometric components. Journal of Human Kinetics,
41,133-142.
Akers, M., Wolff, S., & Buttross, T. (1991). An empirical examination of the factors affecting the success of NCAA division I college basketball teams. Journal of Business and Economic Studies, 1,57-71.
Anup, A., Nahida, P., Nazrul Islam, R., & Kitab, A. (2014). Importance of Anthropometric Characteristics in Athletic Performance from the Perspective of Bangladeshi National Level Athletes’ Performance and Body Type. American Journal of Sports Science and Medicine, 2(4), 123–127.
https://doi.org/10.12691/ajssm-2-4-1.
Bale, P. (1991). Anthropometric, body composition and performance variables of young elite female basketball players. Journal of Sports Medicine and Physical Fitness, 31, 173-177.
Brahim, M.B., Bougatfa, R. and Mohamed, A. (2013). Anthropometric and physical characteristics of Tunisians young soccer players. Advances in Physical Education, 3(3),125-130.
Carter, J.E.L, Heath, B.H. (1990). Somatotyping – development and application. Cambridge, Cambridge University Press.
Carter, J.E.L. (1984). Physical Structure of Olympic athletes, Part II, Kinanthropometry of Olympic Athletes, Ed Karger, Basel.
Fry, A. C., Ciroslan, I. D., & Schilling, B. K. (2006). Anthropometric and Performance Variables. J Strength Cond Res, 20(4), 861–866.
Gaurav, V., Singh, A. (2014). Anthropometric characteristics of Indian volleyball players in relation to their performance level. Turkish Journal of Sport and Exercise, 16(1):87-89.
Gualdi-Russo, E.G., Gruppioni, G., Gueresi, P., Belcastro, M.G. and Marchesini, V. (1992). Skinfolds and body com- position of sports participants. Journal of Sports Medicine and Physical Fitness, 32, 303-313.
Housh, T.J., Thorland, W.G., Johnson, G.O. and Tharp, G.D. (1984). Body build and composition variables as discriminators of sports participation of elite adolescent male athletes. Journal of Sports Medicine and Physical Fitness, 24, 169-174.
Housh, T.J., Thorland, W.G., Johnson, G.O., Tharp, G.D. and Cisar, C.J. (1984). Anthropometric and body build variables as discriminators of event participation in elite adolescent male track and field athletes. Journal of Sports Sciences, 2, 3-11.
Ibanez, S., Sampaio, J., Saenz-Lopez, P., Gimenez, J., & Janeira, M. (2003). Game statistics discriminating the final outcome of junior world basketball championship matches (Portugal 1999). Journal of Human Movement Studies, 45,1-19.
Ige, C., & Kleiner, B. (1998). How to coach teams in business: The John Wooden way.
Management Research News, 1,9-12.
Jakovljevic, S., Karalejic, M., Pajic, Z., Gardasevic, B. and Mandic, R. (2011). The influence of anthropometric characteristics on the agility abilities of 14-year-old elite male basketball players. Physical Education and Sport, 9(2),141-149.
Koley, S., Vashisth, D. (2014). Correlations of back endurance with anthropometric variables and performance tests in Indian elite male hockey players. Human Biology Review, 3(2),175-183.
Leone, M., Lariviere, G., & Comtois, A. S. (2002). Discriminant analysis of anthropometric and biomotor variables among elite adolescent female athletes in four sports. / Analyse discriminante des variables anthropometriques et biomotrices chez des adolescentes, athletes de haut niveau dans quatre sports .
Journal of Sports Sciences, 20(6), 443–449. Retrieved from
http://www.tandf.co.uk/journals%5Cnhttp://articles.sirc.ca/search.cfm?id=S-824353%5Cnhttp://search.ebscohost.com/login.aspx?direct=true&db=s3h&AN=S PHS-824353&lang=pt-br&site=ehost-liv
Loko, J., Aule, R., Sikkut, T., Ereline, J. and Viru, A. (2000). Motor performance status in 10- to 17-year-old Estonian girls. Scandinavian Journal of Medicine and Science in Sports, 10, 109-113.
Mangine, G.T., Hoffman, J.R., Vazquez, J., Pichardo, N., Fragala, M.S. and Stout, J.R. (2013). Predictors of fielding performance in professional baseball players.
Mielgo-Ayuso, J., Zourdos, M.C., Calleja-González, J., Urdampilleta, A. and Ostojic, S.M. (2015). Dietary intake habits and controlled training on body composition and strength in elite female volleyball players during the season. Applied Physiology, Nutrition and Metabolism,40(8),827-834.
Norusis, M. (1993). SPSS for windows release 6.0. Chicago: SPSS Inc.
Pollock, M.L., Jackson, A.S. and Pate, R.R. (1980). Discriminant analysis of physiological differences between good and elite distance runners. Research Quarterly for Exercise and Sport, 51, 521-532.
Ramirez-Velez, R., Argothyd, R., Meneses-Echavez, J.F., Sanchez-Puccini, M.B., Lopez- Alban, C.A. and Cohen, D.D. (2014). Anthropometric characteristics and physical performance of Colombian elite male wrestlers. Asian Journal of Sports Medicine, 5(4), e23810.
Richter, G. (1983). Special problems in selection for weightlifting training. In: The Proceedings of the I.W.F. Coaching-Medical Seminar—Varna 1983. C Meranzov, ed. Budapest, International Weightlifting Federation. pp. 9-12.
Sampaio, J., & Janeira, M. (2003). Statistical analyses of basket- ball team performance: understanding teams’ wins and losses according to a different index of ball possessions. International Journal of Performance Analysis in Sport, 3,40-49.
Schlomer, G. L., Bauman, S., & Card, N. A. (2010). Best practices for missing data management in counseling psychology. Journal of Counseling Psychology, 57(1), 1-10. doi:1-10.1037/a0018082.
Singh, S.P. (2015). Relationship among the anthropometric variable and jumping performance in track and field. Online International Interdisciplinary Research Journal, 5,207-210.
Smalcerz, Z. (1994). Selection and training process for junior weightlifters in Poland. Paper presented at: U.S. Weightlifting Federation Elite Coaching Conference, Colorado Springs, CO.
Smith, H.K. and Thomas, S.G. (1991). Physiological characteristics of elite female basketball players. Canadian Journal of Sport Sciences, 16, 289-295.
Sporis, G., Jukic, I., Bok, D., Vuleta, D. Jr. and Harasin, D. (2011). Impact of body composition on performance in fitness tests among personnel of the Croatian navy, Coll Anthropol, 35 (2), 335-339, 2011.
Tabachnick, B., & Fidell, L. (2000). Using multivariate statistics. Boston: Pearson Allyn & Bacon
Watson, A.W.S. (1988). Discriminant analysis of the physiques of schoolboy rugby players and non-team members. Journal of Sports Sciences, 6, 131-140.
Watts, A.S., Coleman, I., Nevill, A. (2011) The changing shape characteristics associated with success in world-class sprinters. J Sports Sci, 14: 701-718, 2011.
Creative Commons licensing terms