ISSN-L: 2501 - 1235 Available on-line at: www.oapub.org/edu
Copyright © The Author(s). All Rights Reserved.
doi: 10.5281/zenodo.1286383 Volume 4 │ Issue 8 │ 2018
EFFECT OF SHORT-TERM CHANDRA NADI PRANAYAMA ON
HEMATOLOGICAL PARAMETERS: COMPARATIVE STUDY
Baljinder Singh Bali Gurjit Singh 1Department of Physical Education (T),
Guru Nanak Dev University, Amritsar, Punjab, India
Abstract:
The aim of this study was to assess the effect of short-term Chandra nadi pranayama on Hematological Parameters. Thirty, university level girls of Department of Physical Education (T), Guru Nanak Dev University, Amritsar between the age group of 21-26 years volunteered to participate in the study. The subjects from Group-A: Experimental, were subjected to a 3-week Chandra nadi pranayama. Statistical analyses were performed using the Statistical Package for the Social Sciences for Windows version 10.0 software (SPSS Inc., Chicago, IL). Data is expressed as the Mean ± SD. Student t-test for Paired Samples was utilized to compare the means of the Pre-Test and the Post-Test. To test the Hypothesis, the level of significance was set at 0.05. To conclude, it is significant to mention in relation to Hemoglobin (Hb), Total Cholesterol (TC), Low Density Lipoprotein Cholesterol (LDL-Cholesterol), High Density Lipoprotein Cholesterol (HDL-Cholesterol) and Triglycerides (TG) that results of Paired Sample t-test were found statistically insignificant (P >.05).
Keywords: Chandra nadi pranayama, hemoglobin, total cholesterol, low density lipoprotein cholesterol, high density lipoprotein cholesterol, triglycerides
1. Introduction
In Indian religions, yoga is ‚the means or techniques for transforming consciousness and attaining liberation (moksha) from karma (Ankerberg, 1996) and rebirth (samsara)” (Bowker, 1997).
Yoga breathing, or Pranayama, is the science of breath control. It consists of series of exercises especially intended to meet the body's needs and keep it in vibrant health. Pranayama comes from the following words:
Prana - "life force" or "life energy"
Yama - "discipline" or "control"
Ayama - "expansion", "non-restraint", or "extension"
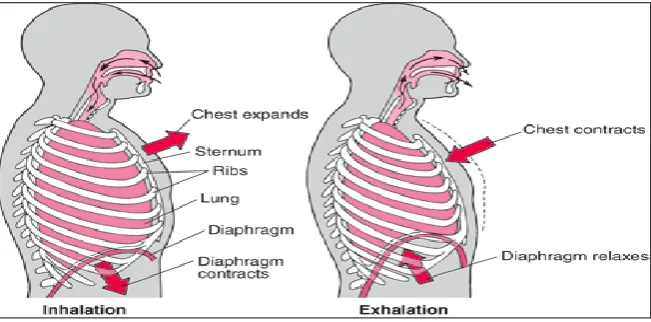
The process – the passage of air into and out of the lungs – is movement; specifically, it is movement in the body’s cavities. This simplified illustration of the human body in Figure-1 shows that the torso consists of two cavities, thoracic and abdominal.
Yoga -a way of life- is marked with certain qualities namely balance, health, harmony, and bliss (Nagendra & Nagarathna, 1977). Inflating the matter into wider semantic denominations, Meditation-being part of yoga, which is the seventh limb of, is a state of alert rest as stated by (Maharishi Mahesh Yogi, 1972), who founded a new technique of meditation, popularly known as transcendental meditation. By Yogic participation, a person is supposed to reach a state of mental composure, where responses to favorable or unfavorable external events are well under the individual’s control, and responses are moderate in intensity (Telles et al., 2000).
Figure 1: Breathing is thoracoabdominal shape changes between (a) inhalation and (b) exhalation
2. Material and Methods
2.1 Selection of Subjects
Thirty, university level girls of Department of Physical Education (T), Guru Nanak Dev University, Amritsar between the age group of 21-26 years volunteered to participate in the study. The subjects were purposively assigned into two groups:
Group-A: Experimental (N1=15)
Group-B: Control (N2=15)
All the subjects were informed about the objective and protocol of the study.
2.2 Selection of Variables
iv. High Density Lipoprotein Cholesterol (HDL-Cholesterol) v. Triglycerides (TG)
3. Methodology
This study is designed as a retrospective Cross-Sectional study. The subjects from Group-A: Experimental were subjected to a 3-week Chandra nadi pranayama. This lasted 3 weeks and consisted of daily sessions. Hemoglobin was determined in the blood samples of all the subjects with the use of a hematology analyzer (Celldyne model 3500). Blood samples (10 ml) for the determination of lipid profiles were obtained.
All of Biochemical tests have been done with serum samples. Lipid parameters were measured using Boehringer Mannheim kits and Clinilab, BioMerieux analyser as used by (Jastrzebska et al., 2002).
Figure 2: Study design
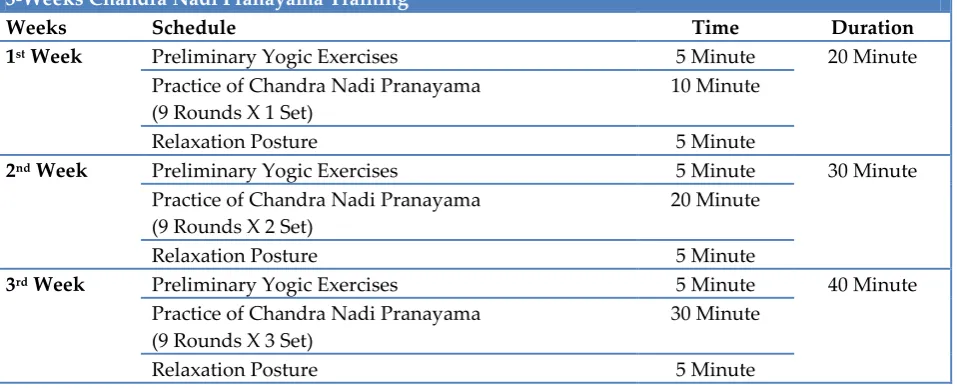
Table 1: Experimental Treatment
3-Weeks Chandra Nadi Pranayama Training
Weeks Schedule Time Duration
1st Week Preliminary Yogic Exercises 5 Minute 20 Minute
Practice of Chandra Nadi Pranayama (9 Rounds X 1 Set)
10 Minute
Relaxation Posture 5 Minute
2nd Week Preliminary Yogic Exercises 5 Minute 30 Minute
Practice of Chandra Nadi Pranayama (9 Rounds X 2 Set)
20 Minute
Relaxation Posture 5 Minute
3rd Week Preliminary Yogic Exercises 5 Minute 40 Minute
Practice of Chandra Nadi Pranayama (9 Rounds X 3 Set)
30 Minute
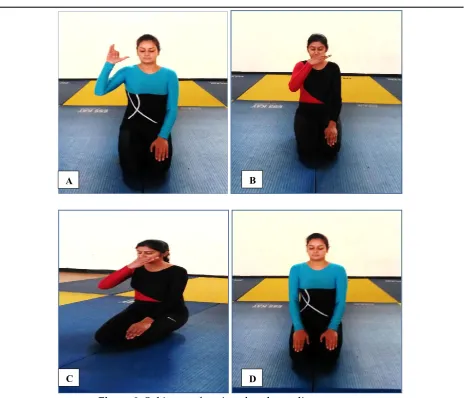
Figure 3: Subject performing chandra nadi pranayama
Figure 4: Biochemical tests with serum samples
4. Statistical Analysis
A B
C D
Data is expressed as the Mean ± SD. Student t-test for Paired Samples was utilized to compare the means of the Pre-Test and the Post-Test. To test the Hypothesis, the level of significance was set at 0.05.
5. Results
Table 2: Descriptive Statistics (Mean & Standard Deviation) and Paired Sample t-test of Hemoglobin (Hb) of University Level Girls
Hemoglobin (Hb)
Group Number Mean Standard Deviation t-value
Experiment (Pre-test) Experimental (Post-test) 15 15 11.7133 11.6533 0.4926 0.3292 0.3427 Control (Pre-test) Control (Post-test) 15 15 12.28 12.3067 0.8179 0.9098 0.0758
The calculated t value is smaller than critical value (0.3427<2.145), so the means are not significantly different with regards to Hemoglobin (Hb) in group (Experimental).
The absolute value of the calculated t is smaller than critical value (0.0758<2.145), so the means are not significantly different with regards to Hemoglobin (Hb) in group (Control).
Table 3: Descriptive Statistics (Mean & Standard Deviation) and Paired Sample t-test of Total Cholesterol (TC) of University Level Girls
Total Cholesterol (TC)
Group Number Mean Standard Deviation t-value
Experiment (Pre-test) Experimental (Post-test) 15 15 155.4133 154.8067 2.2405 2.3051 0.7574 Control (Pre-test) Control (Post-test) 15 15 141.0333 139.74 13.1148 13.3036 0.273
The calculated t value is smaller than critical value (0.7574<2.145), so the means are not significantly different with regards to Total Cholesterol (TC) in group (Experimental).
The calculated t value is smaller than critical value (0.273<2.145), so the means are not significantly different with regards to Total Cholesterol (TC) in group (Control).
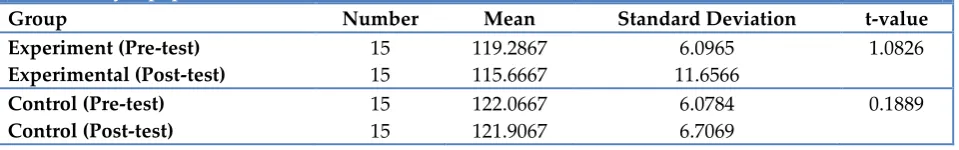
Table 4: Descriptive Statistics (Mean & Standard Deviation) and Paired Sample t-test of Low Density Lipoprotein Cholesterol (LDL-Cholesterol) of University Level Girls
Low Density Lipoprotein Cholesterol (LDL-Cholesterol)
Group Number Mean Standard Deviation t-value
The calculated t value is smaller than critical value (1.0826<2.145), so the means are not significantly different with regards to Low Density Lipoprotein Cholesterol (LDL-Cholesterol) in group (Experimental).
The calculated t value is smaller than critical value (0.1889<2.145), so the means are not significantly different with regards to Low Density Lipoprotein Cholesterol (LDL-Cholesterol) in group (Control).
Table 5: Descriptive Statistics (Mean & Standard Deviation) and Paired Sample t-test of High Density Lipoprotein Cholesterol (HDL-Cholesterol) of University Level Girls
High Density Lipoprotein Cholesterol (HDL-Cholesterol)
Group Number Mean Standard Deviation t-value
Experiment (Pre-test) Experimental (Post-test) 15 15 88.99 90.0947 5.7042 3.7666 0.542 Control (Pre-test) Control (Post-test) 15 15 86.942 90.102 4.4474 4.1995 1.6786
The absolute value of the calculated t is smaller than critical value (0.542<2.145), so the means are not significantly different with regards to High Density Lipoprotein Cholesterol (LDL-Cholesterol) in group (Experimental).
The absolute value of the calculated t is smaller than critical value (1.6786<2.145), so the means are not significantly different with regards to High Density Lipoprotein Cholesterol (LDL-Cholesterol) in group (Control).
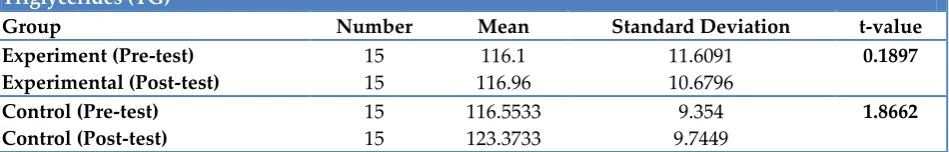
Table 6: Descriptive Statistics (Mean & Standard Deviation) and Paired Sample t-test of Triglycerides (TG) of University Level Girls
Triglycerides (TG)
Group Number Mean Standard Deviation t-value
Experiment (Pre-test) Experimental (Post-test) 15 15 116.1 116.96 11.6091 10.6796 0.1897 Control (Pre-test) Control (Post-test) 15 15 116.5533 123.3733 9.354 9.7449 1.8662
The absolute value of the calculated t is smaller than critical value (0.1897<2.145), so the means are not significantly different with regards to Triglycerides (TG) in group (Experimental).
Figure 5: t-value for the experimental and control groups scores of hematological parameter
6. Conclusions
To conclude, it is significant to mention in relation to Hemoglobin (Hb), Total Cholesterol (TC), Low Density Lipoprotein Cholesterol (LDL-Cholesterol), High Density Lipoprotein Cholesterol (HDL-Cholesterol) and Triglycerides (TG) that results of Paired Sample t-test were found statistically insignificant (P > .05).
References
1. Ankerberg J, (1996). In J. Weldon (Ed.), ‘Yoga’ in Encyclopedia of New Age Belief. (pp. 593-610). United States: Harvest House Publishers.
2. Bowker J. (1997). The Oxford Dictionary of World Religions. New York: Oxford University Press. 1058-9.
3. Jastrzębska, M., Foltynska, A., Torbus-Lisiecka, B., Chelstowski, K., Pieczul-Mroz, J., & Klimek, K. (2002). Fibrinogen and von Willebrand Factor Levels in Relation to Lipid Profile and Blood Pressure in Children Whose Fathers Have a History of Premature Myocardial Infraction. Polish Heart Journal, 56, 488-495. 4. Maharishi, M. Y. (1972). The Science and Art of Living. Los Angeles. New York:
International SRM Publications.
5. Nagendra, H. R., & Nagarathna, R. (1977). New Perspective in Stress Management. Bangalore: Vivekananda Kendra Parkashana.
Creative Commons licensing terms