Open Access
Correction
Physiological models of body composition and human obesity
David G Levitt*
1
, Steven B Heymsfield
2
, Richard N Pierson Jr
3
,
Sue A Shapses
4
and John G Kral
5
Address: 1Department of Integrative Biology and Physiology, University of Minnesota, 321 Church Street SE, Minneapolis, MN 55455, USA, 2Merck & Co, 126 E. Lincoln Avenue, PO Box 2000, RY34-A238, Rahway, NJ 07065-0900, USA, 3St. Luke's-Roosevelt Hospital, Columbia
University College of Physicians and Surgeons, NY Body Composition Unit, 114th street and Amsterdam Avenue, NY, NY 10025, USA,
4Department of Nutritional Sciences, Rutgers University, 96 Lipman Drive, New Brunswick, NJ 08901, USA and 5Department of Surgery, SUNY
Downstate Medical Center, Box 40, 450 Clarkson Avenue, Brooklyn, NY 11203, USA
Email: David G Levitt* - [email protected]; Steven B Heymsfield - [email protected];
Richard N Pierson - [email protected]; Sue A Shapses - [email protected]; John G Kral - [email protected] * Corresponding author
Abstract
Correction to Levitt DG, Heymsfield SB, Pierson Jr RN, Shapses SA, Kral JG: Physiological models
of body composition and human obesity.
Nutrition & Metabolism
2007,
4
:19
Published: 16 February 2009
Nutrition & Metabolism 2009, 6:7 doi:10.1186/1743-7075-6-7
Received: 13 February 2009 Accepted: 16 February 2009
This article is available from: http://www.nutritionandmetabolism.com/content/6/1/7
© 2009 Levitt et al; licensee BioMed Central Ltd.
Table 3: Caucasian males: Dependence of fat fraction on age for two BMI ranges.
BMI Range Ave age (SD) Age range Ave BMI Ave Fat Fraction N
18 – 24 21.86 (2.44) 18 – 25 22.19 (1.08) 0.1193 (.046) 29
29.94 (2.36) 26 – 33 22.12 (1.34) 0.134 (.048) (NS) 32
52.83 (19.42) 34 – 84 22.39 (1.31) 0.173 (.057) (p < .01) 30
24 – 44 25.94 (2.66) 21 – 30 27.64 (4.00) 0.188 (.084) 47
38.17 (5.07) 31 – 48 27.42 (3.96) 0.211 (.072) (NS) 48
66.25 (10.69) 49 – 97 27.93 (3.41) 0.284 (.075) (p < .01) 47
The p values are for comparisons to the closest younger age group.
Table 4: Caucasian females: Dependence of fat fraction on age for three BMI ranges.
BMI Range Ave age (SD) Age range Ave BMI Ave Fat Fraction N
17 – 22 24.95 (3.41) 18 – 30 20.00 (1.38) 0.219 (.045) 42
38.04 (5.87) 30 – 49 20.60 (1.07) 0.241 (.056) (p < .05) 42
63.32 (11.18) 49 – 89 20.55 (1.01) 0.298 (.053) (p < .01) 40
22 – 25.9 26.14 (4.72) 18 – 33 23.30 (1.03) 0.26 (.049) 43
39.12 (4.91) 33 – 51 23.45 (1.05) 0.30 (.055) (p < .01) 41
68.12 (10.47) 52 – 88 24.12 (1.15) 0.36 (.059) (p < .01) 39
26 – 56 34.94 (6.198) 21 – 45 31.19 (6.12) 0.408 (.074) 36
54.0 (4.69) 46 – 61 31.72 (5.89) .428 (.056) (NS) 35
70.49 (6.87) 62 – 90 29.36 (2.68) 0.414 (.053) (NS) 35
The p values are for comparisons to the closest younger age group
Correction
Since publication of our first article [1] we have noticed
that the following corrections needed to be made. There is
an error in the calculation of the body fat in the original
version of this article. The tritium distribution space was
not properly corrected for non-aqueous hydrogen
exchange and water density resulting in estimates of
per-c
Table 5: Ethnic dependence of BMI versus fat fraction for males.
N Age range (ave) BMI range (ave) Ave Fat Fract. (SD)
Caucasian 129 20 – 57 (37.4) 22 – 34 (25.42) 0.321 (0.071)
Black 95 20 – 52 (37.8) 20 – 34 (26.57) 0.328 (0.074) (NS)
Hispanic 37 20 – 60 (36.1) 20 – 34 (25.40) 0.311 (0.09) (NS)
Puerto Rican 41 20 – 52 (35.7) 20 – 30 (26.18) 0.348 (0.058) (p < .05)
Caucasian 153 23 – 53 (35.41) 17 – 25 (21.72) 0.257 (.061)
Asian 35 23 – 53 (36.7) 17 – 28 (21.25) 0.282 (.066) (p = 0.07)
The age range of the Caucasians was adjusted to match the age range of the comparison group. The p values are for comparisons between the ethnic group and Caucasians.
Table 6: Ethnic dependence of BMI versus fat fraction for females.
N Age range (ave) BMI range (ave) Ave Fat Fract. (SD)
Caucasian 129 20 – 57 (37.4) 22 – 34 (25.42) 0.321 (0.071)
Black 95 20 – 52 (37.8) 20 – 34 (26.57) 0.328 (0.074) (NS)
Hispanic 37 20 – 60 (36.1) 20 – 34 (25.40) 0.311 (0.09) (NS)
Puerto Rican 41 20 – 52 (35.7) 20 – 30 (26.18) 0.348 (0.058) (p < .05)
Caucasian 153 23 – 53 (35.41) 17 – 25 (21.72) 0.257 (.061)
Asian 35 23 – 53 (36.7) 17 – 28 (21.25) 0.282 (.066) (p = 0.07)
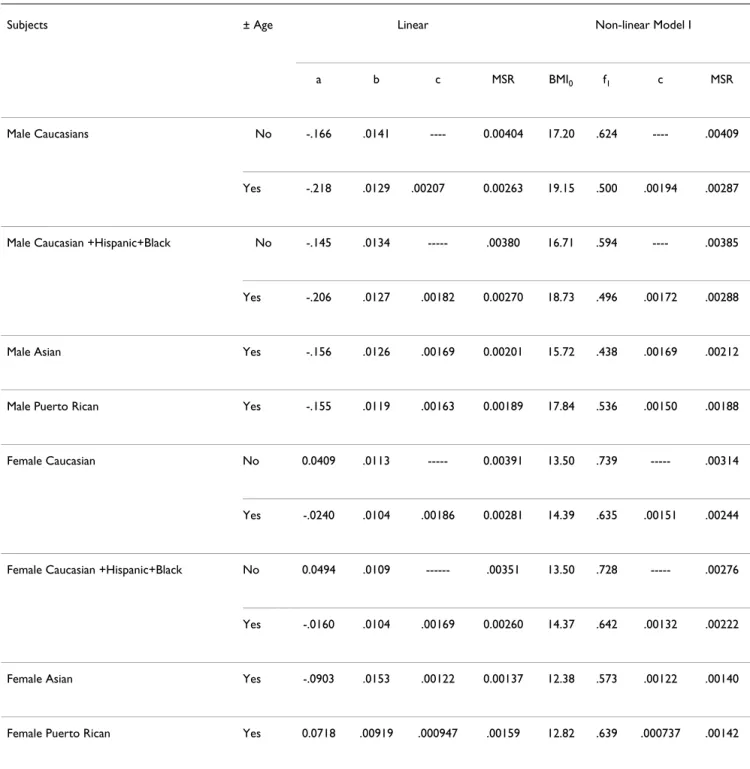
Table 7: Comparison of linear (eq. (16)) and non-linear (eq. (9)) regression expressions for predicting body fat fraction from BMI and age.
Subjects ± Age Linear Non-linear Model I
a b c MSR BMI0 f1 c MSR
Male Caucasians No -.166 .0141 ---- 0.00404 17.20 .624 ---- .00409
Yes -.218 .0129 .00207 0.00263 19.15 .500 .00194 .00287
Male Caucasian +Hispanic+Black No -.145 .0134 --- .00380 16.71 .594 ---- .00385
Yes -.206 .0127 .00182 0.00270 18.73 .496 .00172 .00288
Male Asian Yes -.156 .0126 .00169 0.00201 15.72 .438 .00169 .00212
Male Puerto Rican Yes -.155 .0119 .00163 0.00189 17.84 .536 .00150 .00188
Female Caucasian No 0.0409 .0113 --- 0.00391 13.50 .739 --- .00314
Yes -.0240 .0104 .00186 0.00281 14.39 .635 .00151 .00244
Female Caucasian +Hispanic+Black No 0.0494 .0109 --- .00351 13.50 .728 --- .00276
Yes -.0160 .0104 .00169 0.00260 14.37 .642 .00132 .00222
Female Asian Yes -.0903 .0153 .00122 0.00137 12.38 .573 .00122 .00140
Female Puerto Rican Yes 0.0718 .00919 .000947 .00159 12.82 .639 .000737 .00142
Table 8: Prediction of fat fraction from BMI for Caucasian + Black + Hispanic subjects.
Subjects Linear Model I Model II
a b MSR f1 BMI0 MSR f1 f0 BMI0 MSR
Male: 18 – 89 -.145 .0134 .0038 .594 16.71 0.00385 .647 .129 22.00 0.00377
Male: 18 – 31 -.201 .0134 .00273 .543 19.39 0.00315 .706 .118 23.78 0.00261
Male: 32 – 50 -.133 .0119 .00303 .505 16.54 0.00312 .619 .153 23.54 0.00281
Male: 51 – 89 -.126 .0136 .00310 .628 16.28 .00299 .661 .167 21.43 0.00283
Female: 18 – 90 +.0494 .0109 .00351 .728 13.50 .00276 .745 .220 19.65 0.00272
Female: 18 – 31 -.00685 .0116 .00237 .695 13.99 .00225 .774 .214 21.30 0.00181
Female: 32 – 50 +0.0700 .00963 .00306 .723 13.86 .00212 .737 .208 19.71 0.00209
Female: 51 – 90 +0.106 .0101 .00225 .681 11.57 .00210 .682 .249 18.28 0.00210
Model parameters and mean square residual error (MSR) for Model I, Model II and Linear fit are listed.
Table 9: Prediction of fat fraction from body density for Caucasian + Black + Hispanic subjects.
Subjects a b f0 f1 d0 d1 MSRls MSRsiri1 MSRsiri2 MSRbro
Male: 18 – 89 4.63 4.208 0.129 0.647 1.0678 0.954 .000481 .000693 .000711 0.000553
Male: 18 – 31 4.912 4.475 0.118 0.706 1.0695 0.948 .000402 .000536 .000597 0.000532
Male: 32 – 50 4.559 4.141 0.153 0.619 1.061 0.958 .000457 .000723 .000614 .000562
Male: 51 – 89 4.231 3.821 0.167 0.661 1.0612 0.944 .000516 .000853 .000957 .000568
Female: 18 – 90 4.673 4.239 0.220 0.745 1.048 0.9376 .000640 .000813 .00202 .000662
Female: 18 – 31 4.779 4.339 0.214 0.774 1.050 .935 .000616 .00066 .00178 .000661
Female: 32 – 50 4.785 4.347 0.208 0.737 1.050 .941 .000538 .000653 .00191 .000576
Female: 51 – 90 4.606 4.175 0.249 0.682 1.041 .948 .000722 .00102 .00223 .000732
The parameters a and b are the optimal least square values (fat fraction = a/density – b), and f0 and f1 are the fat fractions used for the
Publish with
Bio
Med
Central
and every
scientist can read your work free of charge
"BioMed Central will be the most significant development for disseminating the results of biomedical researc h in our lifetime."
Sir Paul Nurse, Cancer Research UK
Your research papers will be:
available free of charge to the entire biomedical community
peer reviewed and published immediately upon acceptance
cited in PubMed and archived on PubMed Central
yours — you keep the copyright