O R I G I N A L R E S E A R C H
Open Access
A generalized synthesis load model
considering network parameters and
all-vanadium redox flow battery
L Zhou
1, Z W Peng
1, C R Deng
1, X Z Qi
2*and P Q Li
2Abstract
The simulation precision of the classic load model (CLM) is affected by the increasing proportion of installed energy storage capacity in the grid. This paper studies the all-vanadium redox flow battery (VRB) and proposes an equivalent model based on the measurement-based load modeling method, which can simulate the maximum output of the VRB energy storage system and fit the external characteristic of the system precisely in the occurrence of large disturbance and continuous small disturbance. The equivalent model is connected to CLM to form a generalized synthesis load model (GSLM), which considers the parameters of distribution network and reactive power compensation. Compared with CLM, GSLM has better structures and can describe the load characteristics of distribution network with energy storage system more precisely. Simulation results validate the effectiveness and good parameter stability of GSLM, and show that the higher the proportion of energy storage in the grid is the better description ability GSLM has.
Keywords:All-vanadium redox flow battery, Classic load model, Network parameter, Parameter identification, Reactive compensation
1 Introduction
Renewable clean energy is an important part of smart grid and energy Internet, but it must be combined with energy storage system to meet the requirements of a safe, stabile and efficient large power system. From the perspective of load modeling, the type, com-position, and charging and discharging depth of the load model will directly affect the results of the study. Under critical conditions, different load models will lead to complete different simulation and calculation results [1–6]. Under this background, the load model used in the calculation of power system must include energy storage system. The commonly used load model in power system calculation includes induction motor and static load, and the static load is the com-bination of constant impedance, constant current and constant power loads. It is directly connected to the high voltage load bus and is called the classic load model (CLM) [7,8]. In actual distribution systems, the
load is usually connected to the medium and low volt-age distribution buses, so CLM may amplify the effect of the motors, leading to errors in the load model. Therefore, developing better-structured load model is of great theoretical value and practical significance.
All-vanadium redox flow battery has attracted wide attention in industry for its noticeable advantages and has been used as energy storage system and operated with clean energy [9–12]. The model of VRB has been studied in many publications. A two-dimensional elec-trochemical model of VRB is established in [13], which considers the factors of chemical reaction kinetics and can accurately calculate the ion concentration and the dynamic distribution of potential with time and space. The model of VRB including fluid mechanics, electri-city and electrochemical multiple physical fields is established in [14]. It uses Bernoulli equation, Nernst equation and some empirical equations to describe the relation between the battery parameters, and the nu-merical calculation model of the battery system is established from energy perspective. In [15, 16], a fourth-order dynamic model of the energy storage bat-tery is established and further improved. The model * Correspondence:[email protected]
2College of Electrical and Information Engineering, Hunan University,
Changsha 410082, China
Full list of author information is available at the end of the article
takes into account the nonlinear characteristics of the charging and discharging processes, which have a complex structure with many parameters. The AC im-pedance model of VRB is established and improved in [17–20], which contains the reaction resistance, ohm impedance, pump damage and additional loss.
Based on the above research, a distribution network simulation model with VRB energy storage system is established in this paper, and the characteristics of the system are obtained at the grid connection bus. From the external characteristics, a simplified equivalent model of VRB energy storage system based on the measurement-based load modeling method is estab-lished, which can simulate the maximum output of the VRB energy storage system and fit the external charac-teristics of the system precisely in the presence of large disturbance and continuous small disturbance. In addition, the model has a simple structure and can be identified easily. The equivalent model is then con-nected to CLM to form a generalized synthesis load model (GSLM) which considers the parameters of dis-tribution network and reactive power compensation. Compared with CLM, GSLM has better structure and can describe the load characteristics of distribution network with energy storage system more precisely.
This paper is organized as follows. The model of VRB energy storage system is established in Section2. In Sec-tion 3, an equivalent model of the system is proposed from the principle of external characteristic equivalent fitting. In Section4, GSLM is established, its parameters are identified, and simulation studies are carried out. Fi-nally, Section5draws the conclusion.
2 VRB model and simulation of grid connected system
2.1 VRB model
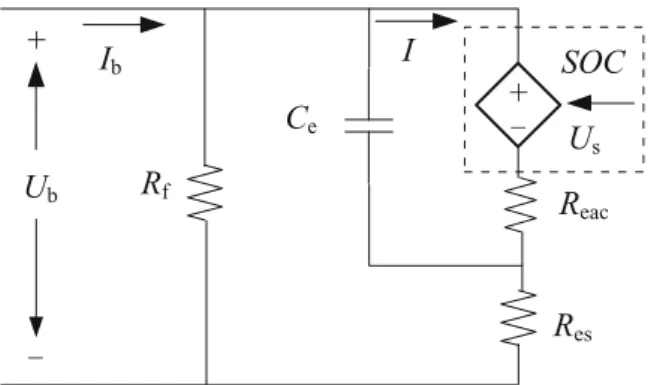
VRB models are divided into electrochemical model and equivalent circuit model according to the principle of modeling. The mathematical equations of the former are complex requiring large amount of cal-culation, and the necessary micro parameters are diffi-cult to obtain in modeling process. The latter model can directly reflect the external equivalent characteris-tics of the battery and the changes of various charac-teristic parameters in the process of charging and discharging are clear. An improved equivalent circuit model based on the assumption of loss [9–11, 18–20] is used in this paper, and the model structure is shown in Fig.1.
As shown in Fig.1, the controlled voltage source Us
is the open circuit voltage of the battery and Ubis the
battery terminal voltage.ReacandResrepresent the
in-ternal loss of the battery, which include the diaphragm
solution impedance and the reaction power equivalent impedance. Many studies have proved thatReacrepresents
60% of the internal loss with 40% forRes[18–20].Rf
repre-sents the pumping loss and additional loss. Cerepresents
the interelectrode capacitance, which simulates the transi-ent state process of VRB, and the equivaltransi-ent capacitance of a single battery is around 6F.
According to the Nernst equation of electrochemical reaction and ignoring the influence of hydrogen ion con-centration, the open circuit voltage of a single battery can be described as:
Ucell¼E0−RT
F ln C3C4
C2C5: ð
1Þ
In (1),Ucell is the open circuit voltage of the battery
cell, and its unit is V. Ci (i= 2,3,4,5) represents the
concentration of vanadium ion in each valence state, and its unit is mol·L−1. T is the absolute temperature with unit of K, andRrepresents the ideal gas constant and is given as 8.314 J·K−1·mol−1. F represents the Faraday constant and equals to 96,500 C·mol−1. When the temperature is 298 K, the positive and negative electrode potential E0between the positive and
nega-tive electrodes of VRB is:
E0¼E0þ−E0−¼1:004− −ð 0:225Þ ¼1:259 Vð Þ; ð2Þ
SOCrepresents the charge state of VRB and is given as:
SOC¼ ES
EC: ð
3Þ
where Es and Ec are the remaining energy and rated
capacity of the battery, respectively. The range of SOC
is 0 to 1. When SOC = 0, the battery is empty, and
whenSOC = 1, the battery is full.SOCcan be expressed as a ratio of ionic concentration when the concentra-tion of positive ions equal to the negative.
SOCs for the negative electrolyte and positive electro-lyte are given as:
SOCn¼ C2
C3þC2 ð
4Þ
SOCp¼ C5
C5þC4 ð
5Þ
When the positive and negative reactions are balanced, the hydrogen concentration is approximately a constant, i.e.SOC=SOCn= SOCp. Therefore, the VRB circuit
volt-age can be described as:
Ucell¼1:259−RT
F ln
1−SOC
SOC
2
: ð6Þ
SOC changes with the battery charging and dischar-ging as:
SOCtþ1¼SOCtþΔSOC ð7Þ
ΔSOC¼ΔE
EC ¼ PsΔt
EC ¼ IUSΔt
EC ð
8Þ
In the above equations, Δt represents the time step, SOCt + 1andSOCtare theSOCstates of the battery at t
+ 1 and t instants, respectively. ΔE is the total energy change of the battery and ΔSOCrepresents the change of theSOCat one time step.
Generally, the voltage of the VRB monomer is not high. In order to match the system voltage, multiple monomers are connected in series to form a stack. For a VRB stack withNcell numbers of VRB monomers, its
open circuit voltage can be described as:
US¼NcellUcell ð9Þ
2.2 VRB energy storage system
2.2.1 Construction of VRB energy storage system
The VRB energy storage system contains a VRB, a con-verter, and a filter. As VRB outputs DC, a DC/AC
converter is required for integrating to the power grid. In this paper, the VRB is connected to the power grid by a bidirectional DC/DC converter, a DC/AC con-verter and a LC filter.
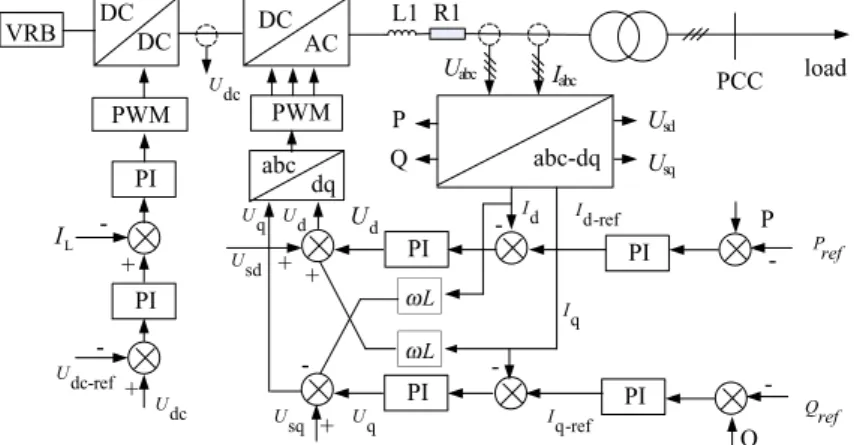
The bidirectional DC/DC converter adopts Boost-Buck circuit with dual-loop control strategy includ-ing a voltage outer loop and current inner loop to achieve bidirectional fast energy flow [21, 22]. The DC/AC converter also adopts dual-loop decoupling control strategy with power outer loop and current inner loop [23]. The active power reference Pref is
the difference between the output active power and the required active power of the grid, and the ob-tained error is fed to the PI regulator to generate the reference value of the d-axis current. The refer-ence value of reactive power Qref is set to 0 to
en-sure unit power factor. When the VRB charges, Pref < 0, and the control signal causes the DC/AC
in-verter to operate in rectifier state, and the DC/DC converter in the BUCK mode. When the VRB dis-charges, Pref > 0, the DC/AC converter operates in
inverter state and the DC/DC converter in the BOOST mode.
The block diagram of the overall control diagram of the VRB energy storage system is shown in Fig.2.L1and
R1are the filter inductance and resistance, respectively. Fig. 2Control principle of VRB energy storage system
2.2.2 Grid simulation
Based on the previous descriptions, Matlab/Simulink is used to construct the simulation system shown in Fig.3. The load characteristics of the VRB energy stor-age system can be obtained by measuring the data at the bus B3.
In Fig. 3, the induction motor simulates the dy-namic load, the resistance load in parallel with the in-ductance load simulate the static load, and the VRB energy storage system is connected to the distribution network through the DC/DC and DC/AC converters. L and R represent the network parameters.
3 Equivalent description of VRB energy storage system
Establishing an equivalent mathematical model de-scribing the external characteristics of VRB energy storage system to meet the demand of power grid simulation is required to study the synthesis load model of distribution network including VRB. An appropriately simplified model is not only a guaran-tee for accurate power system simulation, but also an essence for reducing simulation difficulty [24]. In this paper, the equivalent model of the VRB en-ergy storage system is established based on the principle of VRB external characteristic fitting.
3.1 Dynamic characteristics of VRB
In order to study the dynamic characteristics of the VRB energy storage system, the system established in the last section is connected to a power grid. A series of voltage disturbances are applied to test the system. In the process of VRB charging and discharging, three-phase short-circuit faults are applied at bus B1 (see Fig. 3) to cause voltage drops of 10% to 40%. The load data at B3 (active power, reactive power and bus voltage) are measured and the dynamic characteristics of the VRB energy storage system in transient process are obtained. Taking the 20% voltage drop as an ex-ample, the dynamic characteristic curve of the VRB energy storage system is shown in Fig.4.
In Fig. 4, in the transient of bus voltage drop, the variation of the reactive power of the VRB energy storage system is very small, and its value is close to 0. Therefore, to simplify the model, the reactive power is fixed at zero in this paper. The active power PVRB is no longer a constant, and in a
dy-namic state, the static constant power load cannot describe its transient characteristics accurately, and it must be equivalent to the generalized dynamic load.
3.2 Equivalent description model of VRB
Previous analysis shows that it is necessary to es-tablish a dynamic equivalent model to describe the transient characteristics of the VRB energy storage system accurately. According to Fig. 4, the voltage disturbance of the power system can be regarded as superposition of step excitation signals, and the ac-tive power output of the VRB energy storage system is close to the step response of the first-order iner-tial system. Therefore, the step response of the first-order inertial system is used as the equivalent model of the VRB energy storage system after ig-noring the reactive power output of the system as:
0 0.1 0.2 0.3 0.4 0.5 0.6 0.7
0 0.2 0.4 0.6 0.8 1.0 1.2
t/s
P
.Q
.U/pu
P Q U
Fig. 4External characteristics of VRB energy storage system
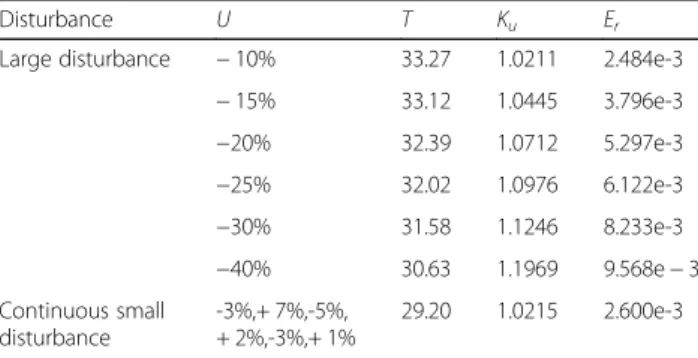
Table 1Recognition results of equivalent model parameters
Disturbance U T Ku Er
Large disturbance −10% 33.27 1.0211 2.484e-3 −15% 33.12 1.0445 3.796e-3 −20% 32.39 1.0712 5.297e-3 −25% 32.02 1.0976 6.122e-3 −30% 31.58 1.1246 8.233e-3 −40% 30.63 1.1969 9.568e−3 Continuous small
disturbance
-3%,+ 7%,-5%, + 2%,-3%,+ 1%
29.20 1.0215 2.600e-3 0.2 0.3 0.4 0.5 0.6 0.7
0.6 0.8 1.0 1.2 1.4 1.6
t/s
P/pu
Simulated Power(40%) Identified Power(40%) Simulated Power(20%) Identified Power(20%)
PVRB¼2P0−P0 τ u
sþ1þKuðu−U0Þ
ð10Þ
In (10), P0 represents the initial active power
out-put of the VRB energy storage system and is set as the rated power PNVRB. The steady-state maximum
output active power of the model is PNVRB, so this
model can simulate the limit output of the VRB en-ergy storage system accurately. u and U0 represent
the actual and initial values of the system voltage, respectively, and U0 equals to the rated voltage UN. τ represents the inertial time constant of the system and Ku is the voltage compensation factor.
This model uses the first-order transfer function of voltage to represent the real-time active power output of the VRB energy storage system. The model has limited parameters and the structure is simple, which make the model easy to realize in power simulation software.
3.3 Verification of equivalent model of VRB energy storage system
Voltage disturbances can be divided into large disturb-ance and continuous small disturbdisturb-ance according to the different degrees. When different voltage disturbances occur, the genetic algorithm [25, 26] can accurately and
quickly identify the parameters of the model, and the out-put response of the model can then be obtained. The ef-fectiveness of the equivalent VRB model is verified by comparing the output response with the load characteris-tics of the VRB energy storage system under same disturbances.
3.3.1 Large disturbance verification
The system shown in Fig. 3 is simulated and the three-phase short-circuit faults are applied at the bus B1 to cause bus voltage drops of 10%–40%. The effect-ive value of the voltage at the bus B3 is the excitation of the model, where the active power curve is the target response curve. The six sets of data as the results of model parameter identification are shown in Table1.
Experiments on voltage drops of 20% and 40% of bus B1 are carried out in this paper, and the fitting curves are shown in Fig.5.
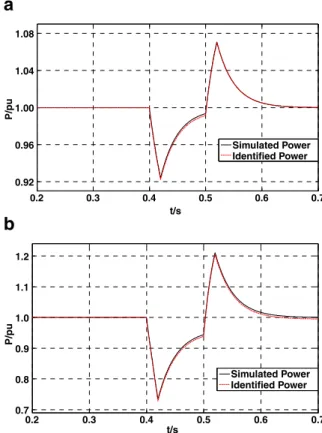
3.3.2 Continuous small disturbance verification
Similarly, a continuous small disturbance is applied at bus B1. The voltage fluctuations and the fitting curves are shown in Fig.6(a) and (b), respectively. The identi-fication results are also shown in Table1.
0 0.2 0.4 0.6 0.8 1.0
0.92 0.96 1.00 1.04 1.08
t/s
U/pu
0 0.2 0.4 0.6 0.8 1.0
0.90 0.95 1.00 1.05 1.10 1.15
t/s
P/pu
Simulated Power Identified Power
a
b
Fig. 6Voltage disturbance curve and fitting curve of the model under continuous small disturbance
0.2 0.3 0.4 0.5 0.6 0.7
0.92 0.96 1.00 1.04 1.08
t/s
P/pu
Simulated Power Identified Power
0.2 0.3 0.4 0.5 0.6 0.7
0.7 0.8 0.9 1.0 1.1 1.2
t/s
P/pu
Simulated Power Identified Power
a
b
3.3.3 Result analysis
It is seen from Fig. 5 and Fig. 6 that the model re-sponse can be well fitted to the load characteristics of the VRB energy storage system in the transient process under both the large and small voltage disturbances. It shows that the equivalent VRB model proposed in this paper is a good approximation to the data samples and has strong self-description ability. The identifica-tion parameters and residuals in Table 1 also support this observation. The above analysis shows that the first-order transfer function model proposed in this paper can accurately describe the load characteristics of the VRB energy storage system.
In Table 1, Er is calculated according to (11), and its
size reflects the degree of the fitting effect. The smaller theEris, the better the fitting effect has.
Er ¼ 1 N
XN
k¼0
ffiffiffiffiffiffiffiffiffiffiffiffiffiffiffiffiffiffiffiffiffiffiffiffiffiffiffiffiffiffiffi PSð Þ−k P1ð Þk
ð Þ2
q
ð11Þ
In (11), Ps(k) is the actual response of the
simula-tion system, N is the measured data length, and P1(k) represents the identification responses.
3.3.4 Generalization ability test of model
The model with the parameters identified under volt-age drop of 20% at the bus B1 fits the response curves of the model obtained under bus voltage drop of 10% (interpolation capability validation) and 30% (extrapo-lating ability validation). The generalization ability of the model is verified by comparing the fitting degree of the corresponding model response to the simulation response. The curve of interpolation and extrapolation is shown in Fig.7, and the fitting residuals are shown in Table2. The results show that although the voltage excitation amplitudes of the fitting sample and the modeling sample are different, the model has good interpolation and generalization abilities.
It should be pointed out that load model param-eter identification is a typical nonlinear mathematical problem, and no optimization algorithm can guaran-tee the uniqueness of the results. Therefore, it is in-evitable that the identified model parameters have certain dispersion.
4 Structure and parameter identification of GSLM CLM does not take into account the influence of distribution grid parameters. Many modeling prac-tices have shown that induction motors have good ability to represent synthesis load, but the ability to describe the reactive power in the transient process after disturbances is poor. Therefore, a dynamic re-active power compensation device is proposed to connect in parallel with the static load [27]. Refer-ence [28] points out that the structure of generalized load model including energy storage system needs to increase the size of the energy storage system on the virtual bus of the synthesis load model. Large num-bers of energy storage system can be regarded as the dynamic load with negative power. A generalized synthesis load model with the VRB energy storage system is established in this paper, which takes into account the influence of distribution network param-eters and reactive power compensation equipment.
4.1 The structure of GSLM
The structure of GSLM is shown in Fig. 8, which takes into account the parameters of the distribution network RD + jXD, the compensation capacitor C and
the VRB energy storage system. U and UL represent Table 2Response residuals error of interpolation and extrapolation
Algorithm Interpolation 10% Extrapolation 30%
residual 2.501e-3 8.593e-3
Fig. 8Structure diagram of GSLM
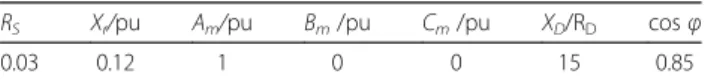
Table 3Typical value of non-key parameters
RS Xr/pu Am/pu Bm/pu Cm/pu XD/RD cosφ
the actual and virtual load bus voltages, respectively, and the part between the actual and virtual buses is the equivalent impedance of the distribution network.
Assuming that the system frequency is at the rated fre-quency in normal operation, i.e., f0 = 1pu, and in
per-unit terms,X = L.
1) Distribution network parameters
ConsideringU=U∠0°, as shown in Fig.8, there are:
UL
g
¼ U−PRDþQfXD U
−jPfXDþQRD
U ð12Þ
PD¼P
2þ
Q2 U2 RD
QD¼P
2þ
Q2 U2 fXD 8
> > < > >
: ð
13Þ
PL¼P−PD QL¼Q−QD
ð14Þ
2) Compensation capacitor
Under the per-unit system:
XC¼ 1 ωC¼
XC0
f ;XC0¼ 1
C: ð15Þ
Therefore, the capacity of the compensation capaci-tor is:
QC ¼−U
2
L XC¼−
U2L
XC0f: ð
16Þ
whereXC0represents the capacitive reactance in normal
operation and can be obtained as:
XC0¼−U 2
L0
QC0
ð17Þ
C¼ 1
XC0¼−
QC0
U2L0
ð18Þ
If XC0 > 0, this part is a real reactive compensation
equipment, otherwise, this part is a reactive load and can be incorporated into the static load.
3) ZIP
The static load is equivalent to a constant admittance (Y = G-jB, and ifB > 0,Yis an inductive load):
PZIP¼GU2L QZIP¼BU2L
ð19Þ
4) Motor
The induction motor has the dynamic characteristics represented by the third-order dynamic differential equations under the synchronous coordinate system. This model is widely used so no further discussion is given here.
4.2 Unknown parameters of GSLM
In Fig. 8, PM, QM, PVRB, QVRB, PS, QS, and QC
repre-sent the active and reactive powers of the induction motor, active and the reactive powers produced by the VRB, active and reactive powers of the static load, re-active power of the compensation capacitor, respect-ively. The arrows in Fig. 8 represent the reference power directions, and positive power means the direc-tion of the actual power is the same as the reference direction, and vice versa. As can be seen from the pre-vious section, GSLM has a total of 18 parameters, i.e., RD, XD, XM, RS, XS, Rr, Xr,Tj, Am, Bm, Cm, G, B, XC0,
the ratio of the system reference power to the refer-ence power of the induction motorK[13],TandKuof the equivalent model, and the proportion of the VRB energy storage systemKVRB=PVRB/(Pm+ PS).
According to [29–31], some of the parameters in the model are difficult to identify and the identification results are discrete. The identification strategy used in this paper only identifies the values of the key ters, whereas typical values are used for other parame-ters. Sensitivity analysis shows that among the motor parameters, only K, XS, Rr, Xm, and Tj have relatively
large sensitivity, and thus, typical values are used for other motor parameters.
For the distribution network parameters, the parame-ters of GSLM cannot be uniquely identified when RD
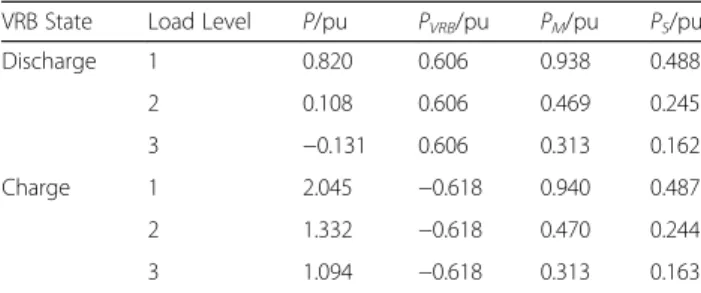
and XD are unknown. However, when one of their Table 4Six different load levels
VRB State Load Level P/pu PVRB/pu PM/pu PS/pu
Discharge 1 0.820 0.606 0.938 0.488
2 0.108 0.606 0.469 0.245
3 −0.131 0.606 0.313 0.162
Charge 1 2.045 −0.618 0.940 0.487
2 1.332 −0.618 0.470 0.244
values or the relation between them (XD/RD) is known,
the parameters of GSLM is uniquely identifiable [32]. According to the actual statistics,XD/RD= 15is used in
this paper.
The compensation capacitorXCis calculated as
previ-ous described. If XC is not considered separately, the
power factor of static load may become abnormal and the calculation results become unreasonable. In order to separateXCfrom the static load, additional condition
is required. To ensure normal power factor for the static load, it is assumed that the power factor cosφ is known. As B/G = tanφ, the relationship betweenGand Bis thus known andXCcan be determined once Gand
Bare obtained.
Thus, there are 10 key unknown parameters, i.e., XS,
Rr, Xm,Tj, K, G, XD, KVRB,T, and Ku. Other parameters
can take typical recommended values from China Elec-tric Power Research Institute, as shown in Table3.
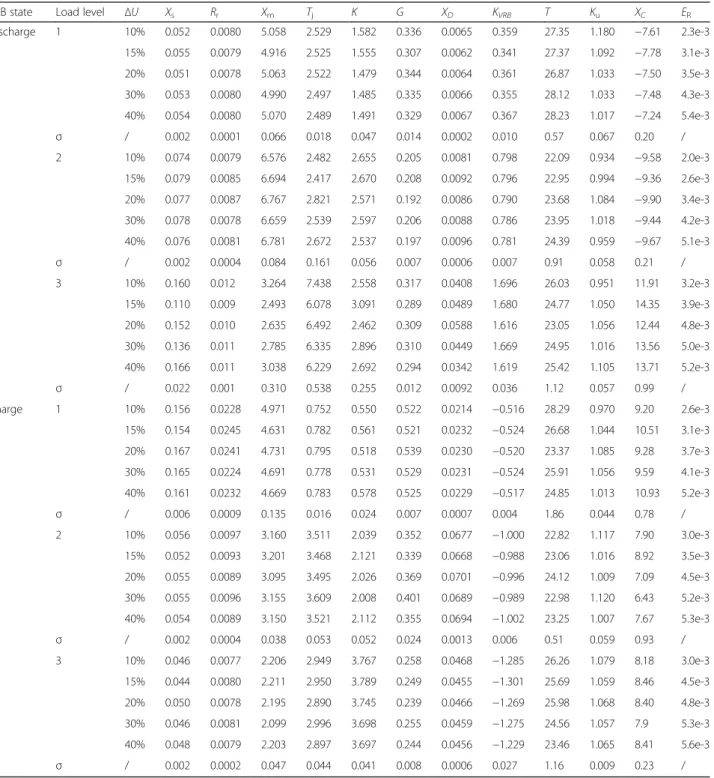
Table 5Recognition results of generalized synthesis load model parameters
VRB state Load level ΔU Xs Rr Xm Tj K G XD KVRB T Ku XC ER
Discharge 1 10% 0.052 0.0080 5.058 2.529 1.582 0.336 0.0065 0.359 27.35 1.180 −7.61 2.3e-3
15% 0.055 0.0079 4.916 2.525 1.555 0.307 0.0062 0.341 27.37 1.092 −7.78 3.1e-3
20% 0.051 0.0078 5.063 2.522 1.479 0.344 0.0064 0.361 26.87 1.033 −7.50 3.5e-3
30% 0.053 0.0080 4.990 2.497 1.485 0.335 0.0066 0.355 28.12 1.033 −7.48 4.3e-3
40% 0.054 0.0080 5.070 2.489 1.491 0.329 0.0067 0.367 28.23 1.017 −7.24 5.4e-3 σ / 0.002 0.0001 0.066 0.018 0.047 0.014 0.0002 0.010 0.57 0.067 0.20 / 2 10% 0.074 0.0079 6.576 2.482 2.655 0.205 0.0081 0.798 22.09 0.934 −9.58 2.0e-3
15% 0.079 0.0085 6.694 2.417 2.670 0.208 0.0092 0.796 22.95 0.994 −9.36 2.6e-3
20% 0.077 0.0087 6.767 2.821 2.571 0.192 0.0086 0.790 23.68 1.084 −9.90 3.4e-3
30% 0.078 0.0078 6.659 2.539 2.597 0.206 0.0088 0.786 23.95 1.018 −9.44 4.2e-3
40% 0.076 0.0081 6.781 2.672 2.537 0.197 0.0096 0.781 24.39 0.959 −9.67 5.1e-3 σ / 0.002 0.0004 0.084 0.161 0.056 0.007 0.0006 0.007 0.91 0.058 0.21 / 3 10% 0.160 0.012 3.264 7.438 2.558 0.317 0.0408 1.696 26.03 0.951 11.91 3.2e-3
15% 0.110 0.009 2.493 6.078 3.091 0.289 0.0489 1.680 24.77 1.050 14.35 3.9e-3
20% 0.152 0.010 2.635 6.492 2.462 0.309 0.0588 1.616 23.05 1.056 12.44 4.8e-3
30% 0.136 0.011 2.785 6.335 2.896 0.310 0.0449 1.669 24.95 1.016 13.56 5.0e-3
40% 0.166 0.011 3.038 6.229 2.692 0.294 0.0342 1.619 25.42 1.105 13.71 5.2e-3 σ / 0.022 0.001 0.310 0.538 0.255 0.012 0.0092 0.036 1.12 0.057 0.99 / Charge 1 10% 0.156 0.0228 4.971 0.752 0.550 0.522 0.0214 −0.516 28.29 0.970 9.20 2.6e-3
15% 0.154 0.0245 4.631 0.782 0.561 0.521 0.0232 −0.524 26.68 1.044 10.51 3.1e-3
20% 0.167 0.0241 4.731 0.795 0.518 0.539 0.0230 −0.520 23.37 1.085 9.28 3.7e-3
30% 0.165 0.0224 4.691 0.778 0.531 0.529 0.0231 −0.524 25.91 1.056 9.59 4.1e-3
40% 0.161 0.0232 4.669 0.783 0.578 0.525 0.0229 −0.517 24.85 1.013 10.93 5.2e-3 σ / 0.006 0.0009 0.135 0.016 0.024 0.007 0.0007 0.004 1.86 0.044 0.78 / 2 10% 0.056 0.0097 3.160 3.511 2.039 0.352 0.0677 −1.000 22.82 1.117 7.90 3.0e-3
15% 0.052 0.0093 3.201 3.468 2.121 0.339 0.0668 −0.988 23.06 1.016 8.92 3.5e-3
20% 0.055 0.0089 3.095 3.495 2.026 0.369 0.0701 −0.996 24.12 1.009 7.09 4.5e-3
30% 0.055 0.0096 3.155 3.609 2.008 0.401 0.0689 −0.989 22.98 1.120 6.43 5.2e-3
40% 0.054 0.0089 3.150 3.521 2.112 0.355 0.0694 −1.002 23.25 1.007 7.67 5.3e-3 σ / 0.002 0.0004 0.038 0.053 0.052 0.024 0.0013 0.006 0.51 0.059 0.93 / 3 10% 0.046 0.0077 2.206 2.949 3.767 0.258 0.0468 −1.285 26.26 1.079 8.18 3.0e-3
15% 0.044 0.0080 2.211 2.950 3.789 0.249 0.0455 −1.301 25.69 1.059 8.46 4.5e-3
20% 0.050 0.0078 2.195 2.890 3.745 0.239 0.0466 −1.269 25.98 1.068 8.40 4.8e-3
30% 0.046 0.0081 2.099 2.996 3.698 0.255 0.0459 −1.275 24.56 1.057 7.9 5.3e-3
4.3 Model verification
To verify the complete GSLM model, the voltage at the bus B1 shown in Fig. 3 is dropped by 10%, 15%, 20%, 30% and 40%, respectively, and the model is simulated dynamically under different load levels shown in Table4. The load data obtained at bus B1 is regarded as the mea-sured sample data, and the parameters are identified by the improved genetic algorithm. The identification re-sults are shown in Table5, whereσrepresents the stand-ard deviations of the parameters and ER represents the
fitting error of the dynamic curve.
In Table4,P,PVRB,PM, andPSrepresent the capacities
of the system, VRB energy storage system, dynamic load, and static load, respectively. The fitting effects of the model under the six load levels are described as follows.
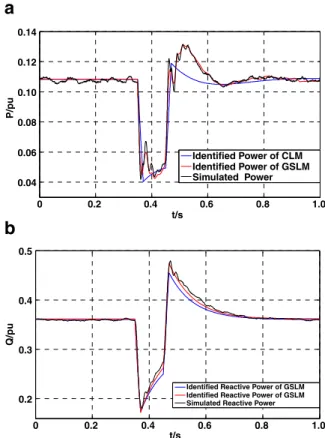
4.3.1 Discharge STATE
(1) First load level: 0 < PVRB < PM. Under this condition, KVRB < 1 and the output power from VRB is insufficient to maintain the load power. The powers of the equivalent dynamic load and static load of the distribution network are supplied by the system, i.e., P > 0, and Q > 0. From Table 4, the theoretical value of KVRBis
0.425. The fitting effect of the 20% voltage drop under this load level is shown in Fig. 9.
(2) Second load level: PM < PVEB < PM + PS. In this condition, KVRB < 1, and the output power from VRB fully meets the power absorbed by the induction motor alone, but not the power absorbed by both the induction motor and static load. The theoretical value of KVRB is 0.848 and the fitting effect of the 20% voltage drop under this load level is shown in Fig. 10.
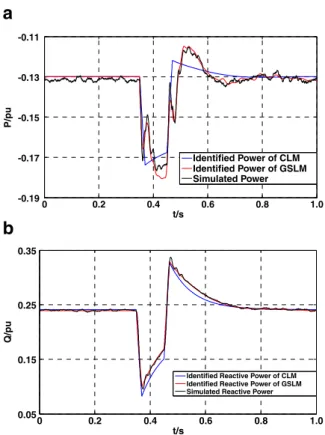
(3) Third load level:PVRB> PM+ PS. Under this condition,KVRB> 1, and the output power from VRB fully meets the power required for the total load, and thus the VRB can input a certain amount of active power to the system, i.e.,P < 0. The theoretical value ofKVRBis 1.274 and the fitting effect of the 20% voltage drop under this load level is shown in Fig.11.
4.3.2 Charge STATE
(1) First load level. The VRB energy storage system acts as a dynamic load to absorb power from the system. The theoretical value ofKVRBis−0.433 and the
0 0.2 0.4 0.6 0.8 1.0
0.04 0.06 0.08 0.10 0.12 0.14
t/s
P/pu
Identified Power of CLM Identified Power of GSLM Simulated Power
0 0.2 0.4 0.6 0.8 1.0
0.2 0.3 0.4 0.5
t/s
Q/pu
Identified Reactive Power of GSLM Identified Reactive Power of GSLM Simulated Reactive Power
a
b
Fig. 10Fitting curves of the second load level under discharging state
0 0.2 0.4 0.6 0.8 1.0
0.55 0.65 0.75 0.85 0.95
t/s
P/pu
Identified Power of CLM Identified Power of GSLM Simulated Power
0 0.2 0.4 0.6 0.8 1.0
0.2 0.4 0.6 0.8 1.0 1.2
t/s
Q/pu
Identified Reactive Power of CLM Identified Reactive Power of GSLM Simulated Reactive Power
a
b
fitting effect of the 20% voltage drop under this load level is shown in Fig.12.
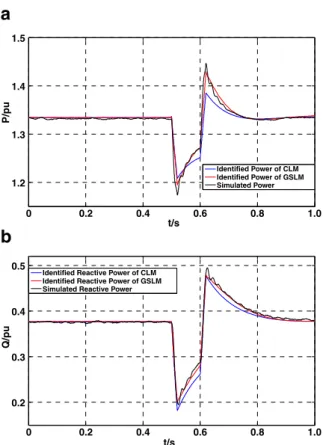
(2) Second load level. The proportion of the output power from the VRB energy storage system increases and the theoretical value ofKVRBis− 0.866. The fitting effect of the 20% voltage drop under this load level is shown in Fig.13. (3) Third load level. The proportion of the output
power from the VRB energy storage system increases further and the theoretical value ofKVRB is−1.298. The fitting effect of the 20% voltage drop under this load level is shown in Fig.14.
It can be seen from Figs. 9-14 that the GSLM pro-posed in this paper can effectively describe the external characteristics of the synthesis distribution network load with the VRB under different load levels and different working conditions, and in charging or discharging states. The errors in Table5also indicate that the fitting effect is good.
The corresponding fitting effects of GSLM and CLM to the system simulation are also given in Figs. 9-14. Comparing the curves in the figures and the errors in Table 6, the simulation results of GSLM proposed in this paper show much better performance than that of CLM. With the increase of VRB proportion in the
distribution network, the errors of CLM increases, whereas for GSLM, the errors are always smaller.
4.4 Adaptability test of GSLM
(1) Description ability of the model. It can be seen from Figs. 9-14that compared with the classic synthesis load model, the proposed model can better simulate the simulation data. The errors in Table 5 also show that the fitting residuals are very small for different load levels and voltage disturbances. Therefore, the model has good approximation effect on data samples and good description ability, which can meet the needs of engineering simulation.
(2) The generalization ability of the model. For six different load levels, the model parameters identified under the 20% voltage drop fit the response curves of the model obtained under voltage drops of 10% (interpolation capability verification) and 40% (extrapolation capability verification). The interpolation and extrapolation capability of the model under different voltage conditions is verified. In this paper, the interpolation and extrapolation curves of the
0 0.2 0.4 0.6 0.8 1.0
1.7 1.8 1.9 2.0 2.1 2.2
t/s
Q/pu
Identified Power of CLM Identified Power of GSLM Simulated Power
0 0.2 0.4 0.6 0.8 1.0
0.4 0.6 0.8 1.0
t/s
Q/pu
Identified Reactive Power of CLM Identified Reactive Power of GSLM Simulated Reactive Power
a
b
Fig. 12Fitting curves of the first load level under charging state
0 0.2 0.4 0.6 0.8 1.0
-0.19 -0.17 -0.15 -0.13 -0.11
t/s
P/pu
Identified Power of CLM Identified Power of GSLM Simulated Power
0 0.2 0.4 0.6 0.8 1.0
0.05 0.15 0.25 0.35
t/s
Q/pu
Identified Reactive Power of CLM Identified Reactive Power of GSLM Simulated Reactive Power
a
b
discharge state under first load level are given, as shown in Fig. 15, and the fitting residual results are shown in Table 7. Figure 15 shows that although the amplitudes of the voltage
disturbances vary significantly, the responses of the identification results to interpolation and extrapolation sample data are well fitted, as indicated by the residuals in Table 7. The results show that the model has good generalization ability.
(3) Stability analysis of the model parameters. As shown in Table V, exceptTandXC, the standard deviations of the parameters are relatively small indicating good parameters stability. The standard deviations ofTandXCare big because their sensitivities are low. Therefore, the overall stability of the model parameters is high.
5 Conclusions
In this paper, the equivalent model, which is the step re-sponse of the first-order inertial system, is used to de-scribe the external characteristics of the VRB energy storage system. The model can simulate the maximum output of the VRB energy storage system and fit the
external characteristic of the system precisely in the presence of large disturbance and continuous small dis-turbance. In addition, the model has a simple structure and can be identified easily. On this basis, a generalized synthesis load model (GSLM) with the VRB energy stor-age system is established, and the distribution network parameters and reactive power compensation are con-sidered. The load characteristics of the distribution net-work are identified. Simulation results of six typical examples show that GSLM can effectively describe the
0 0.2 0.4 0.6 0.8 1.0
1 1.1 1.2
t/s
P/pu
Identified Power of CLM Identified Power of GSLM Simulated Power
0 0.2 0.4 0.6 0.8 1.0
0.15 0.25 0.35
t/s
Q/pu
Identified Reactive Power of CLM Identified Reactive Power of GSLM Simulated Reactive Power
a
b
Fig. 14Fitting curves of the first load level under charging state
Table 6Error comparison of GSLM and CLM
VRB state Load level Model ER
Discharge 1 GSLM 3.5e-3
CLM 9.2e-3
2 GSLM 3.4e-3
CLM 2.5e-2
3 GSLM 4.8e-3
CLM 2.9e-2
Charge 1 GSLM 3.7e-3
CLM 1.2e-2
2 GSLM 4.5e-3
CLM 2.0e-2
3 GSLM 4.8e-3
CLM 2.6e-2
0 0.2 0.4 0.6 0.8 1.0
1.2 1.3 1.4 1.5
t/s
P/pu
Identified Power of CLM Identified Power of GSLM Simulated Power
0 0.2 0.4 0.6 0.8 1.0
0.2 0.3 0.4 0.5
t/s
Q/pu
Identified Reactive Power of CLM Identified Reactive Power of GSLM Simulated Reactive Power
a
b
load characteristics of the distribution network with en-ergy storage system. Compared with CLM, GSLM has better self-description and generalization ability. The model is effective and has good parameter stability, and the higher the proportion of energy storage in the grid is the better description ability the GSLM has.
Abbreviations
CLM:Classic load model; GSLM: Generalized synthesis load model; VRB: All-vanadium redox flow battery
Funding
This work was supported in part by the national natural science foundation of China(51677059) and Guangdong Power Grid Company Limited Project. (GDKJXM00000025).
Availability of data and materials
Data sharing not applicable to this article as no datasets were generated or analysed during the current study.
Authors’contributions
All authors read and approved the final manuscript.
Competing interests
The authors declare that they have no competing interests.
Author details
1Guangdong Power Grid Corporation Information Center, Guangzhou, China. 2
College of Electrical and Information Engineering, Hunan University, Changsha 410082, China.
Received: 11 May 2018 Accepted: 18 September 2018
References
1. Navarro, I. R., Samuelsson, O., & Lindahl, S. (2003). Influence of normalization in dynamic reactive load models.IEEE Transactions on Power Apparatus and Systems, 18(2), 972–973.
2. Ju, P., Handschin, E., & Karlsson, D. (1996). Nonlinear dynamic load modelling: Model and parameter estimation.IEEE Transactions on Power Apparatus and Systems, 11(4), 1689–1697.
3. Hill, D. J. (1993). Nonlinear dynamic load models with recovery for voltage stability studies. IEEE Transactions on Power Apparatus and Systems, 8(1), 166–176.
4. Karlsson, D., & Hill, D. J. (1994). Modelling and identification of nonlinear dynamic loads in power systems.IEEE Transactions on Power Apparatus and Systems, 9(1), 157–166.
5. Kao, W. S. (2001). The effect of load models on unstable low-frequency oscillation damping in Taipower system experience w/wo power system stabilizers.IEEE Transactions on Power Apparatus and Systems, 16(3), 463–472. 6. Pereira, L., Kosterev, D., Mackin, P., Davies, D., Undrill, J., & Zhu, W. C. (2002). An interim dynamic induction motor model for stability studies in the WSCC.IEEE Transactions on Power Apparatus and Systems, 17(4), 1108–1115.
0 0.2 0.4 0.6 0.8 1.0
0.72 0.76 0.80 0.84 0.88
t/s
P/pu
Identified Power of GSLM Simulated Power
0 0.2 0.4 0.6 0.8 1.0
0.5 0.6 0.7 0.8 0.9
t/s
Q/pu
Identified Reactive Power of GSLM Simulated Reactive Power
0 0.2 0.4 0.6 0.8 1.0
0.55 0.65 0.75 0.85 0.95
t/s
P/pu
Identified Power of GSLM Simulated Power
0 0.2 0.4 0.6 0.8 1.0
0 0.4 0.8 1.2
t/s
Q/pu
Identified Reactive Power of GSLM Simulated Reactive Power
a
b
c
d
Fig. 15Interpolation and extrapolation capability verification
Table 7Response residuals of interpolation and extrapolation
VRB state Load level Interpolation 10% Extrapolation 40%
Discharge 1 2.5e-3 5.7e-3
2 2.1e-3 5.0e-3
3 3.3e-3 8.6e-3
Charge 1 2.9e-3 4.8e-3
2 3.8e-3 5.5e-3
7. Ma, J., Renmu, H., & Hill, D. J. (2006). Load modeling by finding support vectors of load data from field measurements.IEEE Transactions on Power Apparatus and Systems, 21(2), 726–735.
8. Renmu, H., Ma, J., & Hill, D. J. (2006). Composite load modeling via measurement approach.IEEE Transactions on Power Apparatus and Systems, 21(2), 663–672.
9. Badrinarayanan, R., Yu, Z., & Tseng, K. J. (2015).Performance study of a vanadium redox flow battery (VRB) for use in green data centers(pp. 1–5). Osaka: IEEE International Telecommunication Energy Conference (INTELEC). 10. Qiu, X., Crow, M. L., & Elmore, A. C. (2015). A balance-of-plant vanadium redox
battery system model.IEEE Transaction on Sustainable Energy, 6(2), 557–564. 11. Qiu, X., Nguyen, T. A., Guggenberger, J. D., Crow, M. L., & Elmore, A. C.
(2014). A field validated model of a vanadium redox flow battery for microgrids.IEEE Transactions on Smart Grid, 5(4), 1592–1601.
12. Guggenberger, J. D., Elmore, A. C., Tichenor, J. L., & Crow, M. L. (2012). Performance prediction of a vanadium redox battery for use in portable, scalable microgrids.IEEE Transactions on Smart Grid, 3(4), 2109–2116. 13. Shah, A. A., Watt-Smith, M. J., & Walsh, F. C. (2008). A dynamic performance
model for redox-flow batteries involving soluble species. Electrochimica Acta, 53(27), 8087–8100.
14. Blanc, C., & Rufer, A. (2008). Multiphysics and energetic modeling of a vanadium redox flow battery. InProc. IEEE 2008 International Conference Sustainablepp. 696–701. Singapore: Energy Technol.
15. Kroeze, R. C., & Krein, P. T. (2008). Electrical battery model for use in dynamic electric vehicle simulations. IEEE Transactions on Power Apparatus and Systems, 23(4), 1336–1342.
16. Zban, C. J., Wu, X. G., Kromlidis, S., et al. (2003). Two electrical models of the lead-acid battery used in dynamic voltage restorer.IEEE Proceedings Gener Transm Distrib, 150, 2175–2182.
17. Chahwan, J., Abbey, C., & Joos, G. (2007). VRB modelling for the study of output terminal voltages, internal losses and performance. InElectrical Power Conference 2007(pp. 387–392). Montreal: IEEE Canada.
18. Barote, L., Marinescu, C., & Georgescu, M. (2009).VRB modeling for storage in stand-alone wind energy systems(pp. 1–6). Bucharest: PowerTech 2009 IEEE Bucharest.
19. Barote, L., Georgescu, M., & Marinescu, C. (2009).Smart storage solution for wind systems(pp. 1–6). Bucharest: PowerTech 2009 IEEE Bucharest. 20. Barote, L., Weissbach, R., Teodorescu, R., Marinescu, C., & Cirstea, M. (2008).
Stand-alone wind system with vanadium redox battery energy storage. In
Proc International Conference Optimization Electrical Electron Equipment(pp. 407–412).
21. Rathore, A. K., Patil, D. R., & Srinivasan, D. (2016). Non-isolated bidirectional soft-switching current-fed LCL resonant DC/DC converter to Interface energy storage in DC microgrid.IEEE Transactions on Industry Applications, 52(2), 1711–1722.
22. Amjadi, Z., & Williamson, S. S. (2014). Digital control of a bidirectional DC/DC switched capacitor converter for hybrid electric vehicle energy storage system applications.IEEE Transactions on Smart Grid, 5(1), 158–166. 23. García, P., Arboleya, P., Mohamed, B., & Vega, A. A. C. (2016). Implementation
of a hybrid distributed/centralized real-time monitoring system for a DC/AC microgrid with energy storage capabilities.IEEE Transactions on Industrial Informatics., 12(5), 1900–1909.
24. Korunović, L. M., Sterpu, S., Djokić, S., Yamashita, K., Villanueva, S. M., & Milanović, J. V. (2012). Processing of load parameters based on existing load models. In Proc 3rd IEEE International Conference Innovative Smart Grid Technologies(pp. 1–6).
25. Choi, B.-K., Chiang, H.-D., Li, Y. H., Chen, Y.-T., Huang, D.-H., & Lauby, M. G. (2006). Measurement-based dynamic load models: Derivation, comparison, and validation.IEEE Transactions on Power Apparatus and Systems, 21(3), 1276–1283.
26. Rudolph, G. (1994). Convergence analysis of canonical genetic algorithms.
IEEE Transactions on Neural Networks, 5(1), 96–101.
27. Knyazkin, V., Canizares, C. A., & Soder, L. H. (May 2004). On the parameter estimation and modeling of aggregate power system loads. IEEE Transactions on Power Apparatus and Systems, 19(2), 1023–1031.
28. Zhu, Y., & Tomsovic, K. (2002). Adaptive power flow method for distribution system with dispersed generation.IEEE Transactions on Power Delivery, 17(3), 822–827.
29. Fortes, M. Z., Ferreira, V. H., & Coelho, A. P. F. (2013). The induction motor parameter estimation using genetic algorithm.Latin America Transactions IEEE, 11(5), 1273–1278.
30. Duan, F., Živanović, R., Al-Sarawi, S., & Mba, D. (2016). Induction motor parameter estimation using sparse grid optimization algorithm. IEEE Transactions on Industrial Informatics, 12(4), 1453–1461.
31. Ju, P., Wu, F., Shao, Z.-Y., Zhang, X.-P., Fu, H.-J., Zhang, P.-F., He, N.-Q., & Han, J.-D. (2007). Composite load models based on field measurements and their applications in dynamic analysis.IET Generation, Transmission & Distribution, 1(5), 724–730.