AUSTRALIAN JOURNAL OF BASIC AND
Open Access Journal
Published BY AENSI Publication
© 2016 AENSI Publisher All rights reserved
This work is licensed under the Creative Commons Attribution
http://creativecommons.org/licenses/by/4.0/
To Cite This Article: R.Manikandan, L.Jegatha Deborah,N.Arul,P.Ashok Kumar,.Renga Rajan Response in Quality-of-Service for Cloud Computing
System of Systems for Observation and Response in Quality
Cloud Computing Environments
1R.Manikandan, 2L.Jegatha Deborah,3N.Arul,
1,3Research Scholar, St.Peter’s University, Department of CSE,
2Assistant Professor, University College of Engineering Tindivanam, Department of CSE 4
Lecturer, University College of Engineering Tindivanam,
5Professor, Vel Tech Multi Tech, Department of CSE
Address For Correspondence:
Manikandan Ramamurthy, Research Scholar, Department of Computer Science and Engineering, St Peter’s University, Tamilnadu, India. Tel: +91-9943222676, email: [email protected]
ARTICLE INFO Article history:
Received 04 December 2015 Accepted 22 January 2016 Available online 14 February 2016
Keywords:
Cloud computing, distributed denial of service (DDoS), enterprise systems, information assurance, net centric, quality of service (QoS), security, service-oriented architecture (SOA), systems of systems (SoS).
As economic pressure intensifies for network and enterprise operations centers, those responsible for these centers searching a new technique for
quantity of data is a product of the evolution of comple
dissimilar users in distributed locations share gigabytes, terabytes, or production networks. Cloud Computing (
reducing the cost through shared computing resources whereas distributing the data to multiple end users efficiently. However, complex systems that use cloud computing, such as shown in Fig. 1, are prone to failure and security compromise in five main areas:
performance (e.g., latency and time delay e (e.g., interoperability between cloud providers),
learn how to prevent incidents, and collect information for future actions), a protect the confidentiality and integrity of data and ensure data availability)
Badger, L., et al., 2012). Present approaches to mitigate these issues are not sufficient to ensure quality service (QoS) for end users (Mithani, M.F.,
AUSTRALIAN JOURNAL OF BASIC AND
APPLIED SCIENCES
ISSN:1991-8178 EISSN: 2309-8414 Journal home page: www.ajbasweb.com
© 2016 AENSI Publisher All rights reserved
This work is licensed under the Creative Commons Attribution International License (CC BY).
http://creativecommons.org/licenses/by/4.0/
R.Manikandan, L.Jegatha Deborah,N.Arul,P.Ashok Kumar,.Renga Rajan, System of Systems for Observation and Service for Cloud Computing Environments. Aust. J. Basic & Appl. Sci., 10(2): 199-211
System of Systems for Observation and Response in Quality
Cloud Computing Environments
N.Arul,4P.Ashok Kumar, 5A.Renga Rajan
Research Scholar, St.Peter’s University, Department of CSE, Chennai ,Tamilnadu, India.
Assistant Professor, University College of Engineering Tindivanam, Department of CSE, Tamilnadu, India. Lecturer, University College of Engineering Tindivanam, Department of CSE, Tamilnadu, India.
Multi Tech, Department of CSE, Chennai, Tamilnadu, India.
Manikandan Ramamurthy, Research Scholar, Department of Computer Science and Engineering, St Peter’s University, 9943222676, email: [email protected]
ABSTRACT
In commercial computing systems, military and academic, and evolve from autonomous entities that deliver computing products into group of centric venture systems that bring out computing as a service, opportunities emerge to consolidate software, computing resources and information throughout the cloud computing. Along with these opportunities come challenges, predominantly to service providers and operations centers that struggle to monitor and manage the quality of service (QoS) in order to meet up customer service commitments for these services. Conventional approaches fall short in addressing these disputes because they inspect QoS from a limited perception rather than from a system-of-systems (SoS) viewpoint applicable to a net-centric enterprise system in which any user from any position can share computing resources in any time. This paper we presents a SoS approach to permit QoS management, monitoring, and response for enterprise systems that bring out computing as a service through a cloud computing environment. A existing example is provided for claim this new SoS approach to a real-world scenario (viz., distributed denial of service). Simulated results confirm the efficacy of the approach.
INTRODUCTION
As economic pressure intensifies for network and enterprise operations centers, those responsible for these centers searching a new technique for lower costs in the presence of data burden. This dramatic increase in the quantity of data is a product of the evolution of complex net-centric enterprise systems over which multiple dissimilar users in distributed locations share gigabytes, terabytes, or even petabytes of data at high speeds over Computing (CC) provides one possible techniques to meet this challenge by reducing the cost through shared computing resources whereas distributing the data to multiple end users , complex systems that use cloud computing, such as shown in Fig. 1, are prone to failure and security compromise in five main areas: cloud reliability (e.g., network connectivity),
(e.g., latency and time delay experienced by a system when processing a request),
(e.g., interoperability between cloud providers), compliance (e.g., digital forensics to discern what happened, learn how to prevent incidents, and collect information for future actions), and information security
protect the confidentiality and integrity of data and ensure data availability) (Mell, P. and T. Grance, 2011 . Present approaches to mitigate these issues are not sufficient to ensure quality
Mithani, M.F., et al., 2010).
System of Systems for Observation and 211, 2016
System of Systems for Observation and Response in Quality-of-Service for
Manikandan Ramamurthy, Research Scholar, Department of Computer Science and Engineering, St Peter’s University, Avadi, Chennai,
In commercial computing systems, military and academic, and evolve from tonomous entities that deliver computing products into group of centric venture systems that bring out computing as a service, opportunities emerge to consolidate software, computing resources and information throughout the cloud computing. Along
ese opportunities come challenges, predominantly to service providers and operations centers that struggle to monitor and manage the quality of service (QoS) in order to meet up customer service commitments for these services. Conventional short in addressing these disputes because they inspect QoS from a systems (SoS) viewpoint applicable to centric enterprise system in which any user from any position can share y time. This paper we presents a SoS approach to permit QoS management, monitoring, and response for enterprise systems that bring out computing as a service through a cloud computing environment. A existing example is provided world scenario (viz., distributed denial of service). Simulated results confirm the efficacy of the approach.
Recent survey articles (Spring, J., 2011; Spring, J., 2011; Wei, Y. and M. Blake, 2010; Zhang, Q., et al., 2010) summarize challenges for cloud computing to provide mechanisms to mitigate the issues listed above, the need for monitoring the various layers of the cloud computing environment, and the need to provide end-to-end solutions for the problems. The architectural frameworks considered in these excellent surveys are one dimensional and principally deal with the infrastructure, platform, and software as service layers of cloud computing. Federated clouds with cross-cloud connectivity provide an opportunity mentioned in (Wei, Y. and M. Blake, 2010) to support service-oriented computing, and QoS is discussed in (Calheiros, R., R. Ranjan and R. Buyya, 2011) but is limited in application to the task of virtual machine provisioning in data centers rather than to end-user satisfiability. None treats the clouds from a system-of-systems point of view as is done here. The architectural model used here to support a service-oriented architecture (SOA) is multidimensional, extending to layers of business and governance as services, while reducing complexity by combining the traditional platform and applications layers into one software layer that provides overall Software as a Service (SaaS) to end users. Furthermore, specific locations and the use of software agents for monitoring and observation in this system of systems (SoS) are presented.
Motivation:
QoS specification and monitoring for cloud ser- vices is a complex and challenging issue, one where there are few universal benchmarks or standards. While the usual quality metrics such as uptime and reliability may still be considered applicable in the context of cloud systems, it is less clear what the QoS parameters unique to such systems are and how they should be applied in specific contexts. A lack of common metrics to be applied to cloud offerings from various providers is also a barrier to standardization of cloud offerings from different providers. Thus, although “federated” clouds using services from different providers are thought to be the way of the future, it is not yet possible to construct complex services using a mixture of services from different cloud providers (Rochwerger, B., et al., 2011). QoS parameters are also often specified in semi-technical legalese, and it is a challenge to derive their appropriate mathematical formulations.
Another issue with QoS parameters and their evaluation is that there typically are multiple metrics, some positive (where a higher value means a better QoS, e.g., network bandwidth) and some negative (where a lower value means a better QoS, e.g., network latency), and it is far from obvious how, in general, the various parameters should be weighted and compared (particularly in cases where the metrics are incompatible or unavailable all at once). This, in fact, is an example of a challenging problem in multicriteria decision making, for which a method called simple additive weighting (Gwo-Hshiung, T., et al., 2011) has been applied in the past in the context of web services (Zeng, L., et al., 2004). More recently, in the context of cloud computing, simple additive weighting and the analytic hierarchy process (Saaty, T.L., 1990) have been used (Prasad, A.S. and S. Rao, 2014) to scale and com- pare QoS parameters, both positive and negative
Proper resource allocations to different tiers of a cloud sys- tem are also known to be critical to improving the QoS, but existing approaches tend to be ad hoc and wasteful (Mithani, M.F. and S. Rao, 2012).
The approach presented in this paper introduces a SoS to provide a clear and concise view of QoS events within cloud computing environments that proactively informs enterprise operators of the state of the enterprise and, thereby, enables timely operator response to QoS problems.
Section II provides a step-by-step description of the SoS approach; Section III provides the mathematical model for the QoS metrics considered in our work. Section IV describes the application of this approach to a cyber security scenario in which a complex cloud computing environment is subjected to a distributed denial-of-service (DDoS) attack.
Section V details the experimental results obtained in the prototype system created to verify the SoS approach. Section VI presents benefits and conclusions.
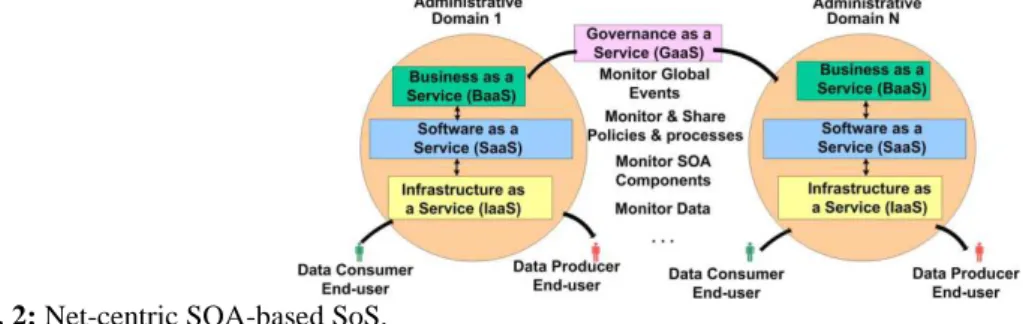
A SoS (Lewis, G.A., et al., 2009; White, S.M., 2009; Defense Acquisition Guidebook (DAG), Jan. 2012; SSE, Aug. 2008) possesses the characteristics shown in Table I. Fig. 2 presents a SoS comprising a system of multiple
Fig. 2: Net-centric SOA-based SoS.
administrative domains operating within a SOA-based cloud computing system (Hershey, P. and D. Runyon, 2007). For the system depicted in Fig. 2, a single authority provides governance services to multiple heterogeneous administrative domains in which SOA-based applications enable business and collaboration services that support end users who are producing and consuming data using software and infrastructure services.
Step 2:
Derive framework for QoS monitoring, management, and response in cloud computing environments. The Enterprise Monitoring, Management, and Response Architecture (EMMRA) for Cloud Computing Environments (EMMRA CC), as shown in Fig. 3, extends previous work (Hershey, P. and D. Runyon, 2007) to provide structure from which to identify points within the administrative domains of Fig. 2 where key QoS metrics may be monitored and managed.
This framework is multidimensional to enable an end-to end view of the system where metric viewpoints may be located within traditional Open Systems Interconnection (OSI) layers (infrastructure through applications/software) and SOA-based layers (business and governance), as well as across these layers.
Table I: -SoS CHARACTERISTICS
Structural A SoS has a structure that comprise interdependent systems that integrate to form a higher order system, usually resulting in a hierarchy. This hierarchy can include monitoring and response at the highest-level system down to the smallest sub-component system(i.e. bit level).
Coupling The system comprise a SoS include coupling with respect to such areas as data, information, functions, state, and algorithm. A loss of any portion of the SoS will degrade the overall performance or capabilities of the higher order system; therefore, the systems are independent.
Behavioral Integration of decisions and actions of systems occurs in the higher order system through governance in contrast to non-SoS where the sharing of information is the basis for collaboration.
Interoperable Systems that comprise a SoS interface with one another and interoperate by design in contrast to non-SoS where aystems are not designed to do so.
The X dimension (Response Time) defines time-based services based on measurement time intervals (MTIs) ranging from microseconds to days or beyond, depending on the time criticality of the information to the mission. In each domain, the term service refers to any program, algorithm, function, analysis technique, or monitoring activity that uses or interprets enterprise system information. A service can be a single individual or group of individuals (e.g., individuals doing problem determination or analysis), a program providing statistics, a piece of code performing network functions (such as load balancing), or another entity using network data. Different services in which network managers are interested require different time periods (i.e., MTIs) for data collection. For example, a critical mission in which lives may be at stake could require real-time (i.e., microsecond) monitoring, analysis, and response for QoS event problem determination.
On the other end of the spectrum, a department store studying customer trends may be content to collect and analyze data on a daily basis as they plan for an upcoming sales event. Traditional performance measurement and analysis approaches do not have the flexibility to collect data and assess QoS performance in real time for the wide range of MTIs required by enterprise-level services. A need exists for a flexible data collection device that can collect information within complex enterprise systems for varying MTIs. EMMRA CC provides this flexibility and thereby meets critical QoS mission requirements for diverse missions with varying MTIs.
The Y dimension (Domains) detects and responds to enterprise events using similar techniques and instrumentation. A key contribution from this step is the extension of the domain dimension from Infrastructure as a Service (IaaS) and SaaS, where traditional techniques attempt to enforce QoS in cloud computing environments, to include Business as a Service (BaaS) and Governance as a service (GaaS) to meet the challenges of SOA-based net-centric enterprise systems. For BaaS, EMMRA CC focuses on monitoring business processes and managing these to ensure their uniform implementation among end users. For GaaS, EMMRA CC identifies ownership of governance services and enables the institution and enforcement of policies that influence enterprise-wide behavior.
The Z dimension (Planes) introduces structures that monitor and manage particular end-to-end events. Planes (namely, usage, control, management, and cyber security) encompass all domains and thereby provide a cross-domain solution that enables enterprise-wide monitoring, management, and response. Planes also span multiple MTIs, enabling them to address multiple and diverse services. Implementing a plane- based approach within a SOA methodology is highly effective compared with existing domain-only QoS parameter evaluation techniques because the EMMRA CC approach fills the gaps between the domain monitoring layers. For example, the usage monitoring plane encompasses those activities that filter, collect, analyze, and disseminate information about the user data. The monitoring and management of this information could originate with an activity in the GaaS domain (e.g., dissemination, implementation, and assessment of operational polices), but this activity can then influence similar activities within the BaaS, SaaS, and IaaS domains. The usage monitoring plane provides this enterprise-wide view.
Step 3a:
Identify Cloud computing metrics. To enable effective QoS monitoring, management, and response across and among multiple and diverse enterprise operations centers, we define relevant service-based QoS metric categories and metrics within those categories. The term service-based metric represents an object that has a name (i.e., metric name), a definition, a value (i.e., measure), an observation time period, a computing or collection method (i.e., measurement), and one or more threshold values for setting alarms (e.g., minor, major, and critical). In this paper, whenever the word metric is used, it refers to the metric name of the metric object. The term measure is a quantitative value of the metric object derived for the observation time interval. The term measurement is the computing or collection process or method of determining the value of the metric object.
To clarify the meaning of these definitions, consider the example of a toll bridge with two parameters of interest: the length of the bridge and the number of cars that have passed over the bridge. Let the service provider be the local department of transportation whose mission is to determine whether the capacity of the bridge is adequate or if a second bridge span will be required to handle the traffic at some time in the future. A common characteristic of metrics is that they change over time. The length of the bridge is static over time and does not change regardless of how often it is measured. Thus, this parameter is not a metric. By contrast, the number of cars that have passed over the bridge requires counting cars over an observation time interval.
This observation time interval could be the last hour, the last day, or from the time that the bridge first opened. The number of cars counted can be reset to zero at the beginning of the observation time interval as required by the end user in order to best meet the purpose of collecting the traffic flow information, e.g., throughput analysis or capacity planning. For this example, the terminology number of cars that have passed over the bridge is a service-based metric. The value representing the counted number of cars per observation time interval provides the measure for the metric. The measurement method for the metric could be to use a sensor placed across the lanes of the bridge that would advance a counter each time a car passed over it.
as shown in Table II. In Section V, we present results for the categories of Delay, Delay Variation, Throughput, Authentication, Authorization, and Certification and Accreditation.
Table II: Metrics Categories
Category Metric
Performance Delay
Delay variation Throughput Information Overhead
Security Authentication
Authorization Non-repudiation Integrity
Information availability Certification & accreditation Physical Security
Delay is the elapsed time observed for a completed or on-going task and is caused by processing, queuing, and transmission of data. Examples of other terminology used interchangeably with delay include response time, round-trip time, and latency. Delay metrics identify when the cumulative effects of processing and transport hinder the end users ability to accomplish the mission. It is obvious to the end user and therefore influences customer satisfaction.
The comparison of delay for different observation time intervals is Delay Variation. Examples of delay variation include the following: the variation in application response time between peak and nonpeak hours, the edge-to-edge delay variation in the pattern of packet arrival events, and jitter. Delay variation identifies system instability that either presently prevents the end users from successfully executing their missions or that is a forewarning of upcoming problems that will do so.
Throughput metrics describe the amount of work completed over a time period (Denning, P.J. and J.P. Buzen, 1978). Throughput metrics identify the level of work accomplished by the team, application, computer, and network. Proper interpretation of these metrics enhances productivity, efficiency, and resource allocation.
The Authentication metrics category includes metrics that confirm the identity of users, systems, or data sources. Authentication employs one or more mechanisms such as passwords, key exchange, digital certificates, and biometrics. Confirmation of entity identity is a fundamental requirement in establishing trust and confidence in the service and enabling other security functions.
User Authorization metrics report the success and failure of access to resources based on policy and permission levels. Authorization extends authentication confirming an entity’s identity to define the entity’s privileges (i.e., those functions that the entity can be trusted to perform). Authorization metrics enforce the principle of least privilege. By ensuring that entities are assigned the fewest privileges consistent with their mission, the overall service integrity is maintained, and mission effectiveness is enhanced.
Certification and Accreditation (C&A) is the comprehensive evaluation of the technical and nontechnical security features of an IT system and other safeguards, made in support of the accreditation process, to establish the extent to which a particular design and implementation meets a set of specified security requirements (DoD, 1997). DoD requires C&A security through the DoD Information Technology Security Certification and Accreditation Process. Metrics within the C&A metrics category identify security risks and deficiencies, provide information to help ensure that steps are taken to correct these deficiencies and vulnerabilities, and provide information to help ensure the safeguarding of applications, networks, systems, data and information.
Step 3b:
Measuring performance metrics. When considering heterogeneous resource types, having a baseline for measuring all performance and security metrics is nontrivial. In our work, we measure low-level independent performance metrics such as delay at each level of EMMRA CC. In the prototype of an online transaction processing application, we measure the response time at each of the layers. Specifically, we measure the following: 1) time taken for a database query to return the results (on the cloud instance hosting the database), 2) time taken by the application logic to execute (on the cloud instance hosting the application server), and 3) time taken for the data to be transmitted over the network between the application server and the database server. Throughput is measured as the number of transactions completed when viewed from the application perspective and hence is measured on the instance hosting the application server. A similar approach to measure performance metrics for SLA management has been used in earlier work (Emeakaroha, V., et al., 2010).
Step 4:
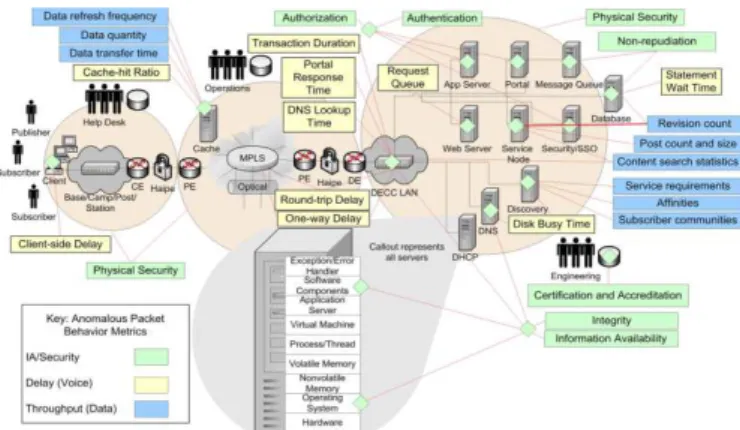
Identify suitable locations within the cloud computing environment for metric detection. This identifies suitable locations to observe and collect the metrics in Table
II. Fig. 4 shows these locations for an expanded set of metrics for security (green boxes), delay (yellow boxes), and throughput (blue boxes) for a representative cloud computing environment realized through a SOA-based net-centric enterprise sys- tem. This system includes four user communities: 1) end users shown with the client workstation, 2) help desk shown with the trouble management system database, 3) operations shown with the configuration management database, and 4) Engineering shown with the project control and development tracking database. With respect to the system components, the end-user client machines that run applications over the base/camp/post/station network appear at the left side of the figure. The network edge appears as a Customer Edge (CE) router attached to a High Assurance IP Encryptor (HAIPE) device and a Provider Edge (PE) router, along with a cache. The core network includes information transported via Multiprotocol Label Switching (MPLS), Dense Wave Division Multiplexing, and Synchronous Optical Network services. The network terminates at a Defence Enterprise Computing Center (DECC) with the connection from a second PE router to a HAIPE device and then to a DECC Edge (DE) router and a DECC LAN. To the right of the DE are the computing services to be shared through a cloud computing environment, including those for dynamic host configuration protocol (DHCP), Distributed Names System (DNS), Discovery, App Server, Portal, Message Queue, Web Server, Service Node, Security, and Database. As an example, we provide the rationale used to select the locations for IA/security metrics.
Authentication:
Cyber security can be monitored at the Apps, Portal, and Security/SSO servers. For example, EMMRA CC agents can monitor Security Assertion Mark-up Language authentication assertions at the Security/SSO server. These assertions facilitate the secure exchange of authentication information between systems regardless of their underlying security mechanisms.
Likewise, EMMRA CC agents can effectively monitor and respond to Authorization events from the Apps, Portal, and Security/SSO servers where they can monitor and respond to information such as need-to-know determination required to grant authorization to a resource. This is typically implemented in the DD Form 2875, System Authorization Access Request. For this example, EMMRA CC agents embedded within the Apps server would report the number of roles supported and the number of users assigned to each role, including the number added and the number removed over an observation period. The EMMRA CC agent would also monitor system resources access attempts to determine authorization failures.
Non-repudiation confirms that a transaction between two parties took place. Thus, a good location for EMMRA CC agents would be at the receiving end or a processing intermediary, such as the Message Queue in Fig. 4. Here, the EMMRA CC agents can observe confirmation of messages both from the sender to the agent and from the agent to the receiver.
A prime location to monitor and respond to Integrity events is the DNS server. For example, web applications use DNS name resolution to resolve IP addresses. An attack called DNS poisoning corrupts the DNS domain-to-IP address database such that requests are redirected from the legitimate server to the attackers’ server for the purpose of presenting fraudulent content or collecting sensitive information. To prevent DNS integrity problems, EMMRA CC agents should audit all administrative updates to the master database and data transfer activity and provide a response so that operators con- figure DNS such that the end user never directly contacts the master database. EMMRA CC agents should search the DNS logs for particular events such as spikes in DNS traffic that could indicate a redirection.
In addition, EMMRA CC agents should work with Intrusion Detection Systems, Intrusion Prevention Systems, anti-virus and configuration tracking soft- ware at the DNS servers to deter unauthorized changes to the server.
DECC LAN router and DHCP server to observe malicious traffic that could reduce information availability below its required threshold, thereby indicating spurious threat activity at individual servers. The commander Joint Task Force for Computer Network Defense can use this metric to set and track the Information Operations Condition (INFOCON) (Installations and Resources,2005). Based on the INFOCON status level, a Collection and Analysis (CA) node in the operations centre can invoke countermeasures to uniformly heighten or reduce defensive posture, defend against computer network attacks, and mitigate sustained damage to the DoD information infrastructure.
Certification and Accreditation monitoring and response supports the DoD Information Assurance Certification and Accreditation Process Instruction (http://www.ietf.org/rfc/rfc2679.txt). EMMRA CC agents distributed within the engineering project control and development-tracking database can provide the relevant information to support ongoing certification and accreditation.
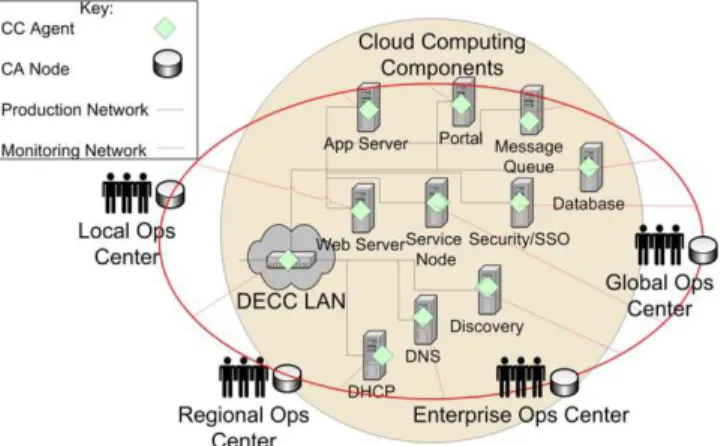
Fig. 5: Locations for EMMRA CC agents and CA nodes.
The DoD requires Physical Security for every enclave of a net centric enterprise system. Thus, each user community could benefit from embedded EMMRA CC agents located at perimeter devices that indicate destruction, theft, or sabotage from unauthorized access to facilities, equipment, material, data, information, or documents.
Step 5:
Identify potential implementation schemes from which to collect and analyze the cloud computing QoS metrics. One possible scheme presented in this paper embeds EMMRA CC agents within multiple diverse cloud computing components where they can continuously monitor the enterprise system for QoS metrics associated with cloud computing environments (e.g., delay, throughput, and security metrics). These agents communicate over an out-of-band (OOB) monitoring network to EMMRA CC CA nodes that are located at local, regional, enterprise, and global operations centers, as shown in Fig. 5.
III. System Model:
Here, we describe the mathematical model for the QoS metrics considered in our work. Furthermore, we describe the possible response actions to be considered on a QoS breach. We describe the individual metric classes considered in Table II.
A. Performance:
The performance QoS metrics are additive in the numerical sense. The SoS view from the top-level domain in Fig. 3 (i.e., GaaS) perceives delay as a sum of the delays experienced in the other lower domain levels of the cloud. This is also dependent on the infrastructure components used to provide the service. Hence, we must include the component-induced performance degradation. The delay metric can be represented as
DSoS = p1 · DG + p2 · DB + p3 · DS + p4 · DI (1)
throughput at a lower level in EMMRA. Hence, we have TI = n × Transaction Throughput
TS = m × TI
TB = q × TS . (2)
Here, m, n, and q are the numbers of transactions at the lower domain needed to complete a transaction in the higher domain. Additionally, at each level, throughput is additive in nature. For example, at the software layer, if there are p operations independent of each other (which may or may not require services from the infrastructure layer), then the throughput of the software layer is the sum total of the number of operations completed per unit time.
B. Security:
Security can be thought of as a functional requirement of the system. It comprises authentication and authorization using certificates and accreditation.
The authentication QoS metric is the logical conjunction at each level in EMMRA. The users’ access to the system ceases at the level authentication fails. Hence, the SoS view of authentication is a logical AND of the authentications at various levels in EMMRA. Security can be viewed as a top- down metric, i.e.,
ASoS = AG ∧ AB AS AI . ∧ ∧ (3)
The lower level EMMRA components have to be kept secure from the end user. A user at the top level can obtain service from the bottom levels but is not authorized to access the components directly. Only specific personnel are allowed access to the lower level components (viz., administrators). Hence, in order to obtain access to lower level components, the user needs to be authenticated at the top level. This is modeled in (3).
Authorization, however, is a bottom-up metric and is applicable at each level. User access to the service at any layer of EMMRA is subject to authorization. The authorization is such that the least privilege is granted sufficient to accomplish the operation. Authorization is applicable at each level in EMMRA CC. For example, in a banking application, an administrator is not authorized to access account details of the customer of the bank. Authorization at the IaaS level can be represented as where pi is the permission to perform action i at the IaaS level. The min operator is used here as an indication of the least privilege level that is granted to the user. Authorization is defined similarly for the rest of the levels in EMMRA CC. The SoS view of authorization can be obtained using methods such as linear logic (Girard, J.-Y., 1987).
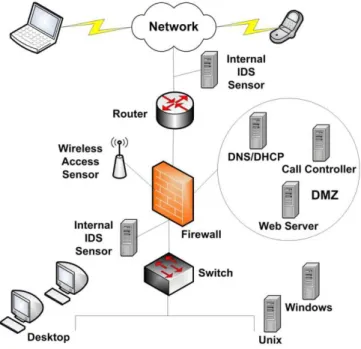
Fig. 6: Security enclave.
IV. Real -World Applicat Ion Scena Rios:
of these domains that could compromise the transactions and cause potentially devas end user.
DDoS cyber attacks are on the rise with ever increasing sophistication and costs to victims. A DDoS attack attempts to exhaust the victims’ resources, including network bandwidth, computing power, and operating system data structures. To launch a DDoS attack, malicious users first build a network of computers that they will use to produce the volume of traffic needed to deny services to computer users. To create this attack network, attackers discover vulnerable sites or
install new programs (known as attack tools running these attack tools are known as attacker. Many zombies together form an
attacker coordinates and orders master zombies, and they, in turn, coordinate and trigger sl
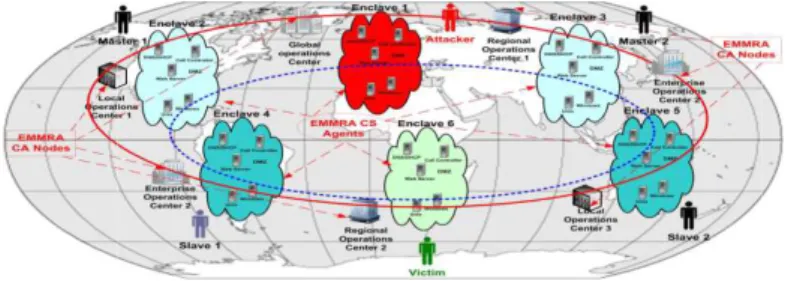
a large volume of packets to the victim, flooding its system with useless load and exhausting its resources. In order to devise and defend against DDoS attacks in a cloud computing environment, we segregate this system into security enclaves, i.e., a collection of computing environments connected by one or more internal networks under the control of a single authority and security policy. Fig. 6 depicts the main components of a security enclave (Available: http://goo.gl/Ja8Ajk
Zone (DMZ), which is defined as a security
Fig. 7: Operational view of EMMRA CC agents and CA node deployment to counter DDoS
boundary created between two security policy
enclave, while it reduces the chances and severity of a DDoS attack, does not guarantee attack protection. Fig. 7 depicts a scenario in which
communicate over a global network
using master zombies (i.e., bots) in enclaves 2 and 3 and slave zombies in enclav sustain the DDoS attack on a victim in enclave 6.
The EMMRA CC nodes are distributed among local, regional, enterprise, and global operations centers, as described Section II, and communicate in an OOB network, as shown in Fig. 7
This distribution of CA nodes corresponds to the domain layers of the EMMRA CC framework in Fig. 3 and enables DDoS detection and response for infrastructure, software, business, and governance layers of SOA enabled cloud computing environments
through software or by programmable hardware devices.
They are initially programmed to collect and analyze metrics from CC agents that indicate anomalous data relevant to their original mission, e.g.
collaboration. Once anomalous behavior
isolate the threat and provide response, viz., shut down the affected links and re do not lose QoS. V. RESULTS
Here, we describe the experimental setup and our insights into of an online transaction processing application. While each layer of
Table III: Descriptive Statistics O F Applicat Ion Instance
of these domains that could compromise the transactions and cause potentially devastating consequences to the
DDoS cyber attacks are on the rise with ever increasing sophistication and costs to victims. A DDoS attack attempts to exhaust the victims’ resources, including network bandwidth, computing power, and operating ata structures. To launch a DDoS attack, malicious users first build a network of computers that they will use to produce the volume of traffic needed to deny services to computer users. To create this attack network, attackers discover vulnerable sites or hosts on the network that are then exploited by attackers who attack tools) on the compromised hosts of the attack network. The hosts that are running these attack tools are known as zombies, and they can carry out any attack under the control of the attacker. Many zombies together form an army that comprises both master zombies and
attacker coordinates and orders master zombies, and they, in turn, coordinate and trigger sl
a large volume of packets to the victim, flooding its system with useless load and exhausting its resources. In order to devise and defend against DDoS attacks in a cloud computing environment, we segregate this
enclaves, i.e., a collection of computing environments connected by one or more internal networks under the control of a single authority and security policy. Fig. 6 depicts the main components of a http://goo.gl/Ja8Ajk; Available: http://goo.gl/Xhy4L2), including a Demilitarized Zone (DMZ), which is defined as a security
Operational view of EMMRA CC agents and CA node deployment to counter DDoS
boundary created between two security policy-enforcing components. Note that the existence of a security enclave, while it reduces the chances and severity of a DDoS attack, does not guarantee attack protection.
Fig. 7 depicts a scenario in which a cloud computing sys- tem comprises six security enclaves that a global network. In this scenario, an attacker residing in enclave 1 launches a DDoS attack using master zombies (i.e., bots) in enclaves 2 and 3 and slave zombies in enclaves 4 and 5 to initiate and sustain the DDoS attack on a victim in enclave 6.
The EMMRA CC nodes are distributed among local, regional, enterprise, and global operations centers, as described Section II, and communicate in an OOB network, as shown in Fig. 7.
This distribution of CA nodes corresponds to the domain layers of the EMMRA CC framework in Fig. 3 and enables DDoS detection and response for infrastructure, software, business, and governance layers of SOA enabled cloud computing environments (Hershey, P. and C. Silio, 2012). EMMRA CA nodes are implemented through software or by programmable hardware devices.
They are initially programmed to collect and analyze metrics from CC agents that indicate anomalous data relevant to their original mission, e.g., excessive delay on voice-based links used for military operations behavior is detected, then the CA node conducts correlation and analyses to isolate the threat and provide response, viz., shut down the affected links and redistribute traffic so that the users
Here, we describe the experimental setup and our insights into the QoS in a SoS setup online transaction processing application. While each layer of
Descriptive Statistics O F Applicat Ion Instance
tating consequences to the
DDoS cyber attacks are on the rise with ever increasing sophistication and costs to victims. A DDoS attack attempts to exhaust the victims’ resources, including network bandwidth, computing power, and operating ata structures. To launch a DDoS attack, malicious users first build a network of computers that they will use to produce the volume of traffic needed to deny services to computer users. To create this attack hosts on the network that are then exploited by attackers who ) on the compromised hosts of the attack network. The hosts that are , and they can carry out any attack under the control of the and slave zombies. The attacker coordinates and orders master zombies, and they, in turn, coordinate and trigger slave zombies that send a large volume of packets to the victim, flooding its system with useless load and exhausting its resources.
In order to devise and defend against DDoS attacks in a cloud computing environment, we segregate this enclaves, i.e., a collection of computing environments connected by one or more internal networks under the control of a single authority and security policy. Fig. 6 depicts the main components of a , including a Demilitarized
Operational view of EMMRA CC agents and CA node deployment to counter DDoS attacks.
enforcing components. Note that the existence of a security enclave, while it reduces the chances and severity of a DDoS attack, does not guarantee attack protection.
tem comprises six security enclaves that residing in enclave 1 launches a DDoS attack es 4 and 5 to initiate and
The EMMRA CC nodes are distributed among local, regional, enterprise, and global operations centers, as
This distribution of CA nodes corresponds to the domain layers of the EMMRA CC framework in Fig. 3 and enables DDoS detection and response for infrastructure, software, business, and governance layers of
SOA-. EMMRA CA nodes are implemented
They are initially programmed to collect and analyze metrics from CC agents that indicate anomalous data based links used for military operations is detected, then the CA node conducts correlation and analyses to distribute traffic so that the users
the application was hosted on a different cloud instance, the cloud itself was deployed in a private network. This allows us to demonstrate the dependence of performance metrics on the
degradation or, in our example, a lack of such degradation. For example, because the setup was deployed in a private gigabit Ethernet supported network, we can hardly feel the presence of a network
transactions.
Network-induced delay is a significant component of induced degradation in enterprise systems that have a global presence. Our setup emulates the setup followed by many of the online transaction processing applications in the enterprise environment. The descrip
instance are shown in Table III. With a large standard deviation, the delay variations are large. In addition, we note that the data are skewed with a huge difference between minimum and maximum delays.
similar to real- world applications (Iyengar, A., M. Squillante and L. Zhang, 1999
A. Delay:
As discussed in Section II, Step 3, delay is one of the primary parameters considered while evaluating the QoS of a system and can be introduced
of the software stack, blocked ports in the network, and data processing delays. In our work, various levels of EMMRA CC. We notice that the delay perceived at the
work is the sum total of delay experienced at every level of EMMRA. This follows the relation established in (1). Table IV indicates that the SoS perspective of delay metric is additive in nature, as discussed in Section
Table IV: Delay Recorded I N Ten Sample Transac Tions
Fig. 8: Variation in delay recorded over time.
Monitoring and characterizing delay helps determine the necessary configuration for a particular type of application stack to be deployed on the cloud. Delay modelling in Section III is an attempt to achieve the same. The experimental evidence provided here supports the model defined earlier.
Although characterization of delay in a deployment is advantageous, it has been noted that a constant in the system. The following section describes the variation in delay and its implications.
B. Variability in Delay:
Although delay is an important performance metric, characterizing and monitoring delay alone is not sufficient in a system. Due to various factors, the delay in the system varies with time and operation being performed. For instance, when processing a data
being processed. In addition, there are various component
simple example, consider Ethernet cards manufactured by different manufacturers,
rating, owing to the raw material used or difference in manufacturing technologies, the delay induced by these the application was hosted on a different cloud instance, the cloud itself was deployed in a private network. This allows us to demonstrate the dependence of performance metrics on the
degradation or, in our example, a lack of such degradation. For example, because the setup was deployed in a private gigabit Ethernet supported network, we can hardly feel the presence of a network
induced delay is a significant component of induced degradation in enterprise systems that have a global presence. Our setup emulates the setup followed by many of the online transaction processing applications in the enterprise environment. The descriptive statistics of the recorded delay for application instance are shown in Table III. With a large standard deviation, the delay variations are large. In addition, we note that the data are skewed with a huge difference between minimum and maximum delays.
Iyengar, A., M. Squillante and L. Zhang, 1999).
As discussed in Section II, Step 3, delay is one of the primary parameters considered while evaluating the QoS of a system and can be introduced into the system because of various reasons, including misconfiguration of the software stack, blocked ports in the network, and data processing delays. In our work,
various levels of EMMRA CC. We notice that the delay perceived at the business or governance level in our work is the sum total of delay experienced at every level of EMMRA. This follows the relation established in (1). Table IV indicates that the SoS perspective of delay metric is additive in nature, as discussed in Section
Delay Recorded I N Ten Sample Transac Tions
Variation in delay recorded over time.
Monitoring and characterizing delay helps determine the necessary configuration for a particular type of deployed on the cloud. Delay modelling in Section III is an attempt to achieve the same. The experimental evidence provided here supports the model defined earlier.
Although characterization of delay in a deployment is advantageous, it has been noted that a constant in the system. The following section describes the variation in delay and its implications.
Although delay is an important performance metric, characterizing and monitoring delay alone is not sufficient in a system. Due to various factors, the delay in the system varies with time and operation being performed. For instance, when processing a data stream, the delay may vary based on the size and type of data being processed. In addition, there are various component-induced factors that affect delay in the system. As a simple example, consider Ethernet cards manufactured by different manufacturers, although the cards have same rating, owing to the raw material used or difference in manufacturing technologies, the delay induced by these the application was hosted on a different cloud instance, the cloud itself was deployed in a private network. This allows us to demonstrate the dependence of performance metrics on the component-induced degradation or, in our example, a lack of such degradation. For example, because the setup was deployed in a private gigabit Ethernet supported network, we can hardly feel the presence of a network-induced delay in the
induced delay is a significant component of induced degradation in enterprise systems that have a global presence. Our setup emulates the setup followed by many of the online transaction processing tive statistics of the recorded delay for application instance are shown in Table III. With a large standard deviation, the delay variations are large. In addition, we note that the data are skewed with a huge difference between minimum and maximum delays. These data are
As discussed in Section II, Step 3, delay is one of the primary parameters considered while evaluating the into the system because of various reasons, including misconfiguration of the software stack, blocked ports in the network, and data processing delays. In our work, we monitor delay at business or governance level in our work is the sum total of delay experienced at every level of EMMRA. This follows the relation established in (1). Table IV indicates that the SoS perspective of delay metric is additive in nature, as discussed in Section III.
Monitoring and characterizing delay helps determine the necessary configuration for a particular type of deployed on the cloud. Delay modelling in Section III is an attempt to achieve the same.
Although characterization of delay in a deployment is advantageous, it has been noted that that delay is not a constant in the system. The following section describes the variation in delay and its implications.
cards may be different on deployment. Observing the delay variation over time (see Fig. 8) helps to identify a particular set of operations that cause maximum
Fig. 9: Variation in observed delay and calculated delay.
delay in the setup. For example, a regular pattern in spikes clearly indicates a set of operations that cause repeated delay in the system. Such operations can be isolated, and remedial actions can be suggested to the users to avert a QoS breach. Another relevant variation in delay is the variation in the ob
computed using the modeling in (1) (without the correction factors
Fig. 10: Throughput: Number of transactions per minute.
This variation accounts for the component induced performance degradation due to which delay is induced in the system. In Fig. 9, we notice this variation in the observed delay and the computed delay value. To account for this component-induced performance
modelling, and hence, it is apt to have
calibration run to determine the accurate values of
C. Throughput:
Throughput is an indicator of the overall system performance. It is desired to have a high
system in the cloud. In our work, we measured throughput at the application and the database layers. The overall system throughput is represented in Fig. 10. Like delay, throughput is a variant in the system. Analyzing the throughput variation pattern allows us to have an insight into the behaviour of the deployment (physical and software components).
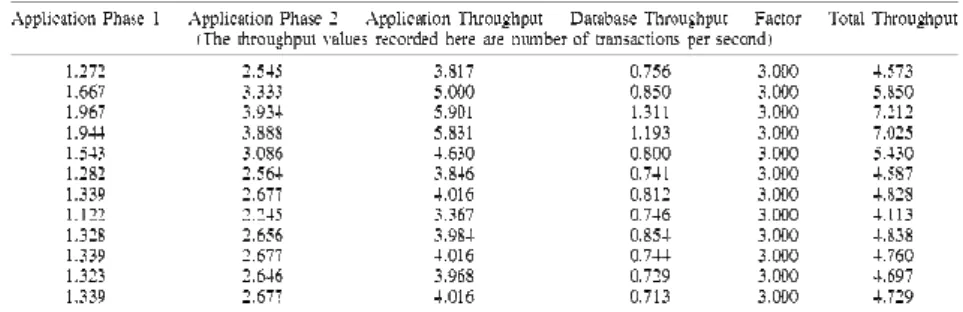
Our application comprises two phases:
the second phase needs three database transactions. We tabulated the findings independently and presented them in Table V. Since all these operations are at the same layer in EMMRA CC, w
additive in nature. The factor in the
Table V: Throughput Of Ten Sample Transac Tions
cards may be different on deployment. Observing the delay variation over time (see Fig. 8) helps to identify a cular set of operations that cause maximum
Variation in observed delay and calculated delay.
delay in the setup. For example, a regular pattern in spikes clearly indicates a set of operations that cause repeated delay in the system. Such operations can be isolated, and remedial actions can be suggested to the users elevant variation in delay is the variation in the ob- served delay and the delay computed using the modeling in (1) (without the correction factors pi ).
Throughput: Number of transactions per minute.
This variation accounts for the component induced performance degradation due to which delay is induced in the system. In Fig. 9, we notice this variation in the observed delay and the computed delay value. To account induced performance degradation, we need to include some correction factors in delay modelling, and hence, it is apt to have pi at each level in EMMRA CC. It may be necessary to perform a calibration run to determine the accurate values of pi in a particular setup.
Throughput is an indicator of the overall system performance. It is desired to have a high
system in the cloud. In our work, we measured throughput at the application and the database layers. The epresented in Fig. 10. Like delay, throughput is a variant in the system. Analyzing the throughput variation pattern allows us to have an insight into the behaviour of the deployment (physical and software components).
Our application comprises two phases: the first phase is independent of the database transactions, whereas the second phase needs three database transactions. We tabulated the findings independently and presented them in Table V. Since all these operations are at the same layer in EMMRA CC, we notice that throughput is
Throughput Of Ten Sample Transac Tions
cards may be different on deployment. Observing the delay variation over time (see Fig. 8) helps to identify a
delay in the setup. For example, a regular pattern in spikes clearly indicates a set of operations that cause repeated delay in the system. Such operations can be isolated, and remedial actions can be suggested to the users served delay and the delay
This variation accounts for the component induced performance degradation due to which delay is induced in the system. In Fig. 9, we notice this variation in the observed delay and the computed delay value. To account degradation, we need to include some correction factors in delay at each level in EMMRA CC. It may be necessary to perform a
Throughput is an indicator of the overall system performance. It is desired to have a high-throughput system in the cloud. In our work, we measured throughput at the application and the database layers. The
epresented in Fig. 10. Like delay, throughput is a variant in the system. Analyzing the throughput variation pattern allows us to have an insight into the behaviour of the deployment
table represents the number of database transactions needed to complete phase 2 of our application. The total throughput shown in Table V follows the additive rule presented in Section III.
Conclusion:
The new approach presented in this paper enables cloud computing service providers and operations centers to meet committed customer QoS levels using a trusted QoS metric collection and analysis implementation scheme that extends traditional monitoring, management, and response for IaaS and SaaS to a complete SOA stack that includes business logic (BaaS) and governance (GaaS). This paper includes real world scenarios that describe the applications of this approach to voice and data systems for performance metrics and to DDoS for security metrics. Next steps include simulating these scenarios to quantify the effectiveness of this approach with respect to operations center response time to restore QoS in the presence of anomalous enterprise events.
REFERENCES
Mell, P. and T. Grance, 2011.“The NIST definition of cloud comput- ing,” Natl. Inst. Standards Technol. (NIST), U.S. Dept. of Commerce, Gaithersburg, MD, USA, NIST Special Publication 800-145. [Online]. Available: http://csrc.nist.gov/publications/nistpubs/800-145/ SP800-145.pdf
Badger, L., T. Grance, R. Patt-Corner and J. Voas, 2012. “Cloud computing synopsis and recommendations,” Natl. Inst. Standards Technol. (NIST), U.S. Dept. of Commerce, Gaithersburg, MD, USA, NIST Special Pub- lication 800-146. [Online]. Available: http://csrc.nist.gov/ publications/nistpubs/800-146/sp800-146.pdf
Mithani, M.F., M. Salsburg and S. Rao, 2010. “A decision support system for moving workloads to public clouds,” in Proc. Annu. Int. Conf. CCV, Singapore, pp: 3-9.
Spring, J., 2011. “Monitoring cloud computing by layer, Part 1,” IEEE Security Privacy, 9(2): 66-68. Spring, J., 2011. “Monitoring cloud computing by layer, Part 2,” IEEE Security Privacy, 9(3): 52-55 Wei, Y. and M. Blake, 2010. “Service-oriented computing and cloud computing: Challenges and opportunities,” IEEE Internet Comput., 14(6): 72-75.
Zhang, Q., L. Cheng and R. Boutaba, 2010. “Cloud computing: State-of-the-art and research challenges,” J. Internet Serv. Appl., 1(1): 7-18.
Calheiros, R., R. Ranjan and R. Buyya, 2011. “Virtual machine provisioning based on analytical performance and QoS in cloud computing environ- ments,” in Proc. ICPP, pp: 295-304.
Rochwerger, B., D. Breitgand, A. Epstein, D. Hadas, I. Loy, K. Nagin, J. Tordsson, C. Ragusa, M. Villari, S. Clayman, E. evy, A. Maraschini, P. Massonet, H. Muoz and G. Tofetti, 2011. “Reservoir—When one cloud is not enough,” Computer, 44(3): 44-51.
Gwo-Hshiung, T., G.H. Tzeng, and J.-J. Huang, 2011. Multiple Attribute Deci- sion Making: Methods and Applications. Boca Raton, FL, USA: CRC Press.
Zeng, L., B. Benatallah, A.H.H. Ngu, M. Dumas, J. Kalagnanam and H. Chang, 2004. “QoS-aware middleware for web services composition,” IEEE Trans. Softw. Eng., 30(5): 311-327.
Saaty, T.L., 1990. Multicriteria Decision Making: The Analytic hierarchy Process: Planning, Priority Setting Resource allocation.Pittsburgh, PA, USA: RWS Publications.
Prasad, A.S. and S. Rao, 2014. “A mechanism design approach to resource procurement in cloud computing,” IEEE Trans. Comput., 63(1): 17-30.
Mithani, M.F. and S. Rao, 2012. “Improving resource allocation in multi-tier cloud systems,” in Proc. 6th Annu. IEEE Int. SysCon, Vancouver, BC, Canada, pp: 356-361.
Lewis, G.A., E. Morris, P. Place, S. Simanta and D.B. Smith, 2009. “Require- ments engineering for systems of systems,” in Proc. 3rd Annu. IEEE Int. SysCon, pp: 247-252.
White, S.M., 2009. “Modeling a system of systems to analyze requirements,” in Proc. 3rd Annu. IEEE Int. SysCon, pp: 83-89.
Defense Acquisition Guidebook (DAG), Jan. 2012. [Online]. Available:
https://dag.dau.mil/Pages/Default.aspx
Systems Engineering Guide for Systems of Systems, Version 1.0, ser. OUSD (A & T) SSE, Aug. 2008. Hershey, P. and D. Runyon, 2007. “SOA monitoring for enterprise computing systems,” in Proc. 11th Int. IEEE EDOC Conf., pp: 443-450.
Denning, P.J. and J.P. Buzen, 1978. “The operational analysis of queueing network models,” ACM Comput. Surv., 10(3): 225-261.
DoD instruction 5200.40: DoD Information Technology Security Certification and
AccreditationProcess,Dec.1997.[Online]. Available:http://csrc.nist.gov/groups/SMA/fasp/documents/c&a /DLABSP/i520040p.pdf
environments,” in Proc. 2010 Int. Conf. HPCS, pp: 48-54.
DoD instruction 5200.80: Security of DoD Installations and Resources,2005. [Online]. Available: http://www.dtic.mil/ whs/directives/corres/pdf/520008p.pdf
IETF, “A one-way delay metric for IPPM,” Fremont, CA, USA, RFC2679. [Online]. Available: http://www.ietf.org/rfc/rfc2679.txt
Girard, J.-Y., 1987. “Linear logic,” Theoretical Comput. Sci., 50(1): 1-101.
Hershey, P. and C. Silio, 2012. “Procedure for detection of and response to distributed denial of service cyber attacks on complex enterprise s ystems,” in Proc. 6th Annu. IEEE Int. SysCon, pp: 85-90.
Network Infrastructure Technology Overview. Version 8,
Release,Apr.27,2012,ArchiveEntry=U_Network_R5_Overview.pdf). [Online]. Available: http://goo.gl/Ja8Ajk
Enclave Security Technical Implementation Guide, Jan. 3, 2011.
(ArchiveEntry=U_Enclave_V4R3_STIG.pdf). [Online]. Available: http://goo.gl/Xhy4L2