The “locus of control” construct first received prominence when Rotter (1966) published his assessment scale of an individual’s generalised expectancies for internal versus external control of reinforcement. The Rotter instrument, said to measure “Locus of Control” was developed on the basis of the social-learning theory (Anastasi, 1990; Schepers, 1995). The theory stresses that the role of reinforcement, regard, and gratification plays a crucial role in determining behaviour. According to Anastasi (1990) the term itself may be seen as part of the concept of causal attribution. Rotter (1966) defined the concept of internal-external locus of control as follows: “When a reinforcement is perceived by the subject as following some action of his own but not being entirely contingent upon his action, then, in our culture, it is typically perceived as the result of luck, chance, fate, as under the control of powerful other, or as unpredictable because of the great complexity of the forces surrounding him. When the individual interprets the event in this way, we label this a belief in external control. If the person perceives that the event is contingent upon his own behaviour or his own relatively permanent characteristics, we have termed this a belief in internal control” (Rotter, 1966, p. 1)
The Locus of Control Inventory (LCI) that was developed by Schepers (1995) is based on Social Learning Theory and Attribution Theory. Schepers described the perception of Locus of Control according to Social Learning Theory as the way in which reinforcement takes place in the social environment, and the effect this has on future behaviour. According to the author, Social Learning Theory, in conjunction with Attribution Theory explains the way in which a person selects information according to inherently stable or invariant characteristics.
According to Schepers (1995) the Locus of Control Inventory measures three constructs, namely Internal Control – the individual believes that outcomes are a consequence of his/her own behaviour; External Control – the individual believes that
outcomes are independent of his/her own behaviour and Autonomy – the individual practises internal locus of control and prefers working alone. Plug, Meyer, Louw and Gouws (1986) describe the term “autonomy” as a condition of the independence and self-determination of an individual, and add that it also refers to something that is self-regulating and free from external control. Schepers (1995) standardised the LCI on first-year students whose home language was either predominantly Afrikaans or English.
A popular criticism is that psychometric instruments, which are based largely on middle-class White values and knowledge, are culturally biased and less valid for other population groups (Van Zyl & Visser, 1998). The testing of persons with highly dissimilar cultural backgrounds has received increasing attention and has lead to widespread debate and research over the past few years (Anastasi & Urbina, 1997; Gregory, 1996; Holburn, 1992). Cross-cultural studies (Buriel, 1981; Chiu, 1988; Dean, 1984; Heaven, Rajab & Bester, 1986; Kishor, 1983; Kureshi & Husain, 1981; Mirowsky & Ross, 1984; Padilla, Wagatsuma & Lindholm, 1985; Young & Shorr, 1986) suggest that the patterns of locus of control beliefs involve different patterns of salience across diverse cultures.
Research conducted by Gaa and Shores (1979) found that locus of control was not only dependent on culture, but also on specific components or domains of locus of control. According to them: “the findings substantiate the assumption that domain specific locus of control measures reflect distinct, but not consistent, differences in culturally divergent populations”. The notion that culture is just one aspect with regard to particular domains of locus of control is evident in the research done by Krampen and Weiberg (1981). They found differences in the internality and externality of American, Japanese, and German students.
The relationship between one’s culture and locus of control has certainly been well researched. Valid evidence is present on both sides of the debate, which continues to this day. Rieger and
P SCHA AP
MA BUYS
C OLCKERS
Department of Human Resources Management University of Pretoria
ABSTRACT
Popular criticism is that psychometric instruments, based largely on middle-class White values, knowledge and culture are biased and less valid for other population groups. It is therefore important that the testing of persons with highly dissimilar backgrounds receive greater attention. In this study the LCI of Schepers was applied to Black and White tertiary students to determine the construct validity of the instrument for different cultural groups. It was found that there is evidence of differences in the construct validity of the LCI for the Black (n=376) and White (n=374) groups. The item discrimination values, scale reliabilities and factor structures revealed that the three hypothesised constructs, namely external locus of control, internal locus of control and autonomy underlying the LCI, were confirmed for the White group but not for the Black group.
OPSOMMING
Die algemene kritiek teen psigometriese instrumente wat grootliks op Blanke waardes, kennis en kultuur gebaseer is, is dat die instrumente sydig en minder geldig vir ander populasiegroepe mag wees. Dit is dus belangrik dat sydigheids- en geldigheidsaspekte veral aandag geniet by die toetsing van persone uit verskillende kultuurgroepe. In hierdie studie is die LVB van Schepers op Swart en Blanke tersiêre studente toegepas om die konstrukgeldigheid van die instrument vir verskillende kultuurgroepe te bepaal. Die resultate dui daarop dat die konstrukgeldigheid van die LVB vir die Swart (n=376) en Blanke (n=374) groepe verskil. Die item-diskriminasiewaardes, skaalbetroubaarhede en faktorstrukture dui daarop dat die drie konstrukte waaruit die LVB bestaan, naamlik ‘n eksterne lokus van kontrole, ‘n interne lokus van kontrole en outonomie vir die Blanke groep bevestig is, maar nie vir die Swart groep nie.
THE CONSTRUCT VALIDITY OF SCHEPERS’ LOCUS OF CONTROL
INVENTORY FOR BLACK AND WHITE TERTIARY STUDENTS
Requests for copies should be addressed to: P Schaap, Department of Human Resource Management, University of Pretoria, Pretoria, 0002
Blignaut (1996) found a positive correlation between individualism and internal locus of control and autonomy. They found no correlation between collectivism and external locus of control. According to Otterman (1999) it is important to exercise caution and to be critical in our evaluation of research which links locus of control and culture. There is evidence suggesting that such links do exist, but it should not be inferred that one’s culture determines the degree of internality or externality. Otterman maintains that the answer to whether or not cultural factors influence one’s sense of control over one’s life may not be definite, but the implications of one’s degree of internality and externality are quite clear.
Anastasi (1990) argues that there are only “cult ural differences” between cultures or subcultures and that each culture reinforces the development of behaviour that is adapted to its values and demands. According to her cross-cultural testing is needed for maximum utilisation of human resources in the newly developing nations in Africa and elsewhere. She points out that the rapidly expanding educational facilities in these countries require testing for admission purposes as well as for individual counseling. This is of particular importance to increased industrialisation, where psychometric instruments serve as aids in job selection and personnel placement in the professional, mechanical and clerical fields of employment.
The Employment Equity Act of South Africa (1998) places all test developers and users under an obligation to consider the impact of psychometric assessments on different groups as carefully as they consider other technical psychometric issues. The importance of incorporation of this requirement into the design of psychometric instruments cannot be overemphasised. The fact that some tests may be biased against certain groups has become a matter of primary concern in South Africa (Schaap, 2001).
In simple statistical terms “bias in testing” means systematic errors of measurement. Bias is present when the meanings or implications of a test score obtained by one subgroup of test takers are different from the meanings or implications that this score has for other test takers (Gregory, 1996). Owen and Taljaard (1996) warned that when test users administer a test to a group for whom it has not been standardised, they should be aware that the language of the test can have a material effect on achievement in such test.
Areas of bias concern three main categories: content validity, construct validity and predictive validity (Owen et al., 1996). Van Zyl et al (1998) argue that a test that is systematically biased towards a subgroup, because of a source of variance in the test that functions differently for one subgroup than for another, implies that the test is not measuring what it intends to measure, and will therefore not facilitate appropriate inferences and decisions about each subgroup’s performance based on the results of the test. It will be (systematically) invalid for a certain subgroup or subgroups. According to Van Zyl et al. bias can therefore directly influence validity.
The focus of this article is on construct validity. According to Reynolds (1982) bias in the construct validity of a test exists when a test is shown to measure different hypothetical traits (psychological constructs) in one group than in another, or when it measures the same trait, but with different degrees of accuracy. Owen et al. (1996) maintain that construct bias means that the test measures something different in one group than in another group, while it assumes that the same construct is being measured. For a test to be unbiased, all the items comprising the test must measure the same trait or ability for all the subgroups.
The objective of this study is to determine the construct validity of the LCI for Black and White tertiary students.
METHOD
Sample
First and second year students enrolled in Economic and Management Sciences at the University of Pretoria and Technikon Pretoria participated in the study during the 2001 academic year. A convenience sample of 750 students completed the LCI during formal lecture time. The sample consisted of 434 university students and 316 technikon students. The study formed part of the course work and the students obtained feedback on the meaning of LCI scores and the relevance of the constructs to course content. Provision of personal data for research purposes was made on a voluntary basis. All data were dealt with in a confidential manner.
The biographical information on the sample is reported in Table 1. The sample consists of almost equal proportions of Whites (n=374) and Blacks (n=376). Approximately 49% of the respondents indicated an African language as first language. The sample included 34% Afrikaans-speaking and 14% English-speaking respondents. The sample also included 2,4% other European-language speaking respondents. Most of the respondents (75,7%) were 20 years or younger. The sample consisted of 72% females and 28% males.
TABLE1
BIOGRAPHICAL INFORMATION OF RESPONDENTS
Frequency Percent Valid Cumulative Percent Percent GROUPS
Black 376 50,1 50,1 50,1
White 374 49,9 49,9 100,0
Total 750 100,0 100,0
FIRST LANGUAGE
African 362 48,6 48,6 48,3
Afrikaans 253 33,7 34,0 82,3
English 104 14,0 14,0 96,3
European 18 2,4 2,4 98,8
Not listed 6 0,8 0,8 100,0
Unknown 6 0,8
Total 750 100,0
AGE GROUPS
Below 18 38 5,1 5,1 5,1
18 259 34,5 34,6 39,7
19 168 22,4 22,5 62,2
20 101 13,5 13,5 75,7
Above 20 182 24,2 24,4 97,7
Unknown 2 0,3
Total 750 100,0
GENDER
Male 201 26,8 27,7 27,1
Female 524 69,9 72,3 97,6
Unknown 25 2,3
Total 750 100,0
Measuring instrument
Statistical analysis
Descriptive statistics in respect of the LCI scale scores were calculated for Whites and Blacks separately. T-tests were done, and effect-sizes as described by Cohen (1988), were calculated to determine the significance of the differences in respect of the means of the groups. The significance values of t-tests are sample sensitive and do not provide a good indication of the practical significance of mean score differences. Effect-size (d) provides a better indication of the practical significance of the difference in mean scores (Cohen). Cohen recommends the following guidelines to indicate the practical significance of d:
small effect: d=0,25; medium effect: d=0,50; and large effect: d= 0,80.
For the purpose of this study an effect-size (d) of 0,50 was regarded as having practical significance.
The comparability of the LCI scales for Whites and Blacks was evaluated by computing coefficients of internal consistency (alpha), and by conducting item and factor analyses. The SPSS (Statistical Package for the Social Sciences) program was used to do the required analyses.
The Principal Axis Factoring (PAF) extraction method and direct oblique rotation were used to determine the hypothetical factor solutions for the LCI (Tabachnick & Fidell, 1989). In accordance with the rational construct approach, the defined theoretical constructs was used to determine the number of factors for rotation purposes (Owen, 1995). De Vellis (1991) clearly states that conventional factor analytical methods that are also used for exploratory factor analysis can be applied with success in confirming hypotheses with regard to theoretical constructs. The distinction between creating and testing hypotheses in factor analysis is not definite (Child, 1990). The criteria that was used in the present study to confirm the significance of the factors and the comparability of the factors between groups are as follows:
the extent to which factor groupings that have been anticipated are confirmed in the factor analysis for the groups being compared;
the number of significant factors and the proportion of variance explained are similar for both groups;
the factor solutions are clear or well-defined and similarly interpreted for both groups; and
the factor loadings are similar for the groups being compared (De Villis, 1991).
Kaiser’s criterion (1961), the parallel method of Horn (1965) and the scree-plot (Cattell 1965) were used to verif y the number of significant factors. Horn’s (1965) method entails contrasting the eigenvalues of a correlation matrix of random uncorrelated variables with those of the data set in question, based on the same sample size and number of variables. Factors of the matrix of interest, which have eigenvalues greater than those of the comparison random matrix, would be retained. According to Zwick and Velicer (1986), Horn’s method provides the most accurate estimation of the number of true factors in a complex data set. Tucker’s (1951) congruence coefficient was used to calculate the level of congruence of the rotated factor solutions for the two groups, indicating the level of factor stability across groups.
Confirmatory structural modeling was conducted as an additional measure to test the extent to which the data fit the proposed LCI model. Maximum likelihood estimation was used via the Statistica-SEPATH (Steiger, 1995) structural equation software. The Bentler-Bonnett normed fit index (NFI) and non-normed fit index (NNFI), the Comparative Fit Index (CFI), the James-Mulaik-Brett Parsimony fit index (PFI), the root mean squared error of approximation (RMSEA), the standardised root mean squared residual (RMR) and the model chi-square were used as model fit indices. The probability of obtaining a non-significant chi-square becomes extremely small with large sample sizes. The ratio of chi-square to degrees of freedom has been proposed, although it appears to suffer from somewhat arbitrary standards of interpretation (Kelloway, 1998; Medskar, Williams & Holahan, 1994).
Item aggregate values (item parcels) were calculated to control for artifacts in item groupings or factors that have no psychological importance due to the effect of differential item skewness (Comrey & Lee, 1992; Gorsuch 1997). Bogozzi and Heatherton (1994) maintain that the indices obtained from a Confirmatory Factor Analysis could be an underestimate of the model fit values. This could happen when factors contain a large number of items. Bagozzi and Heatherton (1994) propose the calculation of item aggregates to obtain more accurate estimates of model fit indices. Item aggregates were built according to rational and theoretical criteria. The assumption was made that each item is an alternative but equivalent indicator of the construct to which it has been allocated. The LCI was divided into 23 aggregates of which 16 consisted of four items each and seven consisted of three items each. Table 2 indicates how the items were allocated to form aggregates.
TABLE2
ITEM AGGREGATES FOR THELCI
Autonomy Internal locus of control External locus of control
(34 Items) (26 items) (28 items)
Aut1 1* 2 3 5 Int1 6 7 8 10 Ext1 4 9 12 20
Aut2 11* 13 14 15 Int2 18 19 26 27 Ext2 34 35 36 38
Aut3 16 17 21* 22 Int3 31 32 33 37 Ext3 41 43 45 47
Aut4 23 24 25 28 Int4 40 42 48 49 Ext4 50 51 52 53
Aut5 29 30 39* 44 Int5 54 55 59 60 Ext5 56 57 58 65
Aut6 46 62 64 66 Int6 61 63 69 75 Ext6 72 77 79
Aut7 67 68 70 71* Int7 76 85 86 87 Ext7 80 84 88
Aut8 73* 74 78
Aut9 81 82 83
RESULTS
Descriptive statistics of the LCI scales for the White and Black groups are supplied in Table 3. The standard deviation statistics indicate that the White group obtained more homogeneous scores on the Internal Locus of Control scale than the Black group.
It is clear from Table 3 that statistically significant (t-tests) differences in mean values for the LCI scales for the groups do exist. Both the Autonomy and External Locus of Control scales reflect small effect-sizes and the Internal Locus of Control scale reflects a medium effect-size. The differences between the groups in respect of both the Autonomy and the External Locus of Control scale are of small practical significance. It should be recognized that the differences between the Black and White groups on the Internal Locus of Control scale could be of practical significance when cross-cultural comparisons are made.
The results of the item analysis of Autonomy for the different groups are provided in Table 4. There are 12 items (i.e. 35% of the items) that have an item-total correlation (discrimination value) lower than 0,20 for the Black group. A discrimination value of below 0,20 is generally considered not acceptable (Anastasi, 1990, De Vellis, 1991, Anastasi). The items with the low item-total correlations also have relatively low item-reliabilities. With reference to the White group, all the items appear to have acceptable discrimination values and item reliabilities. The alpha coefficients for the Black and White groups are 0,79 and 0,88 respectively. This can be viewed as a recognisable difference in reliabilities when the length of the scale and the equal standard deviations of the scale scores for the groups are considered. The results of the item and reliability analyses for the Autonomy scale imply differences in the construct for Black and White groups.
The item-analysis results for the Internal Locus of Control scale appear in Table 5. All the item-total correlations are above 0.20 for both the Black and White groups. The alpha coefficients for the Black and White groups are 0,85 and 0,88 respectively. The difference in reliability for the Black and White groups can be regarded as small. The results of the item and reliability analysis suggest that the construct is comparable in respect of the Black and White groups.
TABLE4
ITEM ANALYSIS OF THELCI AUTONOMY SCALE FOR BLACK AND WHITE GROUPS
Black group (n=376) White group (n=374)
Item- Item- Alpha Item- Item- Alpha
Total reliability if Item Total reliability if Item
Correlation Deleted Correlation Deleted
ITEM 1 0,171* 0,301 0,768 0,413 0,564 0,873 ITEM 2 0,197* 0,267 0,766 0,222 0,334 0,877 ITEM 3 0,267 0,472 0,763 0,399 0,523 0,873
ITEM 5 0,366 0,480 0,760 0,393 0,417 0,874
ITEM 11 0,294 0,578 0,762 0,378 0,538 0,874
ITEM 13 0,271 0,344 0,764 0,542 0,551 0,871
ITEM 14 0,311 0,550 0,761 0,435 0,561 0,872
ITEM 15 0,120* 0,240 0,771 0,393 0,586 0,873 ITEM 16 0,026* 0,060 0,779 0,294 0,506 0,876 ITEM 17 0,168* 0,306 0,768 0,331 0,450 0,875 ITEM 21 0,083* 0,144 0,772 0,285 0,386 0,876 ITEM 22 0,312 0,444 0,762 0,453 0,539 0,872
ITEM 23 0,246 0,431 0,764 0,280 0,391 0,876
ITEM 24 0,326 0,602 0,760 0,489 0,635 0,871
ITEM 25 0,144* 0,243 0,769 0,325 0,416 0,875 ITEM 28 0,244 0,453 0,765 0,326 0,461 0,875
ITEM 29 0,226 0,372 0,765 0,351 0,448 0,874
ITEM 30 0,394 0,694 0,757 0,450 0,692 0,872
ITEM 39 0,071* 0,134 0,773 0,302 0,442 0,876 ITEM 44 0,343 0,549 0,760 0,506 0,552 0,872
ITEM 46 0,390 0,635 0,758 0,521 0,674 0,871 ITEM 62 0,347 0,547 0,760 0,192 0,275 0,878
ITEM 64 0,108* 0,190 0,771 0,311 0,367 0,875 ITEM 66 0,399 0,582 0,758 0,501 0,524 0,872
ITEM 67 0,465 0,679 0,756 0,462 0,467 0,872
ITEM 68 0,482 0,774 0,754 0,497 0,589 0,871
ITEM 70 0,346 0,590 0,760 0,550 0,785 0,870
ITEM 71 0,186* 0,356 0,768 0,300 0,447 0,876 ITEM 73 0,182* 0,335 0,768 0,390 0,547 0,873 ITEM 74 0,386 0,634 0,758 0,493 0,585 0,872
ITEM 78 0,118* 0,233 0,771 0,225 0,276 0,877 ITEM 81 0,407 0,609 0,758 0,482 0,623 0,872
ITEM 82 0,418 0,625 0,757 0,616 0,769 0,869
ITEM 83 0,485 0,775 0,754 0,433 0,505 0,873
Scale reliability: Black group: 0,79 White group: 0,88 *Item discrimination values < 0,20
TABLE3
DESCRIPTIVE STATISTICS IN RESPECT OF THELCI SCALES
Black group (n=376) White group (n=374) Difference in means
Mean Mean T-value
SD SD Effect size
Autonomy Autonomy
166,712 170,473 -2,559**
20,162 20,086 0,190
Internal Internal
153,662 162,914 -6,918**
20,960 15,232 0,510
External External
96,638 90,652 4,140**
18,796 20,750 0,300
TABLE5
ITEM ANALYSIS OF THELCI INTERNAL LOCUS OF CONTROL SCALE FOR BLACK AND WHITE GROUPS
Black group (n=376) White group (n=374)
Item- Item- Alpha Item- Item- Alpha
Total reliability if Item Total reliability if Item
Correlation Deleted Correlation Deleted
ITEM 6 0,463 0,743 0,838 0,459 0,512 0,867
ITEM 7 0,389 0,599 0,840 0,398 0,380 0,869
ITEM 8 0,354 0,592 0,841 0,391 0,473 0,869
ITEM 10 0,468 0,656 0,838 0,451 0,374 0,868
ITEM 18 0,294 0,424 0,843 0,456 0,448 0,868
ITEM 19 0,398 0,471 0,840 0,512 0,470 0,867 ITEM 26 0,214 0,357 0,846 0,298 0,375 0,872
ITEM 27 0,445 0,665 0,838 0,368 0,402 0,870
ITEM 31 0,392 0,491 0,840 0,444 0,463 0,868
ITEM 32 0,222 0,439 0,847 0,426 0,494 0,868
ITEM 33 0,364 0,582 0,841 0,437 0,484 0,868
ITEM 37 0,429 0,643 0,839 0,402 0,449 0,869 ITEM 40 0,303 0,577 0,843 0,469 0,590 0,867
ITEM 42 0,399 0,617 0,840 0,391 0,450 0,869
ITEM 48 0,289 0,555 0,844 0,321 0,393 0,871
ITEM 49 0,455 0,569 0,839 0,533 0,443 0,867
ITEM 54 0,303 0,566 0,843 0,358 0,463 0,870
ITEM 55 0,446 0,717 0,838 0,473 0,495 0,867
ITEM 59 0,374 0,672 0,841 0,485 0,554 0,867 ITEM 60 0,407 0,639 0,840 0,449 0,450 0,868
ITEM 61 0,326 0,587 0,842 0,408 0,496 0,869
ITEM 63 0,476 0,633 0,838 0,496 0,485 0,867
ITEM 69 0,356 0,490 0,841 0,401 0,465 0,869
ITEM 75 0,395 0,591 0,840 0,603 0,619 0,864
ITEM 76 0,399 0,802 0,840 0,320 0,434 0,872
ITEM 85 0,430 0,748 0,839 0,317 0,430 0,872 ITEM 86 0,412 0,622 0,839 0,329 0,450 0,871
ITEM 87 0,424 0,657 0,839 0,453 0,518 0,867
Scale reliability: Black group: 0,85 White group: 0,88
The results of the item analysis of the External Locus of Control scale for the different groups are provided in Table 6. There are three items (i.e. 12% of the items) with an item-total correlation value of below 0,20 and relatively low item reliabilities for the Black group. All the item-total correlations are acceptable for the White group. The alpha coefficients for the Black and White groups are 0,77 and 0,88 respectively. This can be viewed as a recognisable difference in reliabilities, when considering the length of the scale and the equal standard deviations of the scale scores for the groups. The item and reliability analyses reveal differences in the construct that is measured in respect of the Black and White groups.
The results of the factor analysis performed on the LCI indicate differences in the factor structures for Black and White groups. The sample sizes for both the Black and White groups were adequate according to the Kaiser-Meyer-Olkin measure of sampling adequacy (MSA) (Kim and Mueller, 1978). The MSA-values were 0,87 and 0,90 respectively for the Black and White groups. These values can be considered highly acceptable. The postulated theoretical model of Schepers (1999) was used to determine the number of factors to be rotated. A Direct Oblimin rotation method was used as the LCI factors can be considered related (Schepers, 1995). The quality of the factor solutions were evaluated using the level of interpretability and the simplicity of the structure obtained (DeVillis, 1991; Tinsley & Tinsley, 1991; Tabachnick & Fidell, 1989). Factor loadings of 0,30 and higher were considered acceptable (Tabachnick & Fidell, 1989). Small deviations from the 0,30 criteria were allowed to account for possible differences in sample homogeneity.
TABLE6
ITEM ANALYSIS OF THELCI EXTERNAL LOCUS OF CONTROL SCALE FOR BLACK AND WHITE GROUPS
Black group (n=376) White group (n=374)
Item- Item- Alpha Item- Item- Alpha
Total reliability if Item Total reliability if Item
Correlation Deleted Correlation Deleted
ITEM 4 0,216 0,427 0,767 0,298 0,501 0,881
ITEM 9 0,127* 0,244 0,772 0,303 0,388 0,880 ITEM 12 0,218 0,374 0,766 0,509 0,857 0,875
ITEM 20 0,185* 0,362 0,769 0,354 0,532 0,879 ITEM 34 0,178* 0,347 0,769 0,404 0,704 0,878 ITEM 35 0,306 0,615 0,762 0,468 0,886 0,876 ITEM 36 0,372 0,642 0,759 0,476 0,806 0,876
ITEM 38 0,327 0,593 0,761 0,549 0,916 0,874
ITEM 41 0,299 0,558 0,762 0,492 0,749 0,876
ITEM 43 0,313 0,644 0,761 0,399 0,707 0,878
ITEM 45 0,433 0,908 0,754 0,551 0,761 0,875
ITEM 47 0,270 0,565 0,764 0,326 0,508 0,880 ITEM 50 0,318 0,544 0,761 0,474 0,685 0,876
ITEM 51 0,247 0,410 0,765 0,531 0,764 0,875
ITEM 52 0,278 0,610 0,764 0,318 0,519 0,880
ITEM 53 0,442 0,881 0,754 0,419 0,677 0,878
ITEM 56 0,397 0,749 0,757 0,462 0,747 0,876
ITEM 57 0,227 0,486 0,767 0,521 0,815 0,875
ITEM 58 0,323 0,662 0,761 0,417 0,710 0,878 ITEM 65 0,287 0,477 0,763 0,306 0,512 0,881
ITEM 72 0,335 0,603 0,760 0,450 0,684 0,877
ITEM 77 0,253 0,549 0,765 0,391 0,621 0,878
ITEM 79 0,311 0,551 0,762 0,564 0,957 0,874
ITEM 80 0,389 0,743 0,757 0,613 0,955 0,873
ITEM 84 0,320 0,619 0,761 0,565 0,862 0,874
ITEM 88 0,335 0,605 0,760 0,365 0,530 0,879
Scale reliability: Black group: 0,77 White group: 0,88 *Item discrimination values < 0,20
Figure 1: Scree-plot (Black group)
TABLE7
FACTOR EIGENVALUES AND VARIANCE EXPLAINED FOR BLACK AND WHITE GROUPS
Black group (N=376) White group (N=374)
Initial Eigenvalues Initial Eigenvalues
Factor Total % Variance Cumulative % Factor Total % Variance Cumulative %
1 5,297 23,032 23,032 1 6,844 29,758 29,758 2 2,714 11,799 34,831 2 3,362 14,618 44,376 3 1,151 5,004 39,836 3 1,775 7,715 52,091 4 1,115 4,848 44,684 4 0,946 4,114 56,205 5 1,031 4,484 49,168 5 0.886 3.851 60.056 6 1,002 4,355 53,523 6 0.827 3.594 63.650 7 0,898 3,904 57,427 7 0.755 3.281 66.930 8 0.875 3.802 61.229 8 0.708 3.077 70.008 9 0.802 3.488 64.717 9 0.660 2.871 72.879 10 0.774 3.367 68.084 10 0.627 2.728 75.607 11 0.757 3.289 71.374 1 0.595 2.586 78.192 12 0.722 3.141 74.514 2 0.572 2.485 80.678 13 0.688 2.993 77.508 3 0.557 2.420 83.097 14 0.672 2.923 80.431 14 0.504 2.191 85.288 15 0.644 2.802 83.233 5 0.495 2.152 87.440 16 0.599 2.603 85.836 16 0.439 1.909 89.349 17 0.547 2.376 88.213 17 0.428 1.859 91.208 18 0.515 2.241 90.453 18 0.415 1.805 93.014 19 0.494 2.148 92.602 19 0.371 1.614 94.628 20 0.456 1.984 94.586 20 0.354 1.538 96.166 21 0.439 1.907 96.493 21 0.326 1.417 97.583 22 0.417 1.813 98.306 22 0.296 1.289 98.872 23 0.390 1.694 100.000 23 0.259 1.128 100.000
Figure 2 and Table 8 provide the results of the factor analysis of the White group. Kaiser’s (1961) criterion, Horn’s (1956) criteria and the scree-test indicate three significant factors for the White group. A clear break can be observed between roots three and four indicating three significant factors according to the scree-test. Kaiser’s eigenvalue criterion indicates three distinct factors. The curve of the random data set intersects the curve of the true data set between the third and fourth root, indicating a three-factor solution. The three three-factors explain up to 52% of the total variance of the data set (Table 7). A clear, well defined, interpretable and simple factor structure can be seen in Table 8 in respect of the White group.
Figure 2: Scree-plot (White group)
TABLE8
ROTATED PATTERN MATRIX FOR BLACK AND WHITE GROUPS
Pattern Matrix (Black group) (n=376) Pattern Matrix (White group) (n=374)
Factor Factor
Aggregates 1 2 3 Aggregates 1 2 3
AUT1 0,303 -0,030 0,296 AUT1 0,758 0,145 -0,098 AUT2 0,474 -0,199 0,122 AUT2 0,645 -0,091 -0,066 AUT3 0,230 0,018 0,064 AUT3 0,430 -0,121 0,126 AUT4 0,427 0,050 -0,010 AUT4 0,591 0,098 0,071 AUT5 0,235 -0,066 0,235 AUT5 0,606 -0,214 0,003 AUT6 0,352 0,149 0,465 AUT6 0,441 -0,012 0,311 AUT7 0,439 -0,140 0,293 AUT7 0,658 -0,113 0,072 AUT8 0,437 -0,131 0,048 AUT8 0,479 -0,142 0,092 AUT9 0,467 -0,024 0,242 AUT9 0,633 0,001 0,091 INT1 0,720 -0,130 -0,083 INT1 -0,004 -0,092 0,627 INT2 0,557 0,117 0,016 INT2 0,071 0,166 0,546 INT3 0,688 0,060 -0,110 INT3 0,053 0,097 0,674 INT4 0,554 0,077 0,020 INT4 -0,069 0,083 0,754 INT5 0,666 -0,008 -0,135 INT5 0,048 -0,107 0,651 INT6 0,617 -0,038 0,036 INT6 0,060 -0,164 0,673 INT7 0,555 0,053 0,007 INT7 0,028 -0,044 0,576 EXT1 0,176 0,380 -0,229 EXT1 -0,005 0,677 0,116 EXT2 0,054 0,509 -0,030 EXT2 0,090 0,663 -0,126 EXT3 -0,111 0,587 0,000 EXT3 -0,142 0,669 -0,011 EXT4 -0,157 0,582 0,181 EXT4 0,036 0,633 -0,089 EXT5 0,115 0,554 0,098 EXT5 -0,014 0,649 0,034 EXT6 -0,037 0,471 -0,037 EXT6 -0,047 0,740 0,050 EXT7 0,010 0,511 -0,051 EXT7 -0,141 0,669 0,044
Factor Correlation Matrix Factor Correlation Matrix
Factor 1 2 3 Factor 1 2 3
1 1,000 1 1,000
2 -0,356 1,000 2 -0,032 1,000 3 -0,491 0,125 1,000 3 -0,351 0,166 1,000
as the External Locus of Control factor in respect of the Black group. Factor 3 contains certain elements of the Autonomy scale, but is poorly defined for the Black group, and can be considered an artifact. Factor 1 is clearly defined as an Autonomy factor for the White group. The External Locus of Control factor is clearly visible as Factor 2 for the White group. The Internal Locus of Control factor is clearly visible as Factor 3 for the White group. The coefficient of congruence of the Internal Locus of Control factor in respect of the two groups is 0,85 and indicates factor similarity and stability (Tucker, 1951). The coefficient of congruence of the External Locus of Control factor in respect of the two groups is 0,96. Thus the External Locus of Control factor can be considered highly stable for the t wo groups. The coefficient of congruence of the Autonomy factor in respect of the two groups is 0,71 and is considered not adequate. It is clear from the results that the Autonomy scale is not congruent for the two groups in the study. The factor correlation matrices of the rotated factors also clearly differs for the two groups, which signifies limited comparability of the rotated factor structures for the two groups.
TABLE9
ROTATED PATTERN MATRIX OF THE TWO-FACTOR MODEL FOR THE BLACK GROUP
Factor
Aggregates 1 2
AUT1 0.438 -0.064 AUT2 0.532 -0.195 AUT3 0.259 0.019
AUT4 0.419 0.073
AUT5 0.344 -0.093
AUT6 0.551 0.080
AUT7 0.573 -0.164 AUT8 0.459 -0.117 AUT9 0.578 -0.041 INT1 0.674 -0.079
INT2 0.561 0.142
INT3 0.626 0.111
INT4 0.559 0.101
INT5 0.592 0.047
INT6 0.632 -0.013 INT7 0.555 0.080 EXT1 0.061 0.418 EXT2 0.034 0.519 EXT3 -0.117 0.582 EXT4 -0.077 0.530 EXT5 0.154 0.541 EXT6 -0.059 0.477 EXT7 -0.020 0.522
Factor Correlation Matrix
Factor 1 2
1 1,000
2 -0,064 1,000
The intercorrelation matrix in Table 11 shows clear differences in the interrelationships between the LCI scales for the two groups. The significance of the differences in the correlation coefficients for the two groups was determined by calculating z-values (Kanji, 1993). The correlation between the Autonomy scale and the Internal Locus of Control scale is significantly higher (z=3,68; p£ 0,05) for the Black group than for the White group. The Autonomy scale appears not to be similar for the two groups in terms of its relationship with the Internal Locus of Control scale. The External Locus of Control scale s correlation with the
Autonomy scale differs significantly (z=4,3; p£0,05) between the groups. The correlation between the Internal and External Locus of Control scales differ significantly (z=2.6; p£ 0.05) for the groups. The correlation coefficients between the Internal and External Locus of Control scales are small for both groups, which verifies Schepers (1995) conclusion that the Internal and External loci of control can be seen as separate constructs and not bi-polar opposites.
TABLE10
ITEM ANALYSIS OF THE COMBINEDLCI INTERNAL LOCUS OF CONTROL AND OUTONOMY SCALE FOR THE BLACK GROUP
Black group (n=376)
Item- Item- Alpha Item- Item- Alpha Total reliability if Item Total reliability if Item Correlation Deleted Correlation Deleted
ITEM 1* 0.124 0.215 0.878 ITEM 40 0.301 0.541 0.876 ITEM 2* 0.198 0.277 0.877 ITEM 42 0.349 0.498 0.875 ITEM 3* 0.340 0.589 0.875 ITEM 44* 0.343 0.529 0.875 ITEM 5* 0.359 0.462 0.875 ITEM 46* 0.419 0.696 0.874 ITEM 6 0.514 0.797 0.873 ITEM 48 0.262 0.483 0.876 ITEM 7 0.387 0.528 0.875 ITEM 49 0.449 0.525 0.874 ITEM 8 0.330 0.528 0.875 ITEM 54 0.273 0.506 0.876 ITEM 10 0.383 0.480 0.875 ITEM 55 0.483 0.753 0.873 ITEM 11* 0.305 0.582 0.876 ITEM 59 0.336 0.593 0.875 ITEM 13* 0.331 0.415 0.875 ITEM 60 0.350 0.545 0.875 ITEM 14* 0.385 0.680 0.875 ITEM 61 0.285 0.521 0.876 ITEM 15* 0.153 0.304 0.878 ITEM 62* 0.408 0.655 0.874 ITEM 16* 0.054 0.120 0.880 ITEM 63 0.380 0.466 0.875 ITEM 17* 0.159 0.281 0.878 ITEM 64* 0.081 0.142 0.879 ITEM 18 0.186 0.257 0.877 ITEM 66* 0.469 0.684 0.874 ITEM 19 0.355 0.419 0.875 ITEM 67* 0.519 0.755 0.873 ITEM 21* -0.017 -0.029 0.880 ITEM 68* 0.498 0.790 0.873 ITEM 22* 0.404 0.599 0.874 ITEM 69 0.351 0.466 0.875 ITEM 23* 0.192 0.334 0.877 ITEM 70* 0.423 0.702 0.874 ITEM 24* 0.328 0.611 0.875 ITEM 71* 0.091 0.175 0.879 ITEM 25* 0.190 0.330 0.877 ITEM 73* 0.183 0.330 0.877 ITEM 26 0.124 0.199 0.878 ITEM 74* 0.412 0.662 0.874 ITEM 27 0.507 0.754 0.873 ITEM 75 0.391 0.581 0.875 ITEM 28* 0.235 0.428 0.877 ITEM 76 0.343 0.672 0.875 ITEM 29* 0.191 0.312 0.877 ITEM 78* 0.225 0.441 0.877 ITEM 30* 0.352 0.606 0.875 ITEM 81* 0.420 0.642 0.874 ITEM 31 0.316 0.366 0.876 ITEM 82* 0.408 0.588 0.874 ITEM 32 0.193 0.382 0.877 ITEM 83* 0.521 0.846 0.873 ITEM 33 0.404 0.604 0.874 ITEM 85 0.417 0.712 0.874 ITEM 37 0.512 0.741 0.873 ITEM 86 0.302 0.446 0.876 ITEM 39* -0.025 -0.049 0.881 ITEM 87 0.344 0.503 0.875
Scale reliability: 0,877
Note: * = Autonomy Scale Items
TABLE11
INTERCORRELATIONS OF SCALES IN RESPECT OF BLACK AND WHITE GROUPS
Autonomy Internal External
Autonomy 1,000 0,682 -0,093
Internal 0,510 1,000 0,039
External -0,388 -0,152 1,000
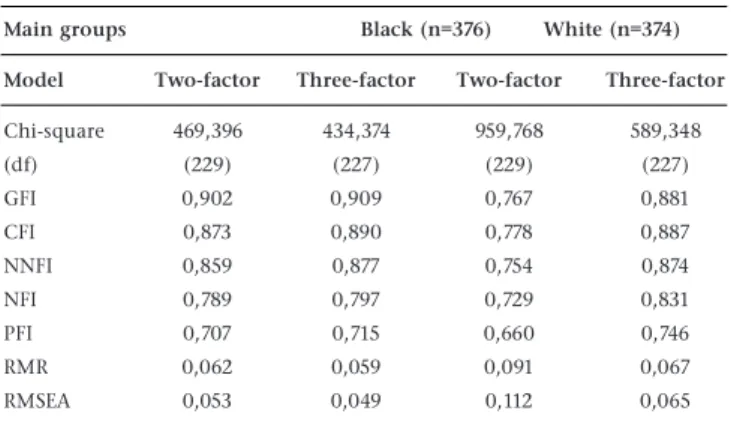
The structural equation models for the three hypothesised domains underlying the LCI for the Black group is given in Figure 3 and 4 respectively. The latent variables have been allowed to correlate with one another. The confirmatory factor analysis fit indices are supplied in Table 12. As indicated in Table 12, the GFI value is 0,909 and the NFI and NNFI values are 0,797 and 0,877 respectively. The CFI value is 0,890 and the PFI value is 0,715. The values of all these indices range between 0 and 1. A value of 0,90 is generally considered a good fit for all of the fit indices (Bentler, 1990; Bentler & Bonnett, 1980; Steiger, 1995) mentioned above.
TABLE12
FIT INDICES FOR THE BLACK AND WHITE GROUPS
Main groups Black (n=376) White (n=374)
Model Two-factor Three-factor Two-factor Three-factor
Chi-square 469,396 434,374 959,768 589,348 (df) (229) (227) (229) (227) GFI 0,902 0,909 0,767 0,881 CFI 0,873 0,890 0,778 0,887 NNFI 0,859 0,877 0,754 0,874 NFI 0,789 0,797 0,729 0,831 PFI 0,707 0,715 0,660 0,746 RMR 0,062 0,059 0,091 0,067 RMSEA 0,053 0,049 0,112 0,065
The standardised RMR has a value of 0,059 and the RMSEA value is 0,049. RMR-values of less than 0,05 are considered indicative of a good fit to the data (Kelloway, 1998). Hair, Anderson, Tatham and Black (1995) consider RMSEA-values between 0,05 and 0,08 as indicative of an acceptable fit. Steiger (1995) considers RMSEA-values of less than 0,10 as acceptable.
The chi-square was 434.374 with 227 df (p£0.01). This chi-square measure is highly significant and indicates a poor fit. However, given the large sample size, it would be incorrect to conclude a poor fit based on the significance of the chi-square index. The chi-square/df ratio is 1,91. Ratios between 2 and 5 have been interpreted as indicating a good fit (Kelloway, 1998).
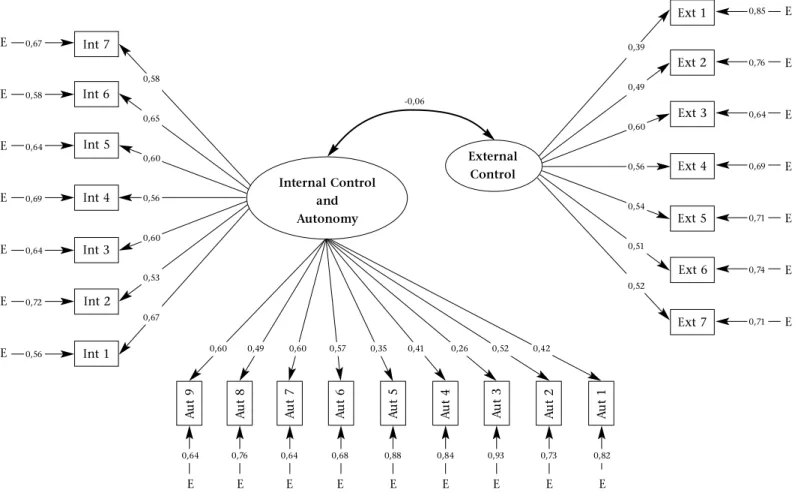
Although certain of the fit indices are marginally to recognisably lower than the accepted value for a good model fit, it can still be concluded that the three-factor model fits the data reasonably well. A matter of concern is the high correlation of 0,88 (Figure 3) between the Autonomy and the Internal Locus of Control latent variables. Gorsuch (1996) indicates that confirmatory factor analysis could fail to provide clear results when correlations between latent factors are too high. The high correlation between the Autonomy and the Internal Locus of Control latent variables suggests that Autonomy and Internal Locus of Control constructs cannot be distinguished as separate constructs for the Black group. It can thus be concluded that the items that were constructed for the Autonomy and Internal Locus of Control scale overlap to the extent that the scales cannot be considered factorially pure for the Black group. To test this conclusion, the aggregates for the Autonomy and Internal Locus of Control Scales were grouped together as one of the factors in a two-factor model hypothesis as illustrated in Figure 4. According to Table 12, the GFI value is 0,902; the NNFI value is 0,859; the NFI value is 0,781; the CFI is 0,873; and the PFI is 0,707. The standardised RMR value is 0,062 and the RMSEA value is 0,053. The chi-square is 469,396 with 229 df (p£0,01). The chi-square/df ratio is 2,05.
Although certain of the fit indices are lower than the accepted value for a good model fit, it can be concluded that the two-factor model fits the data reasonably well. It can further be concluded that the fit indices for the two-factor model are very similar to the fit indices of the three-factor model for the Black
Internal Control
External Control
0,01
-0,15 0,88
E
E
E
E
E
E
E
E
E
E
E
E
E
E 0,59
0,66
0,62
0,58
0,62
0,55
0,68
0,41
0,49
0,61
0,55
0,54
0,51
0,53 Int 7
Int 6
Int 5
Int 4
Int 3
Int 2
Int 1
A
ut
8
A
ut
9
A
ut
7
A
ut
6
A
ut
5
A
ut
4
A
ut
3
A
ut
2
A
ut
1
Ext 1
Ext 2
Ext 3
Ext 4
Ext 5
Ext 6
Ext 7
Autonomy
0,61 0,75 0,59 0,65 0,55 0,84 0,93
E E E E E E E
0,71
E
0,79 0,63 0,50 0,64 0,59 0,38 0,41 0,26 0,53 0,46
E 0,65
0,57
0,62
0,66
0,62
0,70
0,54
0,83
0,76
0,63
0,70
0,71
0,74
0,72
Internal Control and Autonomy External Control -0,06 E E E E E E E E E E E E E E 0,58 0,65 0,60 0,56 0,60 0,53 0,67 0,39 0,49 0,60 0,56 0,54 0,51 0,52 Int 7 Int 6 Int 5 Int 4 Int 3 Int 2 Int 1 A ut 8 A ut 9 A ut 7 A ut 6 A ut 5 A ut 4 A ut 3 A ut 2 A ut 1 Ext 1 Ext 2 Ext 3 Ext 4 Ext 5 Ext 6 Ext 7
0,64 0,76 0,64 0,68 0,88 0,84 0,93
E E E E E E E
0,73
E
0,82 0,60 0,49 0,60 0,57 0,35 0,41 0,26 0,52 0,42
E 0,67 0,58 0,64 0,69 0,64 0,72 0,56 0,85 0,76 0,64 0,69 0,71 0,74 0,71
Figure 4: Standardised parameters for the two-factor LCI model in respect of the Black group
Internal Control External Control -0,19 -0,48 0,60 E E E E E E E E E E E E E E 0,60 0,73 0,69 0,68 0,69 0,55 0,65 0,64 0,64 0,73 0,63 0,65 0,75 0,73 Int 7 Int 6 Int 5 Int 4 Int 3 Int 2 Int 1 A ut 8 A ut 9 A ut 7 A ut 6 A ut 5 A ut 4 A ut 3 A ut 2 A ut 1 Ext 1 Ext 2 Ext 3 Ext 4 Ext 5 Ext 6 Ext 7 Autonomy
0,52 0,64 0,44 0,60 0,53 0,68 0,69
E E E E E E E
0,61
E
0,65 0,69 0,60 0,75 0,63 0,69 0,57 0,56 0,63 0,60
E 0,64 0,46 0,52 0,54 0,53 0,69 0,58 0,59 0,59 0,47 0,61 0,58 0,43 0,47
group. There thus appears to be very little distinction between the items of the Autonomy and Internal Locus of Control scales for Blacks. They seem to define a single latent construct for the Black group.
Both the two-factor model and the three-factor model of the LCI were tested for the White group. Figure 5 represents the path diagram and fitted coefficients for the three-factor model. The GFI-value in Table 12 is 0,881; the NFI-value is 0,831; the NNFI-value is 0,874; the CFI- NNFI-value is 0,887; and the PFI-NNFI-value is 0,746. The standardised RMS-value is 0,067 and the RMSAE-value is 0,065. The chi-square is 589,348 with 227df (p£0.01). The chi-square/df ratio is 2,64. Although, most indices are lower than the accepted value, the GFI, NNFI, CFI, RMSAE and chi-square/ df ratio indices indicate a model fit for the data that comes close to what can be considered acceptable. Figure 6 represents the path diagram and fitted coefficients for a two-factor model. The GFI-value in Table 12 is 0,767; the NFI-value is 0,729; the NNFI-value is 0,754; the CFI- NNFI-value is 0,778; and the PFI-NNFI-value is 0,660. The standardised RMS-value is 0,091 and the RMSAE-value is 0,112. The chi-square is 959,768 with 229 df (p£0.01). The chi-square/df ratio is 4,19. These results indicate an unacceptable fit for the data.
It is clear that the three-factor model fits the data considerably better than the two-factor model. These results suggest that the three-factor model is purer and has less error variance than the two-factor model for the White group. There appears to be a clearer distinction between the Autonomy and Internal Locus of Control latent variables for the White group.
DISCUSSION
There is clear evidence of differences in the construct validity of the LCI for the Black and White groups included in this study. The LCI that has been developed and standardised using a
predominantly White sample group appears to be less valid for Black groups. The differences in mean values on the Autonomy and External Locus of Control scale are of little practical significance for the groups included in the study. The Internal Locus of Control scale could be of practical significance when cross-cultural comparisons are made and should be used with caution in such instances.
Although the LCI scales appear to have adequate reliability for both groups, there is cause for concern with respect to the extent to which the scales can be equally interpreted for the groups in question. The main area of concern is the Autonomy scale, which is not equally valid for the Black and the White groups. The item analysis, reliability analysis and factor structures in respect of the groups indicate clear differences in the response patterns of the groups. Interscale correlation analyses, factor analyses and confirmatory factor analyses indicate that the Black respondents do not draw a clear distinction between the Autonomy and Internal Locus of Control constructs. The White group draws a clearer distinction between these constructs. The LCI appears to be factorially purer for the White group than the Black group.
Although the factor External Locus of Control can be regarded as congruent for the groups included in the study, the reliability of the scale differs significantly for these groups. Comparisons between White and Black groups regarding the External Locus of Control should thus be made with caution due to the differences in scale accuracy. The construct validity of the Internal Locus of Control scale appears not to differ substantially between the Black and White groups.
It is clear from the results of this study that the LCI contains elements of bias in terms of construct validity for the White and Black sample groups. Various explanations can be given to account for the differences in response patterns between Black and White groups, including linguistic proficiencies, attitudes,
Figure 6: Standardised parameters for the two-factor LCI model in respect of the White group Internal Control
and Autonomy
External Control
-0,40 E
E
E
E
E
E
E
E
E
E
E
E
E
E 0,51
0,66
0,62
0,50
0,54
0,43
0,53
0,64
0,65
0,73
0,63
0,65
0,75
0,72 Int 7
Int 6
Int 5
Int 4
Int 3
Int 2
Int 1
A
ut
8
A
ut
9
A
ut
7
A
ut
6
A
ut
5
A
ut
4
A
ut
3
A
ut
2
A
ut
1
Ext 1
Ext 2
Ext 3
Ext 4
Ext 5
Ext 6
Ext 7
0,58 0,68 0,53 0,56 0,62 0,71 0,71
E E E E E E E
0,70
E
0,73 0,65 0,56 0,69 0,66 0,62 0,54 0,54 0,55 0,52
E 0,74
0,56
0,62
0,75
0,71
0,81
0,72
0,59
0,58
0,47
0,60
0,58
0,44
motivation, values and culture specific differences (Owen 1996). A factor that certainly would have played an important role is that 96% of the Black African language speaking respondents did not complete the questionnaire in their first language, while 95% of the White respondents had the opportunity to complete the questionnaire in their first language. (Only Afrikaans & English versions of the LCI were distributed to the respondents.) Owen (1996) emphasises the importance of language proficiency as an influencing factor in differences that occur in test reliabilities and factor structures between cultural groups. Studies have shown that the average English language proficiency of Grade 12s in South Africa who indicate an African language as their first language, is below the acceptable functional literacy level based on English Literacy Skills Assessments (ELSA) ( Horne, 2001). Horne indicates that only 18 to 19 % of school-leavers (n=988) who applied for admission to technikons during the years 1999 and 2000, can be considered functionally literate in English (Grade 8 or above). A study done on year 2000 matriculants (n=1099) enrolled at a traditionally White metropolitan university, revealed that only 20% of the students were functionally literate in English at a Grade 10 level or higher. This could possibly explain the lower LCI reliabilities and construct validity in respect of people who did not complete the LCI in their first language.
Irrespective of the findings by Rieger and Blignaut (1996) that Blacks are more collectivistic in their orientation comparing to whites that are more indivudualistic, the extent to which cultural specifics or other factors played a role in the differences that exist in the construct validity of the LCI for Black and White groups is not known. Further studies need to be undertaken to explain the observed differences in construct validity.
ACKNOWLEDGEMENT
The authors would like to thank:
Professor G P de Bruin from the Department of Psychology, University of Stellenbosch for his assistance in the confirmatory structural modeling computations.
Professor J Schepers who made the LCI available for this study as well as for his advice regarding the research.
REFERENCES
Anastasi, A. and Urbina, D. (1997) Psychological Testing(7thed.)
Upper Saddle River, New Jersey: Prentice-Hall
Anastasi, A. (1990) Psychological Testing, New York, Macmillan Publishing Company.
Bentler, P.M. and Bonnett, D.G. (1980). Significance tests and goodness of fit in the analysis of covariance structures.
Psychological Bulletin, 88 (3), 588-606.
Bentler, P.M. (1990). Comparative fit indices in structural models. Psychological Bulletin, 107 (2), 238-246.
Bogazzi, R.P. and Heaterton, T.F. (1994). A general approach to presenting multifaceted personality constructs: Application to state self-esteem, Structural Equation Modelling, 1, 35-67. Buriel, R. (1981). The relation of Anglo- and Mexican-American
children’s locus of control beliefs to parents’ and teachers’ socialization practices. Child Development, 52, 104-113. Cattell, R.B. (1966). The scree test for the number of factors.
Multivariate Behaviour Research, 1, pp. 245-276.
Child, D (1990). The essentials of factor analysis (2nd ed.).
London:Cassell Educational Limited.
Chiu, L. (1988). Locus of control differences between American and Chinese adolescents. Journal of Social Psychology, 128, 411-413.
Cohen, J. (1988). Statistical power analysis for the behavioral sciences(Revised ed.). Orlando, CA: Academic Press.
Comrey, A.L. and Lee, H.B. (1992). A first course in factor analysis. Hillsdale, New Jersey: Lawrence Erlbaum.
Dean, S.A. (1984). External locus of control and career counseling for Black youth. Journal of non-White concerns in personnel and guidance, 12, 110-116.
DeVellis, R.F. (1991). Scale development: theory and applications. Newbury Park: Sage Publications.
Gaa, J and Shores, J. (1979). Domain specific locus of control among Black , Anglo, and Chicano undergraduates. Journal of Social Psychology, 42, 9-19.
Gorsuch, R.L. 1997. Exploratory factor analysis: Its role in item analysis. Journal of Personality Assessment, 68 (3), 532-560. Gregory, R.J. (1996) Psychological testing history, principles, and
applications (2nd ed.), Needham Heights, MA: Allyn
andBacon.
Hair, J.F., Anderson, R.E., Tatham, R.L. and Black , W.C. (1995).
Multivariate data analysis with readings. Upper Saddle River, NJ: Prentice-Hall, Inc.
Heaven, P., Rajah, D. and Bester, C.L. (1986). Hostility and locus of control in South Africa. Personality and Individual Differences, 7, 415-417.
Holburn, P.T. (1992) Differential item functioning in the mental alertness test. Unpublished master’s thesis, University of South Africa, Pretoria.
Horn, J.L. (1965). A rationale and test for the number of factors in factor analysis. Psychometrika, 30 (2):179-185.
Horne, T.J. (2001). Education and language transferees, The Education African Forum, 5. In press.
Kaiser, H.F. (1961). A note on Guttman’s lower bound for the number of common factors. British Journal of Statistical Psychology, 14 (1), 1.
Kanji, G.K. (1993). 100 statistical tests. London: SAGE Publications Inc.
Kelloway, E.K. (1998). Using LISREL for structural equation modeling; a researcher’s guide. Thousand Oaks: Sage Publications, Inc.
Kim, J. and Mueller, C.W. (1978). Factor Analysis: Statistical methods and practical issues. Sage University Paper series on Quanitative Applications in the Social Sciences, series no 07-014. Beverly Hills and London: Sage Publications Ltd. Kishor, N. (1983). Locus of control and academic achievement:
Ethnic discrepancies among Fijians.Journal of Cross-cultural Psychology, 14, 297-308.
Krampen, G and Weiberg, H. (1981). Three aspects of locus of control in German, American, and Japanese university students. Journal of Social Psychology, 113, 133-134.
Kureshi, A. and Husain, A. (1981). Locus of control among Indian, Iranian and Palestinian students. Psychological studies, 26, 1-2.
Medskar, G.J., Williams, L.J. and Holahan, P.J. (1994). A Review of current practices for evaluating causal models in organizational behavior and human resources management research. Journal of Management, 20, 439-464.
Mirowsky, J, and Ross, C.E. (1984). Mexican culture and its emotional contradictions. Journal of Health and Social Behaviour, 25, 2-13.
Otterman, Y. (1999). http://miavx1.muohio.edu/~psybersite/ control/culture.htx.
Owen, K. and Taljaard, J.J. (1996). Handbook for the use of Psychological and Scholastic tests of the HSRC. Pretoria: Human Sciences Research Council.
Padilla, A.M., Wagatsuma, Y. and Lindholm, K.J. (1985). Acculturation and personality as predictors of stress in Japanese and Japanese-Americans. Journal of Social Psychology
Plug, C., Meyer, W.F., Louw, D.A. and Gouws, L.A. (1986)
Psigologie woordeboek, McGraw-Hill: Johannesburg.
Reynolds, C.R. (1982). The problem of bias in psychological assessment. In C.R. Reynolds and T.B. Gutkin (Eds), The handbook of school psychology. New York: Wiley
Rotter, J.B. (1966) “Generalized expectancies for internal versus external control of reinforcement” Psychological Monographs, 80(1), no.609.
Schaap, P. (2001). Determining differential item functioning and its effect on the test scores of selected PIB Indexes, using item response theory techniques. Journal of Industrial Psychology, 27 (2), 32.
Schepers, J.M. (1995) Locus of Control Inventory. Unpublished Report: Rand Afrikaans University.
Schepers, J.M. (1999). Die Lokus van Beheer-vraelys: Konstruksie en evaluering van ‘n nuwe meetinstrument. Unpublished report: Rand Afrikaans University.
Steiger, J.H. (1995). Manual to Statistica-SEPATH. Tulsa, OK:Statsoft Inc.
Tabachnick, B.G. and Fidell, L.S. (1989). Using multivariate statistics
(2nded). New York, NY: Harper Colling Publishers, Inc.
Tinsley, H.E.A., and Tinsley, D.J. (1987). Uses of factor analysis in counseling psychology research. Journal of Counselling Psychology, 34, 414-424.
Tucker, L.R. (1951). A method for synthesis of factor analysis studies. Personnel Research Section Report, No 984. Washington, D.C.: Department of the Army.
Van Zyl, E and Visser, D. (1998). Differential Item functioning in the Figure Classification Test. Journal of Industrial Psychology, 24 (2), 25-33.
Young, J.W. and Shorr, D.N. (1986). Factors affecting locus of control in school children. Genetic, Social, and General Psychology Monograms. 112, 405-417.