In vitro Coculture Models to Study Heterotypic Interactions in Breast Cancer Microenvironments
Patricia Casbas-Hernandez
A dissertation submitted to the faculty of The University of North Carolina at Chapel Hill in partial fulfillment of the requirements for the degree of Doctor in Philosophy in the
Department of Pathology and Laboratory Medicine.
Chapel Hill 2013
Approved by:
Melissa A. Troester, Ph.D., M.P.H. Keith D. Amos, M.D.
William B. Coleman, Ph.D. David G. Kaufman M.D., PhD Liza Makowski, Ph.D.
II
© 2013
III ABSTRACT
PATRICIA CASBAS-HERNANDEZ: In vitro Coculture Models to Study Heterotypic Interactions in Breast Cancer Microenvironments
(Under the direction of Melissa A. Troester, Ph.D. M.P.H.)
Epithelial-stromal interactions are fundamental to tissue homeostasis and may alter breast cancer (BC) initiation and progression. Co-evolution of the neoplastic epithelium and the stroma implies that these compartments maintain an active dialogue with functional consequences for both parts. To study epithelial-stromal interactions and elucidate the role of stromal variation in tumor phenotypes, in vitro cocultures can be used. Gene expression data and cell-based assays from cocultures can identify cellular phenotypes and biomarkers with possible relevance in human studies. This research hypothesizes that stromal-epithelial interactions are altered from early in carcinogenesis (Chapter2) and that the different subtypes of invasive BC have distinct heterotypic interactions (Chapter3).
IV
when the HGF-pathway was blocked. A novel HGF genomic signature was identified and was highly expressed in 86% of BLBCs. High expression of this HGF signature predicted worse overall survival among BLBC patients. These results show that HGF secretion and complementary MET overexpression occurs early in BLBC carcinogenesis with important consequences in invasive tumors.
Heterotypic interactions in cancer-adjacent tissue also differ by BC subtypes. We studied gene expression data of cancer-adjacent tissue from 158 BC patients and performed in-vitro cocultures. Gene expression analysis shows triple-negative BCs are associated with upregulated immune response and cytokine gene expression and Luminal BCs are associated with estrogen-response in cancer-adjacent tissues. Intrinsic tumor subtypes are reflected in the histologically normal cancer-adjacent tissue.
V DEDICATION
VI
TABLE OF CONTENT
LIST OF TABLES ... ix
LIST OF FIGURES ... x
LIST OF ABBREVIATIONS ... xi
Chapter 1 ...1
1.1. Overview ...1
1.2. The Tumor microenvironment: ...2
1.3. In vitro cocultures as models to study the microenvironment. ...4
1.3.1. Cellular phenotypes of epithelial cells in coculture: ...7
1.3.2. Confirming changes in cellular phenotypes: ...13
1.4. Mouse models for comparative biology of tumor microenvironment ...16
1.5. In vivo studies of breast cancer microenvironments. ...17
1.6. Significance...18
1.7. Figures and Tables ...19
Chapter 2 ...23
2.1. Overview ...23
2.2. Introduction ...24
2.3. Methods ...26
2.3.1. Cell lines and treatments ...26
2.3.2. Primary fibroblasts ...27
2.3.3. Coculture conditions and treatments ...27
2.3.4. RNA and expression microarrays ...27
VII
2.3.6. Calculation of Basal-like interaction score ...29
2.3.7. Analysis of cytokine expression in conditioned media ...30
2.3.8. Western Blot ...30
2.3.9. qPCR for MET and HGF ...31
2.3.10. Generation of coculture-derived HGF signature. ...31
2.3.11. Correlation with HGF signature in human tumors ...32
2.3.12. Migration/Wound assays ...33
2.3.13. 3D Morphogenesis assay ...33
2.3.14. Statistical analysis ...35
2.4. Results ...36
2.4.1. The MCF10A series acquire “Basal-like microenvironment” characteristics...36
2.4.2. Upregulation of secreted cytokines in MCF10DCIS-fibroblast cocultures. ...37
2.4.3. An HGF gene signature correlates with Basal-like tumors ...38
2.4.4. Blocking of HGF inhibits three dimensional phenotypes ...39
2.5. Discussion ...42
2.6. Figure and Tables ...46
Chapter 3 ...60
3.1. Overview ...60
3.2. Introduction ...61
3.3. Methods ...62
3.3.1. Patient samples:...62
3.3.2. RNA, expression microarrays and subtyping: Tumor samples ...64
3.3.3. RNA and expression microarrays: Cancer-adjacent samples ...64
3.3.4. Supervised analysis of cancer-adjacent tissue ...65
3.3.5. Composition analysis of cancer-adjacent tissues ...65
3.3.6. Cell lines and Coculture conditions...66
VIII
3.3.8. Coculture data normalization and analysis ...67
3.3.9. Statistical analysis ...68
3.4. Results ...69
3.4.1. Tumor intrinsic subtype is reflected in Cancer-adjacent tissue. ...69
3.4.2. Cancer-adjacent expression is not associated with tissue composition. ...71
3.4.3. Cancer-adjacent biology can be recapitulated in vitro. ...71
3.5. Discussion ...73
3.6. Figures and Tables ...77
Chapter 4 ...88
4.1. Summary of main findings ...88
4.2. Implications for evolutionary theories of carcinogenesis. ...88
4.3. Limitations and future directions ...91
4.3.1. Coculture models of gene expression ...91
4.3.2. Tissue-based genomic studies. ...94
4.4. Translational implications of findings ...95
Appendix 1. BREAST TISSUE COMPOSITION MEASURMENTS. ... 100
IX
LIST OF TABLES
Table 1.1: Whole genome microarray studies in vivo. ...20
Table 1.2: Whole genome microarray studies in vitro ...22
Table 2.1. Pathway analysis of genes in MCF10DCIS:RMFs cocultures ...48
Table 2.2. Biological function analysis of genes in MCF10DCIS:RMFs cocultures. ...49
Table 2.3.. Number of cytokine expressed in MCF10A series in coculture. ...51
Table 2.4. Fold change of all cytokine in coculture of the MCF10A series. ...52
Table 2.5. Analysis of lumen and apoptosis quantification. ...59
Table 3.1. Characteristics of PWBCS Polish patients ...77
Table 3.2. Biological functions analysis of genes expressed in cancer adjacent tissue. ....79
Table 3.3. Pathway analysis of genes expressed in cancer adjacent tissue ...80
Table 3.4. OR of estrogen response signaling in the cancer-adjacent tissue. ...81
Table 3.5. Cancer-adjacent tissue classified by ER status & distance from tumor (NBS). .82 Table 3.6. OR of triple-negative microenvironment signature in cancer-adjacent tissue ....83
Table 3.7. Cancer-adjacent tissue classified by subtype ...84
Table 3.8. Biological function analysis of genes expressed in BL and Clow cocultures. ....86
Table 3.9. Pathway analysis of genes expressed in BL and C-low cocultures ...87
X
LIST OF FIGURES
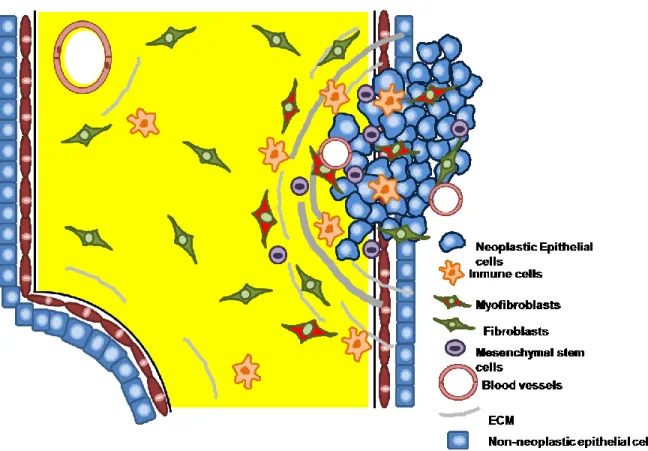
Figure 1.1. Intra and extratumoral microenvironments ...19
Figure 2.1. Primary fibroblasts have instability ...46
Figure 2.2. The MCF10A series acquires “basal-like microenvironments”. ...47
Figure 2.3. The MCF10A series acquires “basal-like microenvironments” in interaction cocultures. ...50
Figure 2.4. The MCF10A series cocultures present different HGF and MET status ...53
Figure 2.5. HGF is produced by the stromal component of the cocultures...54
Figure 2.6. HGF signaling is present in vivo in basal-like tumors ...55
Figure 2.7. Blocking HGF signaling reverts basal-like microenvironments and morphogenesis. ...56
Figure 2.8. Blocking HGF signaling inhibits migratory phenotypes in MCF10DCIS. ...57
Figure 2.9. Quantification of OCT measurements of the acini structures. ...58
Figure 3.1. Tumor Intrinsic Subtype is reflected in Cancer-Adjacent Tissue. ...78
Figure 3.2. Triple-negative microenvironments can be recapitulated in vitro ...85
Figure 4.1. Summary of findings. ...97
Figure 4.2. Evolutionary theories of carcinogenesis. ...98
Figure 4.3. Natural history of breast cancer. ...99
XI
LIST OF ABBREVIATIONS
3D: three dimensional BC: Breast Cancer
BCT: Breast Conserving Therapy BLBC: Basal-like Breast Cancer CI: Confidence Interval
DCIS: Ductal Carcinoma In situ ER: Estrogen Receptor
EReS: Estrogen Response Signature H&E: Hematoxilin and Eosin
HER2: HER2-like Breast Cancer HGF: Hepatocyte Growth Factor IHC: Immunohistochemistry IPA: Ingenuity Pathway Analysis LumA: Luminal A Breast Cancer LumB: Luminal B Breast Cancer N: Number
NBS: Normal Breast Study
OCT: Optical Coherence Tomography OR: Odds Ratio
PAM: Predictive Analysis of Microarray PR: Progesterone Receptor
PWBCS: Polish Women’s Breast Cancer Study RMF: Reduction Mammary Fibroblasts
XII
TN: Triple-Negative
Chapter 1
EPITHELIAL-STOMAL INTERACTIONS IN BREAST CANCER
1.1. Overview
2
1.2. The Tumor microenvironment:
The value of studying heterotypic interactions in breast cancer biology.
Breast cancer is a heterogeneous disease. Using gene expression patterns of tumors, researchers have identified six subtypes of breast cancer: Normal-like, Luminal A, Luminal B, Her2-enriched, Basal-like and Claudin-low. Each subtype is characterized by the expression of a subset of genes and has specific trends in response to treatment and overall survival [1-4]. However, in recent years it has become clear that the intrinsic characteristics of the tumor is not just a function of the epithelial cells, but also reflects interactions of epithelial cells with their microenvironment [5].
Cancer research has traditionally focused on the study of the neoplastic cells and how their intrinsic characteristics can be altered and modified to produce cell death or better respond to therapy [6]. While mutations in oncogenes and tumor suppressors cause neoplastic epithelial cells to lose many of their growth constraints, neoplastic cells do not lose their interactions with the surrounding non-malignant cells or with the extracellular architecture [7]. Instead, the interactions with cells in the microenvironment change during cancer progression and can promote or repress the tumorigenic process [8, 9]. Growth factors, cytokines and proteolytic enzymes are upregulated and secreted [10, 11], giving a histological appearance of granulation tissue similar to tissue morphology during physiological wound healing processes. The observation of histological changes in tumor adjacent tissue led Dr. Hal Dvorak to propose that tumors are “…wounds that do not heal…” [12]. More recent experimental and observational studies have expanded on these observations to further suggest that an activated stroma may be dominant in cancer progression [13, 14].
3
pregnancy and postlactational involution). Extracellular matrix (ECM) function and composition are remodeled during pregnancy and lactation [15, 16], and these changes along with other changes in tissue cellular composition appear to contribute to increased breast cancer progression [15]. Conversely, progression can be reversed by stromal changes. Tamoxifen, a drug that primarily targets ER-positive epithelium, induces changes in mammary stroma leading to suppression of transformed phenotypes [17] and pre-malignant breast cancer cells placed on a reconstituted physiological basement membrane undergo cell growth arrest and form polarized alveolar structures as normal epithelial cells would [18]. These observations illustrate the important role of stromal response in breast cancer.
4
influences tumor progression, reflecting either a tissue level response to the tumor or the baseline biological behavior of the tissue in which the tumor developed [21].
Both intratumoral and extratumoral microenvironments are related to the concept of ‘field cancerization’, initially defined as changes to the epithelium which are found in histologically normal tissue near the site of tumorigenesis and that could account for local recurrences [22]. In recent years the concept of field cancerization has been broadened to include stromal changes. A review of epithelial-specific field effects have been presented elsewhere [23], but in the current review, we are focusing on intratumoral and extratumoral stromal changes. We prefer the term ‘microenvironment’ to address these stromal-epithelial interactions and reserve the term ‘field effect’ for epithelium-specific changes.
Studies of intratumoral and extratumoral stroma in patient specimens have identified interesting biological associations, but it is difficult to evaluate the specific contributions of distinct cellular populations in these complex tissues. Wiseman and Werb [11] concluded a review article in 2002 with an important idea: “…if our aim is to find cures for diseases that rely on epithelial and stromal crosstalk we must increase our understanding of how these different cell types communicate with each other…”. In vitro cell-cell communication studies can be integrated with studies from human tissue and with animal studies to better understand how heterotypic communication alters disease.
1.3. In vitro cocultures as models to study the microenvironment.
5
subtype [25]. Pathway focused studies in monocultures are also common. For example, Hoadley et al. showed that Basal-like breast cancer cell lines are more sensitive to the combination of carboplatin and cetuximab in vitro when compared to luminal cancer cell lines, and that EGFR-signatures have prognostic value when projected onto tumor datasets [26]. Other studies have identified p53-loss or p53-mutation associated signatures that can predict mutation status and survival in vivo [27, 28]. Studies of individual cell lines in monoculture have contributed to the development of new targeted therapies and are proving to have relevance in vivo. However, gene expression studies of monoculture experiments are not informative for microenvironment influences on progression. Coculture systems have become important in studying stromal factors.
Drastic changes occur when coculturing epithelium with different cell types. As a clear example, endometrial epithelial cells proliferate in response to estrogen only when cocultured with stromal cells, but not when they are in a monoculture [29]. Other studies have demonstrated that breast cancer cell lines in the presence of benign mammary epithelial cells have a more transformed phenotype than when grown in monoculture [9]. Thus, coculture systems can be used to better model key biological behaviors of epithelial and tumor cells advancing the complexity of the system by increments, focusing on one or a small number of particular characteristics of the tissue (e.g. fibroblast-cancer cell interactions or mechanical characteristics).
6
generate important insights. They can also preserve important physical characteristics. For example, fibroblast-to-myofibroblast transdifferentiation can be more easily studied on plastic (2D) than in Matrigel due to physical properties of the culture surface [35]. In both 2D and 3D cultures, there are a number of variables that play a role in determining what phenotypes are observed, including: the ratios of different cell types (using a convenient pre-specified ratio such as 1:1 vs. identifying multiple different biologically relevant ratios) [5], the number of cell types (e.g. choosing to coculture epithelial cells only with one stromal cell type or combining multiple cell types), mechanical factors (culture of cells with certain matrices or polymers to stimulate stiffness or other biophysical properties) [36] or the degree of cell contact (growing cells in direct physical contact or separating cell types on transwell cultures).
7
cell lines can persistently harbor changes due to the exposure history of their donors [39]. Some studies have used hTERT immortalized cells to create a renewable source of isogenic cell lines for coculture studies [5, 40], and this has some advantages for reproducibility. On the other hand, variation may be of interest itself, such as variation that suggest differences between African American and Caucasian fibroblast lines [41]. Aligning the strengths and weaknesses of a given model system with the research question is most important given that it is typically impossible to perfectly recapitulate the complexities of the tissue.
1.3.1. Cellular phenotypes of epithelial cells in coculture:
Changes in gene expression.
Epithelial gene expression has been examined in relation to exposure to different cell types such as fibroblasts, immune cells, and even adipocytes (Table 1.2). Fibroblasts are abundant in the extratumoral and intratumoral microenvironment and play an essential role in the maintenance of normal tissue. Activation of fibroblasts to myofibroblasts, creates a sustained fibrosis and wound healing response leading to the desmoplastic reaction in advanced breast carcinomas [6, 21]. Fibroblasts also deposit the ECM necessary for cells to adhere, and their activation changes ECM and signaling to alter tumor initiation and progression [19].
8
pro-survival genes when cultured with CAFs. Meanwhile, in culture with NAFs, MDA-MB-231 responded by down-regulating genes associated with glycolipid and fatty acid biosynthesis (ACSL5, AGTPAT4), potentially affecting membrane biogenesis, and MCF10A down-regulated genes critical for growth control and adhesion (DDIT4, CTNND1, PCDH1) [42]. The influence of the fibroblast on breast cancer cell gene expression has also been observed in cocultures comparing responses to (1) fibroblasts from negative and positive lymph nodes [43] and (2) fibroblasts from different anatomical sites and patients [44]. Each of these studies showed that fibroblasts from different sites and patients had distinct effects on the cancer cells with which they were cultured in both cell-based assays and gene expression. The fibroblasts from different anatomical sites (skin and lung) induce distinct proliferation effects on breast cancer cell lines and the proliferation responses could be used to segregate these cell lines on the basis of their tissue of origin [44]. The transcriptional changes induced in breast cancer cell lines when cocultured with fibroblasts from positive and negative lymph nodes had some common features. However, the fibroblasts were distinct for each breast cancer cell line, suggesting a response that is intrinsic to breast cancer subtype [43]. Likewise, in a different model system, soluble interactions between Basal and luminal cancer cells had distinct effects on fibroblast gene expression. When in a transwell coculture system Basal-like breast cancer cells induce the upregulation of genes such as IL-6, IL-8, CXCL3, TWIST and SOD2 in fibroblasts while luminal breast cancers do not [5]. These studies echo one another in demonstrating that both the fibroblasts and the cancer cells influence the character of the interaction.
9
resulting gene expression profiles. For example, cells can be transfected with a GFP reporter and grown in coculture with fibroblasts. The GFP-producing cells can then be isolated using flow cytometry, and subsequently analyzed [45]. Similarly, magnetic beads have been used to separate cells and demonstrate that tumor fibroblasts support neoplastic progression by altering the epigenome of mammary epithelial cells [46], specifically increasing hypermethylation of the CST6 gene. The authors of that study speculated that the direct cell-to-cell contact is involved in the epigenetic cascade that produces long term silencing of this gene. Others have performed a variety of cell sorting methods, ranging from use of surface markers to labeling of cells with short-lived cell tracking dyes [5]. These cell sorting methods are proving to be an important tool for deconvoluting cocultures.
10
interactions will yield important insights relative to treating and clinical course of these cancer subtypes.
Other stromal cell types (beyond fibroblasts) have been less well studied, but certainly play a critical role in tumor microenvironment. The most widely studied are endothelial, inflammatory and mesenchymal stem cells. For example, Buess et al. [49] have documented that endothelial cells cocultured with epithelial cells induce M-phase genes in the CD44+/CD24- epithelial cell population. This ‘M-phase cell cycle gene set’ consists of 70 genes such as HMGN2, CDC2, CDKN3, DICER, etc and can predicted metastasis in vivo. But perhaps more importantly, endothelial cocultures mirrored results with fibroblasts; gene expression studies showed complex patterns reflecting substantial variation in the abilities of normal and malignant cells to send and respond to extrinsic signals [5].
Macrophages have been evaluated for their role in tumor progression using coculture models. For example, Hagemann et al. [50] showed that coculture with macrophages increased tumor cell invasiveness through TNF-α dependent upregulation of matrix metalloproteinases (MMP-2,-3,-7,-9). Hou et al. [51] recently demonstrated that macrophages induce COX-2 expression in breast cancer cells through IL-1beta signaling. These observations gain greater importance when they are designed to confirm in vivo, biology, such as work following on recent studies [51] showing that tumor associated macrophages may enhance metastasis through activation of epidermal growth factor receptor signaling in neoplastic mammary epithelial cells. Continued work in cocultures with macrophages can elucidate whether these macrophage-cancer cell associations are subtype specific, as many of the markers induced in cancer cells (e.g. EGFR, COX2) are strongly associated with breast cancer subtype [52].
11
observed for a variety of mesenchymal and immune cell types, therefore, it may not be surprising that similar responses have been observed in cocultures with mesenchymal stem cells (MSCs). MSC are important players in the tumor microenvironment [26, 53], as they migrate and engraft into the primary tumor site. This was compellingly demonstrated in a humanized mouse model; tibial injections of human MSCs induced increased proliferation and progression of tumor xenografts [7]. These results also demonstrate that species differences are important because the mouse mesenchymal cells in the control animals (no tibial injection) were not capable of promoting progression as strongly. Complementary in vitro cocultures used in this study clearly demonstrated a role of CXCL7 and IL-6 signaling in the aggressive, invasive phenotypes induced by MSCs. Other recent results also support the role of MSCs in promoting a more aggressive phenotype, showing that after direct coculture of MDA-MB-231, T47D and SK-Br3 with MSCs, the cancer cells up-regulate genes such as SNAIL, TWIST, vimentin, N-cadherin, and others. [54]. Similar observations were detected in transwell assays with SUM149 and HMEC cells [55], suggesting that many of these signals may be communicated via soluble factors, potentially including those factors identified by Liu et al. [54].
Cocultures have also been used to study how tumors metastasize to specific site and what molecular mechanisms are involved. A recent study by Rajski et al. demonstrated that cocultures of malignant breast epithelial cell lines with osteoblasts from the bone marrow increase IL-6 expression profiles; these profiles were associated with increased rates of bone metastasis in vivo [56]. Others have demonstrated that specific molecules increase the affinity to specific cell types in the metastatic sites, Claudin-2 increases the affinity of breast cancer cells to hepatocytes, increasing the possibility of liver metastasis [57].
12
epithelial cells were directly cocultured with bone marrow stromal cells and microRNAs were shown to be transported via gap junctions between cancer cells and MSCs. These microRNAs led to reduced CXCL12 expression and a decreased proliferation [54]. Thus, future studies of gene expression changes in cocultured cells may find that microRNAs play an important role in controlling some of the observed gene expression profiles. The direct cell-cell transport of critical mRNA regulators suggests that the complexity of cell-cell interactions far exceeds what we have begun to understand. However, a growing database of gene expression data from coculture studies will help to advance our understanding of the unique cell-cell interactions that influence cancer progression.
13 1.3.2. Confirming changes in cellular phenotypes:
Using cell-based assays to corroborate gene expression data with cocultures.
14
Many of the stromal cocultures discussed above have been evaluated for their effects on migration of cancer cells. For example, focusing on fibroblasts, Potter et al. [60] showed that tumor stromal cells (compared to normal stromal cells) caused greater chemotaxis of MDA-MB-231 and that this effect could be blocked by the addition of a monoclonal antibody to CCL2. MCF7s also become more migratory when cocultured with fibroblasts [60]. Fibroblast populations isolated from different distances relative to a breast tumor had distinct effects on the migratory capacity of MCF7 cells in scratch assays [61]. Similar findings have been observed for MSCs [48] and macrophages [62]. Breast adipocytes are abundant, comprising a major percentage of the extratumoral microenvironment, and have also been cocultured with breast cancer cells. Adipocytes are challenging to culture and coculture because they terminally differentiate and cannot be propagated to achieve a reproducible culture system; however, they are proving to have important implications for cancer progression. Dirat et al. [63] showed that the estrogen-receptor positive breast cancer cell line ZR75.1, and the estrogen-estrogen-receptor negative line SUM159PT, both increased their invasive capacity after 72 hours in coculture with mature primary adipocytes.
15
assays, cells are grown in a gel-like matrix that provides more structure than a suspension
culture, but the same phenotypes (colony number and size) are assessed after a period of growth, typically at least two weeks. These assays have been used to confirm anchorage-independent growth changes in coculture. For example, breast cancer fibroblasts decreased time required for MCF7s to form mammospheres, and increased the overall number of spheres relative to cocultures with normal fibroblasts. Additionally, when MDA-MB-468, a Basal-like breast cancer cell line, was cocultured with CAFs, the number of soft agar colonies were higher than when cocultured with NAFs [64]. MSCs have also been shown to induce mammosphere formation in human mammary epithelial cells (HMEC), and SUM149 but not in primary inflammatory breast cancer cells (MDA-IBC-3). These effects occurred though paracrine factors, as conditioned media from the MSCs had the same effects [65]. In 3D cultures, we can perform morphogenesis assays in which we study how proliferation, apoptosis and migratory phenotypes occur simultaneously, these assays are useful to analyze the malignant behavior of epithelial cells [32, 33, 66].
16
1.4. Mouse models for comparative biology of tumor microenvironment
Given identification of novel hypotheses from in vitro cocultures and confirmation of the cellular phenotypes in vitro, a complete picture of stromal-epithelial interactions requires linkages with studies in vivo. As described above, public genomic data can be useful for this purpose, but mouse models have contributed to our fundamental understanding of the reciprocal signaling between stroma and epithelial compartments. Noel et al. [68] performed the first inoculation of cocultured fibroblasts and breast cancer cell lines with matrigel in an athymic mice model. The inoculation of these cocultures decreased the latency time and enhanced tumor growth. Both tumor growth and latency time were dependent on the number of inoculated fibroblasts in the coculture. In another classic example, it was demonstrated that when non-tumorgenic cell lines are introduced into irradiated cleared fat pads, they form tumors. Conversely, when introduced into cleared fat pads that have not been irradiated the same tumorogenic cell lines do not form tumors. This indicates that radiation induces changes in the stromal microenvironment that contribute to neoplastic progression in vivo [68]. More recently, Hu et al. [69] have shown that myoepithelial cells suppress, while fibroblasts enhance, tumor progression from DCIS to invasive cancer in a mouse xenograph model. Novel models for combining and humanizing the microenvironment have also been proposed, including a humanized mouse xenograft model into cleared fat pads [69], and an intraductal xenografts, where human cell lines can be injected alone or with stromal components [70]. An advantage of these models is that some of the innate immune responses are preserved, as is the systemic circulation and the three dimensional structure of the tissue.
17
suppressor genes: p53 and Rb, giving rise to a very predictable onset of tumors [72]. They most commonly develop tumors with features of Basal-like breast cancer. Thus, these models may be useful for studying Basal-like microenvironments. Future studies should examine how microenvironment characteristics, such as obesity or immune cell ablation influence the progression of tumors in some of these model systems, to gain a perspective on the role of microenvironment in different breast cancer subtypes. These models, when combined with coculture-based mechanistic studies, can be a powerful combination.
1.5. In vivo studies of breast cancer microenvironments.
18
breast cancer survival and relapse in independent datasets. Finally, Beck et al. have studied both macrophage infiltration-associated gene expression [78] and fibromatosis-associated gene expression [79] as predictors of outcome. These studies cumulatively suggest that tumor progression occurs due and is the results of the concerted action of a variety of stromal responses.
1.6. Significance
19
1.7. Figures and Tables
20
Table 1.1: Whole Genome Microarrays studies to investigate breast cancer microenvironments in human tissues.
Authors [citation]
Type of specimen studied Processing of
specimen Type of micro-environment
Major Findings
Finak et. al.(2008) [75]
Fresh, frozen tissue from primary cancers (53) and adjacent non-affected tissue (31) from breast cancer patients
Laser capture microdisection of
tumor stroma
Intratumoral vs Extratumoral
Stromal Derived Prognostic Predictor (SDPP),a gene set that stratifies patients by disease outcome. Genes are involved in immune response, angiogenesis and hypoxic response
Ma et al. (2009) [14]
Fresh frozen biopsies from disease free tissue, DCIS and invasive breast cancer (14).
Laser capture microdisection
Intratumoral Tumor microenvironment participates in tumorogensis before tumor cells invade. Invasiveness is dependent on the signals from myoepithelial cells, fibroblasts and myofirboblasts.
Allinen et al. (2004) [76]
Snap frozen biopsies from reduction mammoplasties, DCIS and invasive breast cancer.
Isolation of pure cell populations by
differential centrifugation
Intratumoral Widespread genome changes in all stromal cell types. Genetic alterations only occur in epithelial cancer cells.
Troester et al. (2009)[73]
Snap frozen tissue from histologically normal tissue adjacent to breast cancer (47) and reduction mammoplasties (60).
Whole genome profiles of the tissue
Extratumoral A wound response is activated in the tumor microenvironment. The wound response signature predicts cancer progression.
Chang et al. (2004) [77] , Chang et al. (2005) [74]
Isolated fibroblasts from 10 different anatomical sites &
Tissue from early breast cancer patients (295)
In vitro response of the fibroblast populations to serum
Intratumoral
Normal tissue
Identification of an in vitro wound response, enriched in early stage tumors High expression of this signature correlates with worse overall survival and increased distant metastasis.
Beck et al (2008)
[79] Desmoid fibromatosis and solitary fibrous tumors. Intratumoral DTF core gene set (derived mainly from fibroblasts) is a robust descriptor of stromal response that is associated with improved clinical outcome in public genomic data from breast cancer patients.
Beck et al. (2009)
[78] Tenosynovial tumors and giant pigmented cell villonodular synovitus
Intratumoral The CSF1 gene expression signature (derived mainly from macrophages) is present in more aggressive cancers.
Luciani et al. (2011) [59]
Tissue from primary breast tumors and reduction mammoplasties
Isolation of epithelial and fibroblast cells.
Intratumoral A ‘fibroblast triggered gene expression’ gene set generated by coculture of primary breast tumor cell lines and fibroblasts is enriched for inflammatory signaling, cell death and cell proliferation genes. Predicts survival in independent datasets.
Roman-Perez et al. (2012) [80]
Cancer-adjacent tissue from invasive tumors (72)
Extratumoral There are 2 subtypes of cancer-adjacent tissue independent of tumor subtype with distinct survival patterns.
21
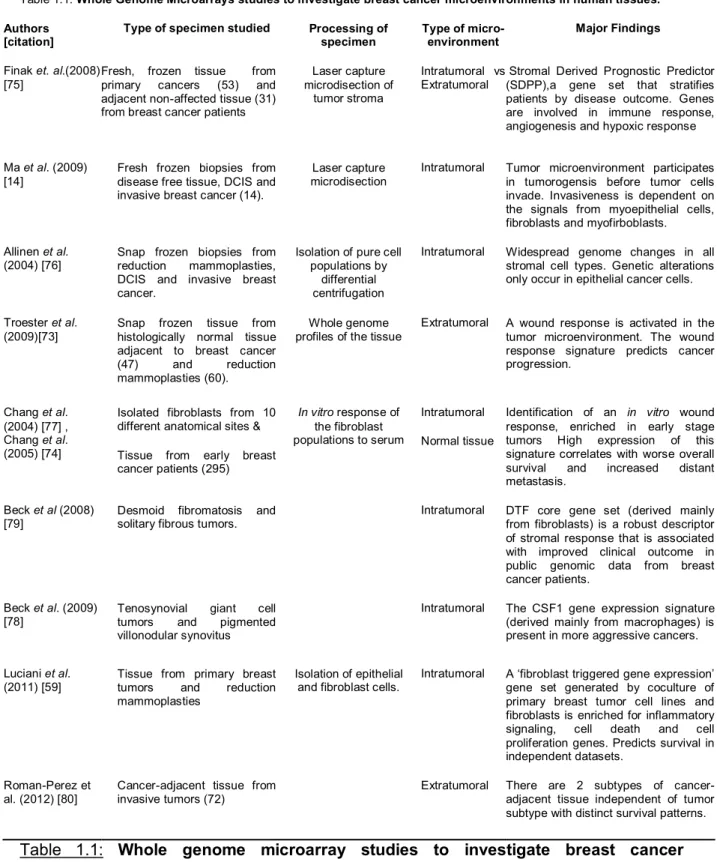
Table 1.2: Whole genome microarray studies to investigate breast cancer tumor microenvironment in vitro
Authors [citation] Cancer cell lines used Stromal cell lines used Type of coculture Special separation techniques Linked to human in vivo data
Major Findings
Rozenchan et al. (2009) [42]
MCF10A MDA-MB-231
Primary CAFs and NAFs
Transwell No No Epithelial cell lines
upregulate different pathways when cocultured with the two types of fibroblasts. MDA-MB-231-CAF cocultures CAFs upregulate β-catenin/TCF pathway genes; MDA-MB-231-NAF cocultures .down regulate glycolipid and fatty acid biosynthesis. MCF10A-CAF cocultures upregulate stress response genes, while MCF10A-NAF cocultures downregulate
growthcontrol and adhesion genes. Santos et al.
(2011) [43]
MDA-MB-231, MDA-MB-435, MCF7
Primary fibroblasts from positive and negative LN
Transwell No No Gene expression
changes induced by coculture with fibroblasts from positive and negative nodes are distinct and intrinsic to each tumor subtype. Camp et al.
(2010) [5]
MCF7, T47D, ZR75, Sum102, Sum149, HCC1537 Immortalized reduction mammary fibroblasts Direct physical contact & transwell
Yes Computational
deconvolution
The response to fibroblast coculture differs between Basal like and luminal cancer cell lines. The genes that distinguish Basal-like vs. luminal cultures also distinguishes human tumors. Basal-likes upregulate interleukins and chemokines (IL-6, IL-8, CXCL1, CXCL3, TGF-β) also TWIST and SOD1. Luminal cells increase stress response genes.
Buess et al.
(2009)[49] Hs578T, BT549, MB-436, MDA-MB-231, HMEC, SKBR3, MCF7, T47D, HMECs
Stromal fibroblasts: human dermal fibroblasts, embryonic lung fibroblasts, breasts stromal fibroblasts
Transwell & direct physical contact
Yes Computational
deconvolution Interaction some breast cancer cells between and stromal fibroblasts induced interferon response. The presence of this response is associated with higher risk of tumor progression Buess et al.
(2009)[49]]
HMECs, MCF7, T47D, MDA-MB-231, SKBR-3, Hs578T, BT549
HuVECs & Human dermal microvascular endothelial cells
Direct physical coculture & transwell
Yes Computational
deconvolution
22
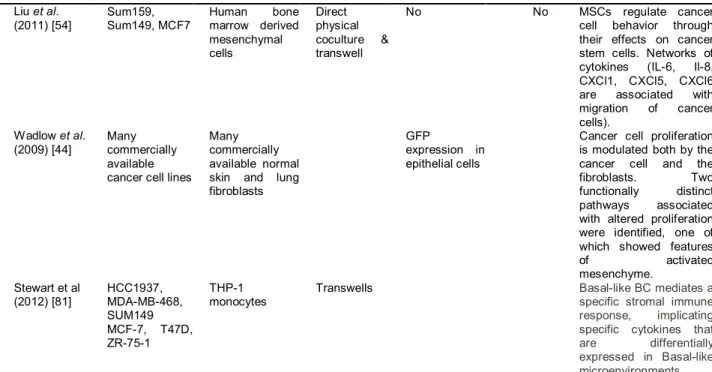
Liu et al. (2011) [54]
Sum159, Sum149, MCF7
Human bone marrow derived mesenchymal cells
Direct physical coculture & transwell
No No MSCs regulate cancer
cell behavior through their effects on cancer stem cells. Networks of cytokines (IL-6, Il-8, CXCl1, CXCl5, CXCl6 are associated with migration of cancer cells).
Wadlow et al. (2009) [44]
Many commercially available cancer cell lines
Many commercially available normal skin and lung fibroblasts
GFP
expression in epithelial cells
Cancer cell proliferation is modulated both by the cancer cell and the fibroblasts. Two functionally distinct pathways associated with altered proliferation were identified, one of which showed features
of activated
mesenchyme. Stewart et al
(2012) [81]
HCC1937, MDA-MB-468, SUM149 MCF-7, T47D, ZR-75-1
THP-1 monocytes
Transwells Basal-like BC mediates a
specific stromal immune response, implicating specific cytokines that are differentially expressed in Basal-like microenvironments
Chapter 2
ROLE OF HGF IN EPITHELIAL-STROMAL CELL INTERACTIONS DURING
PROGRESSION FROM BENIGN BREAST DISEASE TO DUCTAL CARCINOMA IN
SITU.
2.1. Overview
Introduction: Basal-like and Luminal breast cancers have distinct stromal-epithelial interactions, which play a role in progression to invasive cancer. However, little is known about how stromal-epithelial interactions evolve in benign and pre-invasive lesions.
Methods: To study epithelial-stroma interactions in Basal-like breast cancer progression, we cocultured reduction mammoplasty fibroblasts (RMFs) with the isogenic MCF10 series of cell lines (representing benign/normal, atypical hyperplasia, and ductal carcinoma in situ). We used gene expression microarrays to identify pathways induced by coculture in
premalignant cells (MCF10DCIS) compared to normal and benign (MCF10A and MCF10AT1). Relevant pathways were then (1) evaluated in vivo for associations with Basal-like subtype and (2) targeted in vitro and effects on morphogenesis were evaluated.
24
upregulation of HGF/MET in MCF10DCIS cells induced morphological changes suggestive of malignant potential, and these changes were reversed by antibody-based blocking of HGF signaling. These results are relevant to in vivo progression because high expression of a novel MCF10DCIS-derived HGF signature was correlated with Basal-like subtype and with worse overall survival, with approximately 86% of Basal-like cancers highly expressing the HGF signature.
Conclusions: In this study we document coordinated and complementary changes in HGF and MET expression in epithelium and stroma in pre-invasive lesions. These results suggest that targeting stroma-derived HGF signaling in early carcinogenesis may block progression of Basal-like precursor lesions.
2.2. Introduction
25
invasive characteristics, it is not well known how host-tumor interactions are maintained earlier in disease progression.
We hypothesized that Basal-like breast cancers may have unique interactions with their microenvironments beginning in the early stages of progression. In epidemiologic studies, there is evidence that Basal-like breast cancers progress very rapidly through the ductal carcinoma in situ stage (DCIS) compared to other cancers [85]. However, many of the DCIS-adjacent stromal tissue studies have been from patients who also have invasive cancers in the same breast [14], and given the cross-sectional nature of these studies (with data at only a single time point in the progression of disease), it is difficult to identify epithelial-stromal interactions that are induced during progression. In addition, stroma from DCIS lesions and invasive tumors are very similar, suggesting that stromal changes may occur prior to invasion [14, 76]. It is important to identify pathways that are altered in the stroma prior to invasion as these pathways may be targetable.
26
2.3. Methods
2.3.1. Cell lines and treatments
MCF10A, MCF10AT1 and MCF10DCIS.com (referred to as MCF10DCIS) were purchased from Karmanos Cancer Institute (Detroit, MI) and Asterand (Detroit, MI). These cell lines were maintained in DMEM supplemented with 5% horse serum, 50 units/mL penicillin, and 50 units/mL streptomycin, 5 μg/mL insulin (GIBCO, Life technologies, Carlsbad, CA), 1 μg/mL hydrocortisone (Sigma-Aldrich), cholera toxin (EMD, Millipore, Darmstadt, Germany) and EGF (Invitrogen, Life technologies, Carlsbad). Cocultures were also performed in this media after ascertaining that reduction mammary fibroblasts (RMFs) maintained their RPMI 1640 doubling times in this DMEM/F12. MCF7 (Luminal cell line) and SUM149 (Basal-like cell line) were purchased from ATCC. RMFs (htert-immortalized fibroblasts from reduction mammoplasty [70]) were provided by Dr. Charlotte Kupperwasser (Tufts University). We selected an htert immortalized cell line for our experiments over primary cell lines (as other studies have done [38]), for several reasons. Primary cells have a limited life; after 9 passages they senesce allowing insufficient time to perform many assays (such as the 3D assays described below). Even prior to senescence, the aging process and patient-to-patient variation affects gene expression as shown by quantitative reverse transcriptase (RT) PCR for HGF. Figure 2.1 shows HGF RNA levels vary by up to 546-fold for a panel of 14 primary CNAF (Cancer-normal associated fibroblasts, obtained from histologically normal tissue adjacent to a tumor) and CAFs (Cancer-associated fibroblasts) at different passages. These cell lines were maintained at 37˚C and 5% CO2 in RPMI 1640 or DMEM/F12 with L-glutamine (GIBCO) supplemented
27 2.3.2. Primary fibroblasts
Primary fibroblasts were obtained from breast tissue of patients undergoing breast surgery for primary invasive breast carcinoma at UNC Hospital. Tissue specimens were procured under an IRB-approved protocol by the Lineberger Cancer Center Tissue Procurement Facility. Isolation protocol of these CNAFs and CAFs was previously described in [38].
2.3.3. Coculture conditions and treatments
Two types of cocultures were performed using media and culture conditions described above and previously in [5]. Direct cocultures are defined as a coculture where the two cell types are grown in direct physical contact, in the same well. The following epithelial:RMF ratios were plated for these cocultures: 1:4, 1:2, 1:1, 2:1 as well as the monocultures of each cell line and cells were maintained for 48 hours before RNA isolation. Interaction cocultures are defined as a coculture where the fibroblasts and cancer cells are separated by a porous membrane that allows cell-cell communication via soluble factors. For interaction cultures, fibroblasts were seeded in inserts on Corning Transwell plates with 0.4 μm pore polycarbonate membranes; epithelial cells were grown in the bottom well. Interaction cultures were plated at a 1:1 ratio and maintained for 48 hours before RNA isolation.
2.3.4. RNA and expression microarrays
28
Nanodrop spectrophotometer. Microarrays were performed according to Agilent protocol using two-color Agilent 4×44K V2 (Agilent G4845A). We used the Agilent Quick Amp labeling kit and protocol to synthesize Cy3-labeled reference from Stratagene Universal Human Reference spiked at 1:1,000 with MCF7 RNA and 1:1,000 with ME16C RNA to increase expression of breast cancer genes. The identical protocol was applied to total RNA from cocultured or monocultured cell lines to label these samples with Cy5. Labeled cDNAs were hybridized to arrays overnight and washed before scanning on an Agilent G2505C microarray scanner.
2.3.5. Coculture data normalization and analysis
29
was generated. The estimated “I” for each gene and coculture can be thought of as an indicator of the ratio of that gene's expression level relative to the expected level based on the cellular composition and the monoculture expression values. For coculture studies, I-matrices were analyzed using multiclass Significance Analysis of Microarrays (SAM [86]), comparing MCF10A to MCF10AT to MCF10DCIS cocultures (three classes). Microarray analysis was done using R.1.14. Heatmap generation and visualization were done using Cluster 3.0 and Java treeview, respectively. Functional and pathway analyses were done using Ingenuity Pathway Analysis (IPA), with Benjamini–Hochberg multiple testing correction to identify significant functions and pathways with P-values less than 0.05. Pathways and functions with less than 2 genes were excluded from our analysis.
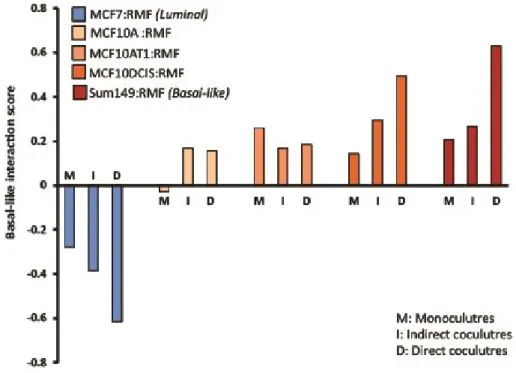
2.3.6. Calculation of Basal-like interaction score
30
2.3.7. Analysis of cytokine expression in conditioned media
To identify soluble mediators of Basal-like microenvironments in the MCF10DCIS cells, conditioned media samples from direct 1:1 cocultures (48 hours, standard coculture media conditions as described above) were analyzed according to manufacturer protocol on a RayBio Human Cytokine Antibody Array 5 (80) (Raybiotech, Norcross GA) designed to detect 80 cytokines and chemokines. Briefly, slides were blocked by incubation with blocking buffer at room temperature for 30 min and incubated with 100 µL of conditioned media at room temperature for 90 minutes. Slides were washed and incubated with biotin-conjugated antibodies overnight at 4˚C. Finally, the slides were washed and incubated with fluorescent dye-conjugated streptavidin at room temperature for 2 hours. After final washing, slides were dried by centrifugation at 0.2 RCF (Centrifuge 5702R Eppendorf, Hauppauge, NY) for 3 minutes. Fluorescent signal was detected on a laser scanner (Axon scanner) using a Cy3 (green) channel (excitation frequency 532 nm). Data for each cytokine was normalized to positive controls on the same slide to estimate relative protein expression. Each monoculture or direct coculture was analyzed in duplicate.
2.3.8. Western Blot
31
Blots were rewashed, and detection was by enhanced chemiluminescence western blotting detection system (Amersham-GE Healthscience). Relative MET and HGF protein concentration was quantified using Image J software, with pixel intensity of the MET or HGF protein band divided by pixel intensity of the β-actin band. Fold-change expression was calculated by dividing the coculture expression by the monoculture expression at that same time point.
2.3.9. qPCR for MET and HGF
The relative abundances of HGF (Hs00300159_m1 Cat. # 4331182) and MET (Hs01565584_m1 Cat. # 4331182) mRNA were quantified by qPCR using an ABI 7900HT machine (Life Technologies, Carlsbad, CA). mRNA was isolated from cells using Qiagen’s RNeasy mini kit and protocols (Qiagen, Valencia, CA). 1 μg of total RNA was reverse transcribed into cDNA using the iScript cDNA synthesis kit and protocol from Bio-Rad. The cDNA was then diluted five-fold by the addition of 80 μl of water. Subsequently, 2 μl of cDNA and 18 μl of master mix 10 μl SsoFast 2X Probes Supermix (Bio-Rad), 0.5 μl 18S-VIC and 0.5 μl gene specific Assay-On-Demand-FAM (ABI), 7 μl water were used in each well of the qPCR 96-well plate. Amplification conditions were as follows: 1 cycle of 95C for 1 minute; 40 cycles of 95C for 5 seconds, 60C for 20 seconds.
2.3.10. Generation of coculture-derived HGF signature.
32
both HGF-treated and fibroblast-cocultured cell lines were normalized to sham monocultures (monocultures in serum free media with no rhHGF and monocultures in regular media) by subtracting the log2(R/G) values of the monoculture. The resulting log2(R/G) ratio represents the response to coculture or treatment relative to that of sham. To identify genes that were differentially regulated by both coculture and HGF treatment, a one class SAM analysis was performed with all HGF-treated and cocultured arrays first normalized to sham monocultures. Functional and pathway analyses of the resulting gene signatures were performed using Ingenuity Pathway Analysis (IPA), with significant functions and pathways defined as those with P values less than 0.05 after Benjamini– Hochberg multiple testing correction.
2.3.11. Correlation with HGF signature in human tumors
We evaluated the behavior of our HGF Signature (described above) in 707 breast cancer samples from three publically available datasets: 1) NKI295 (N=295) [88], 2) Naderi et al. (N=135) [89] and 3) UNC337 samples (N=277) [2]. Intrinsic subtype classification
33
HGF-negative). All statistical analyses were performed using R 1.14 and Bioconductor packages.
2.3.12. Migration/Wound assays
Migration/wound assays were performed in six-well plates. 1:1 ratios of epithelial and RMFs were seeded in direct cocultures for 48 hours prior to performing the scratch. Epithelial cells were stained for better visualization using 5 μmol/L of Invitrogen (Life technologies) Cell Tracker (Green CMFDA) following the manufacturers protocol and as previously described in [5]. A scratch was made with a pipette tip and allowed to close for 6 hours. Phase and green fluorescent pictures were taken at 0 and 6 hours with an Olympus IX70 at 4X magnification. Image J was used to quantify percent wound closure by measuring the area free of cells at 0 hours and at 6 hours.
2.3.13. 3D Morphogenesis assay
3D cocultures were performed as previously described in [90, 91]. A model system similar to that of Jedeszko et al. was used; however our RMF lines are not engineered to overexpress HGF [92]. Briefly, a 1:3 ratio of epithelial:RMF cells were cocultured in a 3D extracellular scaffold composed of a 1:1 mixture of biologically derived collagen I and Matrigel® (BD Biosciences). The final concentration of Collagen I was 1 mg/mL. One well from a 24 well plate was prepped for coculture by coating with 500 μL of Matrigel-collagen mix. Then, 1 mL of cell suspension in Martrigel-collagen mix was plated. Cultures were maintained in a humidified, 37ºC, 5% CO2 incubator for two weeks, with media change
34
The Matrigel-collagen embedded 3D structures were fixed after 2 weeks using 4% paraformaldehyde (USB) overnight. Fixed cultures were then cryopreserved in 20% sucrose in 0.1 M phosphate buffer at 4°C and washed before embedding and freezing in optimal cutting temperature compound (Tissue-tek 4538). Frozen sections (6 µm) were cut for immunohistochemistry using a Leica 1950 cryostat. For immunostaining, slides were brought to room temperature, hydrated and placed in Citrate buffer pH 6.0 (Thermo-Fisher TA135-HBH). Heat-induced epitope retrieval (HIER) was performed using a decloaking chamber (Biocare Medical) at 95°C for 5 minutes followed by 90°C for 10 seconds. Slides were cooled for 20 minutes, washed in Tris-buffer (0.05M pH 7.6) and blocked in 10% Normal Goat Serum (NGS) in Tris for 1 hour at room temperature. Samples were incubated overnight at 4°C in Mouse monoclonal Smooth Muscle Actin (Dako M085; 1:100) and Rabbit polyclonal Cytokeratin (Dako Z0622; 1:100). After rinsing, slides were incubated at room temperature for 3 hours in a mixture containing Goat anti-Mouse (Alexafluor 568, Invitrogen A21134; 1:400) and Goat anti-Rabbit (Alexafluor 488, Invitrogen A11008; 1:400) antibody. Slides were washed and coverslipped with Fluorogel II containing DAPI (EM Sciences). For hematoxylin and eosin stain (H&E), frozen sections were stained 1 minute in acidified Harris Hematoxylin (Thermo Scientific 6765003), rinsed in running tap water for 4 minutes, stained 3 minutes in alcoholic Eosin Y (Thermo Scientific 6766007), dehydrated in 95% alcohol for 2 minutes and 5 minutes in absolute alcohol, cleared in Xylene for 6 minutes and coverslipped with DPX mountant. Phase and fluorescent images were obtained using an Olympus IX-81 microscope at 10X magnification.
35
for lumen (present or absent) and to confirm epithelial cell identity of acinar cells. Each structure was visualized and classified as “with lumen” if there was a clear open space within the center of the structure, “no lumen” if the lumen was filled by cells or cellular debris. For lumen and apoptosis, 30-35 acinar structures were analyzed per condition.
Lumen size and total acinar size were also measured by a method based on optical coherence tomography (OCT). Imaging of the 3D cultures was performed using a custom, ultrahigh-resolution, spectral-domain optical coherence tomography (SD-OCT) system as previously described in [90]. The OCT image stacks were resampled into an isotropic pixel resolution of 1.55 µm after correcting for the refractive index of the aqueous gels, and displayed in a “hot” color map using MATLAB® (2011a, MathWorks). From color mapped OCT images, cell clusters resembling acini were selected based on their ‘spherical’ shape. The OCT image containing the central position of each acinus was determined by sifting through the OCT image-stack to find the image with the largest acinus size. The overall acinus area and acinus lumen area were each characterized from these central OCT image slices using ImageJ. The mean acini area and mean lumen area were calculated for each gel. A total of 50-60 acinar structures were analyzed per condition.
2.3.14. Statistical analysis
36
2.4. Results
2.4.1. The MCF10A series acquire “Basal-like microenvironment” characteristics
at DCIS stage
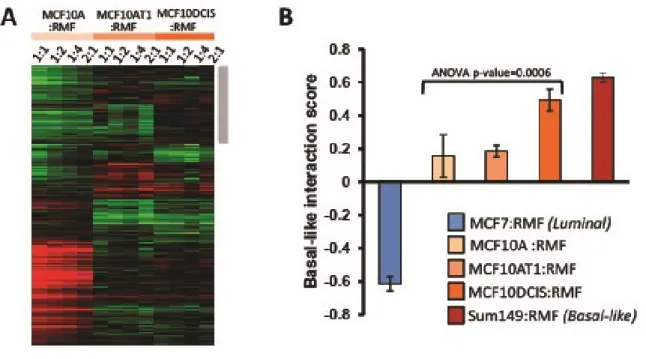
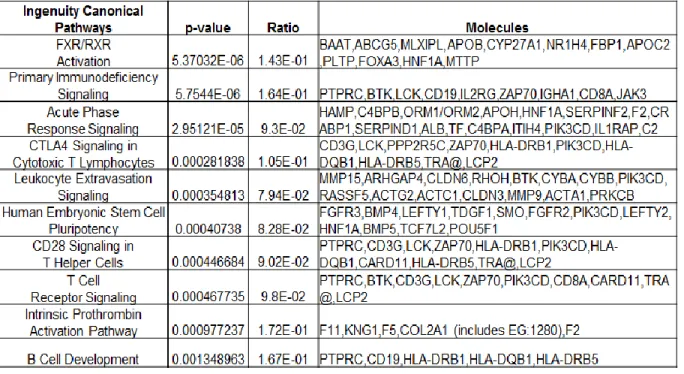
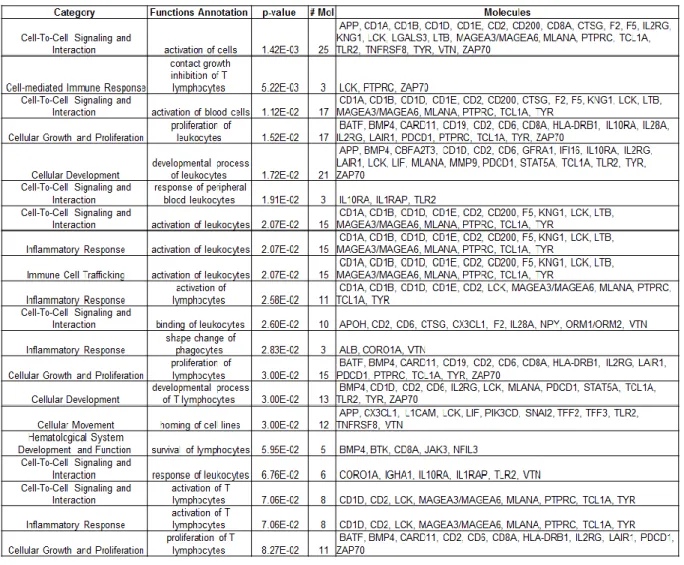
Each cell line in the MCF10 isogenic panel had a distinct response to coculture with reduction mammoplasty fibroblasts (RMF). By multiclass SAM (significant analysis of microarrays) we identified approximately 700 genes as differentially expressed across these three cell lines (Figure 2.2 A). One set of genes was particularly upregulated in MCF10DCIS cells, and not in MCF10A or MCF10AT cells (grey bar in Figure 2.2 A). This cluster of genes was analyzed by Ingenuity Pathway Analysis (IPA) (Tables 2.1 and 2.2) and results suggest immune response processes and connective tissue disorders, such as immune cell trafficking (p-value=0.021), cell mediated immune response (p-value=0.005) acute phase response signaling value<0.001) or cell mediated immune response (p-value=0.005). Many of these processes were also upregulated in invasive Basal-like breast
cancers in direct cocultures [5].
37
the same trend as observed in direct cocultures, although the strength of the Basal-like score was attenuated. This attenuation was expected based on dilution and diffusion requirements in indirect coculture; signals from the fibroblasts are diluted in large volumes of media, whereas direct coculture reduces the dependence on diffusion kinetics and protein stability. While neither direct nor interaction cocultures simulate the inhibitory effects of basement membrane on cellular signaling, direct cocultures offer important advantages to address cell-cell signaling, particularly when considering effectors with short half-lives. Thus, all coculture data are from direct cocultures unless otherwise stated.
2.4.2. Upregulation of secreted cytokines in MCF10DCIS-fibroblast cocultures.
Having established that Basal-like microenvironments are induced by soluble factors, we sought to identify the secreted mediators. Eighty cytokines and chemokines were measured in the conditioned media of the direct cocultures. A striking increase in the number of cytokines expressed occurred in the MCF10DCIS cocultures, with a total of 62 cytokines upregulated by more than 1.5-fold. In contrast, MCF10A and MCF10AT cocultures each upregulated only a small number of cytokines (Table 2.3; A full list of cytokines and their fold-change relative to monoculture is provided in Table 2.4). The most highly upregulated cytokine in DCIS cocultures was hepatocyte growth factor (HGF), which increased monotonically from MCF10A to MCF10AT1 to MCF10DCIS and was upregulated more than 80-fold in MCF10DCIS and 70-fold in MCF10AT1 direct cocultures (Figure 2.4. A).
38
by the fibroblasts. The epithelial cells had no detectable levels of transcript or protein in the monoculture; however, in coculture some HGF protein was observed in the epithelial cells, presumably due to internalization of the receptor-ligand complex. HGF secretion and activation is part of a complex cascade that regulates the actions of HGF. Consistent with previously published results [94], we found HAI-1 differentially expressed in our heatmap from Figure 2.2. A. HAI-1 inhibits the activity of HGF-activator thereby inhibiting the activation and subsequent activity of HGF. HAI-1 was found in higher levels in the MCF10A cocultures, accounting for different levels of HGF observed between MCF10A and MCF10DCIS in our cytokine arrays (which are presumed to measure active HGF).
HGF is the major ligand for the MET tyrosine kinase receptor and is also a negative regulator of MET transcription [95]. To evaluate whether MET is present in these cell lines, and whether MET levels are differentially regulated in coculture conditions, we assayed expression of this receptor in the MCF10 series, alone and in coculture over the course of 48 hours. Both at the RNA (Figure 2.5. B) and the protein level (Figure 2.5. C), we observed that contact with fibroblasts (6 hours) induced the MCF10DCIS cells to markedly upregulate MET RNA. Peak RNA induction at 6 hours is followed by peak protein expression at 12 hours. This effect was not observed (in MCF10A) or markedly diminished (in MCF10AT1) in the other two cell lines of the series. Thus, the interaction of MCF10DCIS cells with RMF in coculture stimulates an increase in HGF secretion and a concomitant increase in epithelial HGF receptor, MET, expression.
2.4.3. An HGF gene signature correlates with Basal-like tumors
39
breast cancers. To assess this hypothesis, we generated an in vitro HGF signature. We identified gene expression changes that occurred in both (1) MCF10DCIS monocultures treated with rhHGF and (2) cocultures of MCF10DCIS with RMFs. These HGF-regulated genes are most likely to be effecting the action of HGF on Met in coculture. IPA analysis of the HGF signature suggested Sonic Hedgehog Signaling (p-value=0.007), Basal Cell Carcinoma Signaling (p-value=0.017), Tight Junction Signaling (p-value=0.020) among other signaling pathways were upregulated by HGF signaling in cocultures. Using this signature we scored 707 invasive tumors from three independent data sets as having a high or low correlation with this HGF signature. Figure 2.6.A shows that 86% of the aggressive Basal-like tumors in these data sets are positively correlated with the HGF signature, whereas only 23.6% of the Luminal A tumors present a positive association. Additionally, 40% of Her2-like and 36% of Luminal B tumors, both of which are more aggressive than Luminal A tumors, were positively associated with the HGF signature (p-value<2.2e-16). Furthermore, among Basal-like patients that are positive for the HGF
signature, patients had worse overall survival (Figure 2.6.C). These results emphasize the importance of HGF signaling in aggressive breast cancer. While our coculture results show that HGF signaling is already present at the DCIS stage, the importance of this pathway in survival illustrates that the dysregulation of the HGF pathway persists in invasive Basal-like tumors and contributes to their progression.
2.4.4. Blocking of HGF inhibits three dimensional phenotypes
40
over-represented among invasive Basal-like tumors and is predictive of overall survival, we used HGF-targeted antibodies to study the role of HGF in Basal-like interaction score and functional morphogenic coculture assays. First, MCF10DCIS:RMF cocultures were incubated for 36 hours to allow for epithelial-stromal interactions to occur, and for the last 12 hours anti-HGF antibody was added every 2 hours. In Figure 2.7.A we observe a decrease in the Basal-like interaction score due to anti-HGF treatment. While there is variation (due to random or other unexplained causes) in the time course data such that 4, 8 or 12 h after exposure have Basal-like interaction scores ranging from negative to slightly positive, it is clear that at all three time points the score is dramatically reduced.
41
two techniques 1) longitudinal Optical Coherence Tomography (OCT) imaging at two time points (one week and two weeks) and 2) traditional H&E and IF staining at two weeks.
To track the morphogenesis of these cell lines over time, we used OCT. as we have previously found that OCT imaging allows for longitudinal 3D in vitro imaging without disruption of the acinar structures [101]. In addition, with these images we can estimate the size of the acinar structures and their lumens. After counting 50 structures per condition, we observed no overall difference in the size of MCF10DCIS cocultures with and without anti-HGF antibody treatment. However, blocking HGF resulted in a statistically significant decrease in lumen size (p-value=0.017, Figure 2.7.B). The MCF10DCIS cocultures treated with the anti-HGF antibody bore a greater resemblance to the non-malignant MCF10A (Figure 2.9). As shown in Figure 2.7.B, the number of structures without a lumen is high in MCF10A cocultures, and similar in the MCF10DCIS cocultures treated with anti-HGF, whereas the untreated MCF10DCIS cocultures have progressed to form a lumen (Table 2.5; p-value=0.0007). These differences cannot be attributable to differences in proliferation rates of the cell lines, because the population doubling times (PDT) of MCF10A and MCF10DCIS with RMF are very similar (29.7 vs. 30.8 hours, respectively).
42
resemble the less malignant cells (MCF10A), thereby blocking a microenvironment-mediated increase in malignant potential.
2.5. Discussion
Breast cancer progression requires that epithelial cells acquire capabilities that enhance their growth and survival. While biological models of cancer have traditionally emphasized cell-autonomous characteristics, it is clear that changes in the microenvironment are also necessary [6]. Castro et al. demonstrated that the stroma of DCIS lesions already possess alterations found in full invasive tumors [102], Ma et al. and Allinen et al. demonstrated that genomic changes occur in many cell populations of the microenvironment [14, 76]. These models explicitly hypothesize that epithelial cells must undergo an evolutionary adaptation to their microenvironments [8, 13, 103]. Other models propose that the microenvironment is the driving force of the benign lesion evolution into full invasive tumors; Gatenby and Gillies even speculate that the origin of cancer may lie not in mutations within epithelial cells but within acquired or somatic mutations changes in the mesenchymal cells that control tissue structure [104]. While our data do not support these latter models, our data do suggest that progression is not isolated to a single compartment (the epithelium), but rather reflective of epithelium-stroma co-evolution. Heterotypic interactions between epithelium and stroma foster this co-evolution by selecting for complementary phenotypes in stroma and epithelium.
43
striking upregulation of HGF was evident early in progression (at the atypical hyperplasia stage), but was not sufficient to induce the characteristic Basal-like stromal-interaction phenotype. MET must also be expressed, and at the DCIS stage MET was upregulated with drastic consequences on the behavior of the epithelial cells: MCF10DCIS cells expressed high Basal-like interaction scores and an associated ability to progress in morphogenesis assays. Similarly increased malignant potential has been observed in xenograft models with MCF10DCIS, which also preserve stromal interactions [105, 106]. The importance of the HGF pathway was further documented in our system by blocking HGF signaling with an antibody, resulting in reversal of expression and morphologic phenotypes. In fact, this latter experimental work underscores an advantage of our in vitro coculture system: in studying cancer evolution using this cell line panel, pathways can be manipulated and direct causal effects can be examined. We were also able to separately assay both epithelial and stromal characteristics and show complementary changes. Epithelial cells upregulate the MET receptor only at the DCIS stage, despite HGF expression by all cocultured fibroblasts. While other studies have reported HGF expression by the epithelial cells [107, 108], these studies utilize different cell line models of progression and we did not observe a similar autocrine pathway of HGF-MET interaction in our studies. The previous studies focused on cell line models of metastatic progression, so perhaps our focus on pre-invasive stages of disease also accounts for some differences between findings. It is interesting to consider that by later stages of progression, this pathway may develop autocrine capability. By studying the interactions and the relative contributions of each component at different stages of progression, we can better understand how stroma and epithelium are co-evolving.
44
HGF/MET signaling with poor outcome in invasive breast cancers [111]. Several recent publications have demonstrated the importance of HGF/MET signaling and the microenvironment in melanoma treatment-resistance [112, 113]. Our data, using a novel HGF signature and three independent tumor datasets, indicate that HGF/MET signaling is highly correlated with Basal-like breast cancer subtype and worse overall survival in patients. Mouse models with over expression of MET induce Basal-like tumors with signatures of WNT and epithelial to mesenchymal transition (EMT) [114], suggesting that this pathway’s importance in tumor biology is conserved across species. In normal tissue, HGF is produced by stromal fibroblasts and acts as a mitogen, motogen and morphogen on MET-expressing epithelial cells [115]. MET is a tyrosine kinase receptor that, when activated by its ligand (HGF), auto-phosphorylates and initiates an intracellular signaling cascade that involves many targets. In the developing mammary duct, deletion of epithelial MET inhibits ductal branching [116] and in adult glands, HGF is critical for tubulogenesis [117]. Thus, the HGF/MET pathway is an essential player in normal development and wound healing [118, 119]. Given the high expression of wound response genes in the tissue adjacent to cancer [73] and the important role of HGF in normal ductal morphogenesis and invasive breast cancer, a better understanding of HGF/MET in progression of Basal-like breast cancers is important.
45
complementary in vitro models is helpful. These coculture models advance our understanding of the reciprocal molecular changes in the pre-invasive stages of breast cancer and can guide research on tissue.
46
2.6. Figure and Tables
47
![Table 1.2: Whole genome microarray studies to investigate breast cancer tumor microenvironment in vitro Authors [citation] Cancer cell lines used Stromal cell lines used Type of coculture Special separation techniques Linked to human in vivo data](https://thumb-us.123doks.com/thumbv2/123dok_us/8279410.2192619/33.918.135.848.108.1083/microarray-investigate-microenvironment-citation-coculture-special-separation-techniques.webp)