ADVANCED SYSTEM COMPONENTS FOR THE DEVELOPMENT OF A HANDHELD ION TRAP MASS SPECTROMETER
Kevin Philip Schultze
A dissertation submitted to the faculty at the University of North Carolina at Chapel Hill in partial fulfillment of the requirements for the degree of Doctor of Philosophy in the Department
of Chemistry.
Chapel Hill 2014
ii © 2014
iii ABSTRACT
Kevin Philip Schultze: Advanced System Components for the Development of a Handheld Ion Trap Mass Spectrometer
(Under the direction of J. Michael Ramsey)
This work describes the development and implementation of system components
utilized in a handheld ion trap mass spectrometer (MS). Current state-of-the-art portable
mass spectrometers fall in the 30 to 40 lb. range due to their large and heavy vacuum
systems. The strategy used in this work to create lighter, handheld instruments is to
eliminate much of the vacuum pumping requirements by operating the entire instrument
under 1 Torr of background pressure, i.e. 3 orders of magnitude higher than conventional
instruments. Reducing the ion trap size by a factor of 20 and operating these miniature traps
at increased RF drive frequencies compensates for the ions’ reduced mean free path, making
mass analysis possible at these elevated pressures.
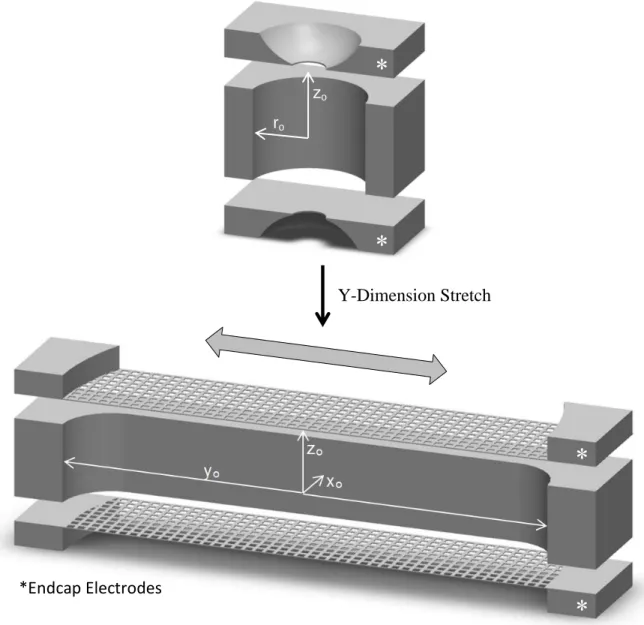
The first component developed was a novel ion trap geometry. The design is a
modification of the cylindrical ion trap (CIT), using three electrodes to produce an elongated
two-dimensional trapping region capped by planar mesh electrode features on each end. The
SLIT’s increased dimensionality led to a tenfold increase in sensitivity versus a CIT with the
same critical dimensions while maintaining identical resolution. This 5 mm long SLIT with
critical dimensions xo = 500 µm and zo = 650 µm represents the smallest linear type ion trap
iv
operation in pressures exceeding 1 Torr of helium, nitrogen, and air buffer gasses also
represents the highest pressure operation reported for linear ion traps.
Ion detection at elevated pressures was achieved using a Faraday cup and charge
sensitive amplifier. Mass spectra were collected using both a commercial amplifier and two
custom made amplifiers. The smaller of the two custom Faraday cup amplifiers was
incorporated into a miniature vacuum chamber along with the SLIT mass analyzer and glow
discharge ion source. The operation of this MS system is the first reported miniature
instrument operated without the use of turbomolecular vacuum pumps, and can in fact be
operated with only a simple miniaturized roughing pump. Incorporating the miniature
chamber, pump, and a custom miniature RF system, a prototype MS was developed weighing
2 lbs. and drawing 8.2 W.
Finally, gas chromatography - mass spectrometry (GC-MS) experiments were carried
out utilizing the newly developed miniature MS instrumentation with a full size GC to
demonstrate the feasibility of a future handheld GC-MS device. Detection of a variety of
organic analytes during 2.5 minute separations was demonstrated in both helium and nitrogen
v
TABLE OF CONTENTS
LIST OF FIGURES ... ix
LIST OF ABBREVIATIONS AND SYMBOLS ... xiv
CHAPTER 1: MINIATURIZING MASS SPECTROMETERS AND THE QUADRUPOLE ION TRAP ...1
Introduction ...1
1.1 Miniaturization of Common Mass Analyzers ...2
Sector Analyzers ...3
Time-of-Flight...4
Ion Cyclotron Resonance ...5
Linear Quadruopoles ...5
Quadrupole Ion Traps ...7
1.2 The Quadrupole Ion Trap: Theory and Operation ...8
Qualitative Description of QIT Trapping ...8
Mathematical Treatment of QIT Operation ...9
Motion of Trapped Ions in the QIT...13
Higher Order Fields ...14
The QIT as a Mass Spectrometer ...15
1.3 Miniature Ion Traps and High Pressure Operation ...17
The Cylindrical Ion Trap ...17
vi
High Pressure Operation of CITs ...21
1.4 Figures ...23
1.5 References ...28
CHAPTER 2: THE STRETCHED LENGTH ION TRAP ...33
Introduction ...33
2.1 Concept ...35
2.2 General Operation ...37
Instrumentation ...37
Initial SLIT Construction and Performance ...39
Performance Improvements and Comparison to CIT ...42
High Pressure SLIT Operation ...44
2.3 Alternative SLIT Configurations and Tolerance Studies ...48
SLIT Arrays and Serpentine Traps ...48
SLIT Tolerance Considerations ...50
Ion Ejection Profiling ...52
2.4 Conclusions ...56
2.5 Figures ...58
2.6 References ...82
CHAPTER 3: FARADAY CUP SYSTEMS FOR ION DETECTION AT HIGH PRESSURES ...84
Introduction ...84
3.1 Feasibility of Faraday Cups as Ion Trap Detectors ...85
Custom CTIA Faraday Cup Amplifier ...86
vii
3.2 High Pressure Faraday Cup Operation ...90
Performance of a Miniaturized Faraday Cup Amplifier ...90
Signal Dependence on FC Distance and Bias ...92
3.3 Faraday Cup Application: Study of Convective Flow Through Ion Traps ...93
3.4 Conclusions ...95
3.5 Figures ...97
3.6 References ...108
CHAPTER 4: DEVELOPMENT OF A MINIATURIZED PROTOTYPE MASS SPECTROMETER ...109
Introduction ...109
4.1 Description of Miniaturized Vacuum Chamber ...110
Glow Discharge Ion Source ...111
Sample and Buffer Gas Inlet ...112
Ion Trap Related Hardware ...113
Detector Modules ...114
4.2 Demonstration of Miniaturized Vacuum Chamber Operation ...116
4.3 Miniaturized Prototype Mass Spectrometer ...117
4.4 Conclusions ...118
4.5 Figures ...119
4.6 References ...129
CHAPTER 5: HIGH PRESSURE MASS SPECTROMETRY DETECTION FOR GAS CHROMATOGRAPHY ...131
Introduction ...131
viii
5.2 GC-MS Operation with Electron Multiplier Detection ...136
Initial Proof of Concept GC-MS Experiments...137
GC-MS Improvements ...138
5.3 GC-MS Operation with Faraday Cup Detection ...139
Faraday Cup versus Electron Multiplier for GC-MS Detection ...140
GC-MS with Helium Buffer Gas ...140
5.4 Sensitivity and LOD Determination for GC-MS ...142
Signal to Noise Ration and MS Averaging ...142
Sensitivity versus Ionization ...143
Linear Dynamic Range of GC-MS System ...144
5.5 Conclusions ...145
5.6 Figures ...146
ix
LIST OF FIGURES
Figure 1.1: Diagrams of several different mass analyzers that have been
subject to miniaturization ...23
Figure 1.2: A 3D exploded view and 2D cross section of a quadrupole ion
trap showing the hyperbolic ring and endcap electrodes ...24
Figure 1.3: Mathieu regions of stability for an ideal 3D quadrupolar field ...25
Figure 1.4: A zoomed in view of the principal region of stability near the
origin in which all ion traps operate with iso-beta lines shown ...26
Figure 1.5: Field lines from an ideal quadrupolar field formed by hyperbolic electrodes shown in comparison to those resulting from the
cylindrical ion trap geometry ...27
Figure 2.1: Graphical depictions comparing the linear ion trap and rectilinear
ion traps ...58
Figure 2.2: Graphical depiction of the formation of the stretched length ion
trap ...59
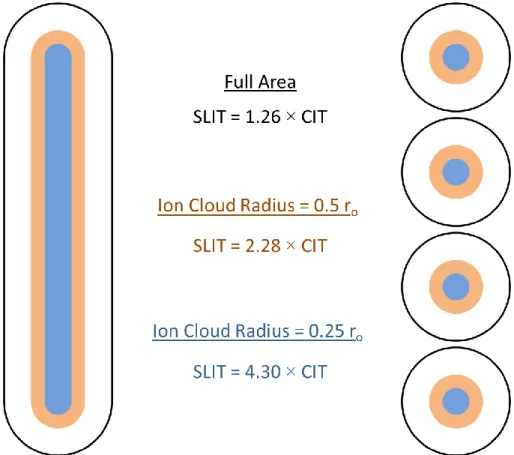
Figure 2.3: Graphical depiction of the increased ion trapping efficiency of
the SLIT vs. a CIT array of equal footprint ...60
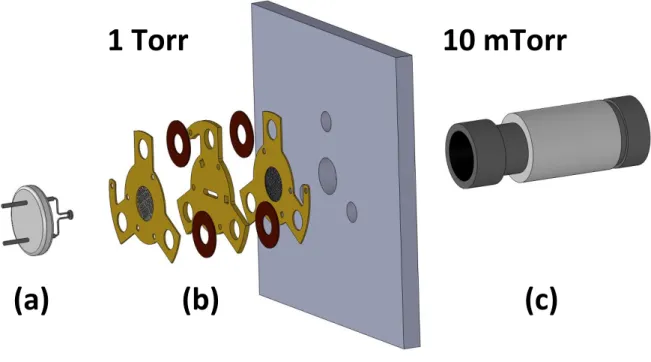
Figure 2.4: An exploded view of the differential pressure chamber used to
conduct the SLIT testing ...61
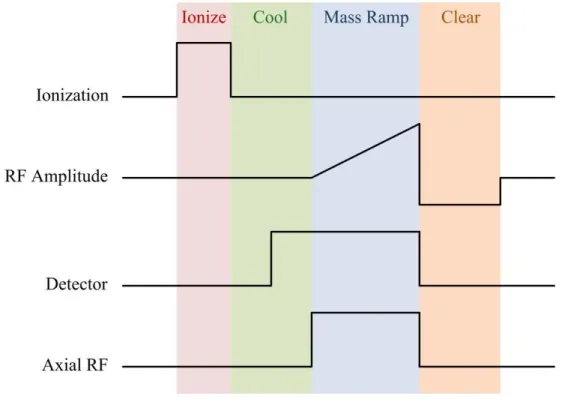
Figure 2.5: Timing diagram of a typical MS experiment showing the four
phases of operation and associated control signal changes with time ...62
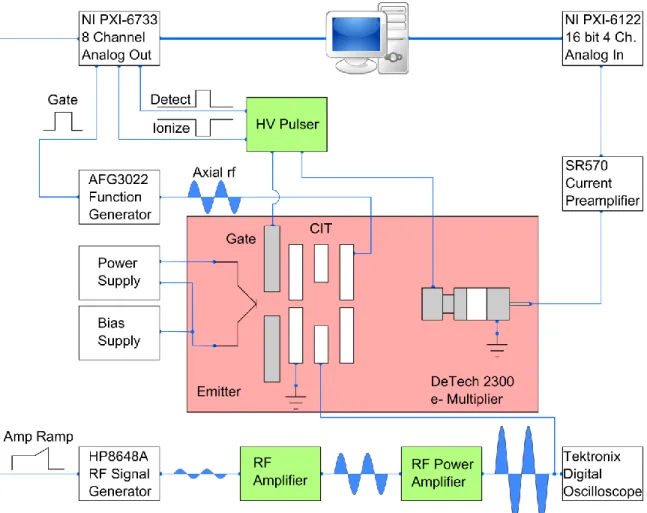
Figure 2.6: Complete control diagram of the instrument used ...63
Figure 2.7: Photographs of early versions of the beryllium copper endcap electrodes and SLIT copper ring electrode along with picture of
constructed trap ...64
Figure 2.8: Spectra of 0.055 mTorr xenon gas in 10 mTorr helium buffer gas taken using an RF frequency of 6.4 MHz and SLIT’s with
zo/ro ratios of 1.03, 1.20, and 1.27 ...65
Figure 2.9: An example spectrum of an organic analyte, methyl salicylate, compared to its NIST standard spectrum taken with the highest
x
Figure 2.10: Plot of integrated signal intensity for 0.15 mTorr xenon in 10 mTorr helium vs SLIT length (2yo) showing a roughly linear
increase ...67
Figure 2.11: Images of SLIT ring electrodes at 100X magnification fabricated via manual machining (a), CNC machining (b), and
wet chemical etching ...68
Figure 2.12: Photograph of a constructed second-generation SLIT
incorporating the improved CNC milled ring electrode and the flat,
electroformed copper mesh ...69
Figure 2.13: Spectra comparing the resolution between a CNC machined
SLIT and CIT ...70
Figure 2.14: Calibration curves comparing the sensitivity of a CNC
machined SLIT and CIT ...71
Figure 2.15: Spectra of xenon taken with increasing helium buffer gas
pressures ...72
Figure 2.16: Mass spectra of mesitylene demonstrating SLIT
performance at elevated pressures of nitrogen buffer gas ...73
Figure 2.17: Proof of concept spectra for two alternative SLIT geometries
pictured, SLIT arrays and serpentine traps ...74
Figure 2.18: Experimental setup and resulting data showing ion travel in
a serpentine geometry ion trap ...75
Figure 2.19: Spectra demonstrating ion ejection variation across a three
SLIT element array of differing zo values ...76
Figure 2.20: A summary of the single SLIT element tolerance study showing xenon spectra generated from both parallel and slanted
endcap electrodes ...77
Figure 2.21: A simplified mechanical drawing of the SLIT profiling apparatus for low buffer gas pressures showing the setup’s moving
parts ...78
Figure 2.22: Photographs of the SLIT profiling setup ...79
Figure 2.23: An example of xenon ion ejection profiles from a conventional SLIT geometry and one in which the geometry has been modified to
xi
Figure 2.24: Ion ejection and ion storage profiles obtained from a tapered
SLIT ...81
Figure 3.1: Simplified schematic of the isobaric vacuum chamber apparatus
used for Faraday cup characterization ...97
Figure 3.2: A photograph of the custom CTIA detector inside the metal
shielding box and electrical diagram ...98
Figure 3.3: Spectra generated from detection of 5.9 × 10⁻⁵ Torr xenon detected with a 19 element CIT array and 2.6 × 10⁻⁵ Torr xenon
detected with a single element SLIT ...99
Figure 3.4: A simplified electrical schematic of the A250CF CoolFET
charge sensitive preamplifier ...100
Figure 3.5: Direct comparison of xenon spectra taken in 30 mTorr helium
with three different detectors ...101
Figure 3.6: Photograph comparing the size of the commercial CoolFET
amplifier to the miniaturized version, the DA-4 ...102
Figure 3.7: Spectra demonstrating Faraday cup detection of various
benzene analogs in 1 Torr nitrogen buffer gas ...103
Figure 3.8: Spectra directly comparing CIT and SLIT arrays of equal
footprint...104
Figure 3.9: Graph plotting integrated signal intensity for detection of
1 ppm toluene in nitrogen versus Faraday cup - ion trap distance ...105
Figure 3.10: Simplified schematic diagram of the vacuum chamber used
to vary the amount of gas flow through the ion ...106
Figure 3.11: Experimental and simulations data demonstrating the rise in signal intensity upon introduction of gas flow through a
microscale ion trap ...107
Figure 4.1: Constructed and exploded views of the modular miniature
vacuum chamber showing the three major components ...119
Figure 4.2: Sectioned view of the miniature chamber, photograph of the
constructed chamber, and photograph of glow discharge operation...120
Figure 4.3: Images of the two methods of buffer gas and sample
xii
Figure 4.4: Images showing the detail of trap module construction ...122
Figure 4.5: Graphic renderings of the various ion detector modules ...123
Figure 4.6: Spectra of o-xylene taken at increasing RF frequencies using the miniature vacuum chamber with DA-4 based Faraday cup
detection ...124
Figure 4.7: Comparison of o-xylene spectra taken using the miniaturized vacuum chamber with the electron multiplier and Faraday cup
(DA-4) modules ...125
Figure 4.8: The layout of the miniature RF amplification system ...126
Figure 4.9: Photograph of the miniature prototype with the major
components marked ...127
Figure 4.10: Mass spectrum of ambiently sampled mesitylene taken
using the miniature prototype mass spectrometer ...128
Figure 5.1: Schematic diagram of the GC and GC-MS used to compare
the experimental µMS detectors and the commercial FID detector ...146
Figure 5.2: Images of the heated µMS transfer line ...147
Figure 5.3: Chromatographic separations of six benzene analogs comparing the performance of the commercial FID detector to
that of a µMS detector using an electron multiplier ...148
Figure 5.4: Selected mass spectra from the same GC-MS chromatogram
presented in Figure 5.3 ...149
Figure 5.5: GC detector comparison with an improved separation of 15
organic compounds ...150
Figure 5.6: Two distinct mass spectra from different sections of the same
GC peak ...151
Figure 5.7: Comparison of a Faraday cup based GC-MS detector to that
of an EM based GC-MS detector and a FID GC detector ...152
Figure 5.8: Comparison of GC-MS chromatograms taken under 1 Torr N2
buffer gas conditions with those taken under 1 and 2 Torr He buffer
xiii
Figure 5.9: Plot of S/N ratio versus number of MS scans averaged for a
single GC-MS data set ...154
Figure 5.10: Calibration curve of GC-MS detection of aniline using several
glow discharge ionization conditions ...155
Figure 5.11: Log-log plots of the calibration curve data from Figure 5.10 ...156
Figure 5.12: High resolution GC-MS chromatogram taken with a FC based
xiv
LIST OF ABBREVIATIONS AND SYMBOLS
” inch
°C degrees Celcius
2D two dimensional
3D three dimensional
A Amp
AC alternating current
AGC automatic gain control
a.u. arbitrary units
CIT cylindrical ion trap
CITSIM cylindrical ion trap simulator
cm centimeter
CNC computer numerical control
CTIA capacitive transimpedance amplifier
DA-4 detector amplifier 4
DAQ data acquisition
xv
DMMP dimethyl methylphosphanate
EI electron impact ionization
EM electron multiplier
FC Faraday cup
FET field effect transistor
fF femptoFarad
FID flame ionization detector
FT-ICR Fourier transform ion cyclotron resonance
FWHM full width at half max
g gram
GC gas chromatography/chromatograph
GC-MS gas chromatography - mass spectrometry
GD glow discharge
GPU graphics processing unit
H2 hydrogen gas
He helium
xvi
Hz Hertz
IC integrated circuit
I.D. inner diameter
IMS ion mobility spectrometry
in. inch
KE kinetic energy
kg kilogram
kHz kiloHertz
lbs. pounds
LDR linear dynamic range
LIT linear ion trap
LOD limit of detection
µm micometer/micron
µs microsecond
µV microVolt
m meter
xvii
MEMS microelectromechanical system
MES methyl salicylate
MHz megaHertz
min minute
mL milliliter
mm millimeter
MOSFET metal oxide semiconductor field effect transistor
MS mass spectrometry
ms millisecond
MS/MS tandem mass spectrometry
mTorr milliTorr
mW milliWatt
N2 nitrogen gas
nA nanoAmp
ng nanogram
ns nanosecond
xviii
O.D. outer diameter
PEEK polyether ether ketone
pF picoFarad
ppb part per billion
ppm parts per million
QIT quadrupole ion trap
R2 coefficient of determination
ro inscribed radius of a QIT
RAM random-access memory
RF radio frequency (3 kHz – 300 GHz)
RGA residual gas analyzer
RIT rectilinear ion trap
RSD relative standard deviation
s second
sccm standard cubic centimeter per minute
SLIT stretched length ion trap
xix
S/N signal to noise ratio
SWaP size weight and power consumption
Th Thompson (a unit equal to 1 Da/elementary charge)
TOF time-of-flight mass analyzer
Torr unit of pressure where 760 Torr = 1 atmosphere
UNF unified screw thread
V Volt
W Watt
Xe xenon
1
CHAPTER 1: MINIATURIZING MASS SPECTROMETERS AND THE QUADRUPOLE ION TRAP
Introduction
Mass spectrometry (MS) has long been among the most informative of analytical
techniques. Due to its distinctive capability to selectively detect a large variety of analytes
with both speed and sensitivity, MS has found wide-ranging applications in areas such as
trace elemental analysis, biomolecule characterization in highly complex samples, and
isotope ratio determination.1 However, the large size, weight, and power consumption (SWaP) inherent to nearly all MS systems generally confines their use to laboratory settings
rather than in-field analyses. Whether it is the rapid detection necessary for security
applications or in situ analysis required for environmental studies, there exist many
applications in which it is necessary or at least desirable to make these chemical
measurements directly in the field. To meet this need, several successful efforts have gone
into miniaturizing equipment for field work utilizing other analytical techniques such as ion
mobility spectrometry (IMS) and Raman spectroscopy.2 However, none of the current hand-portable instrumentation can offer the combination of speed, selectivity, and sensitivity
that is possible with MS, and the fact that these instruments have found wide use despite their
shortfalls is illustrative of the large impact that a hand portable mass spectrometer would
have.
Not surprisingly, many efforts over several decades have been targeted at achieving
2
Attempts to miniaturize each of the common types of mass analyzers have been carried out
and a historical treatment of these efforts will be the focus of Section 1.1. Of particular
interest in the field of miniature mass spectrometry is the quadruple ion trap (QIT) for which
a detailed explanation of its operation will be given in Section1.2. And finally, a description
of the current state of the art in microscale ion traps and our laboratory’s focus on their
operation at high pressures will be described in the final section of this chapter.
1.1 Miniaturization of Common Mass Analyzers
All mass spectrometers consist of three core components: an ion source, a mass
analyzer, and a detector. In addition, they also include several peripheral systems such as the
control electronics, vacuum system, and data collection system. Upon initial examination
one might not consider the miniaturization of the mass analyzer to be a vital step in the
shrinking of the overall system since in many instances, the mass analyzer represents only a
small portion of the instrument’s total size and/or weight. However, reducing the mass
analyzer dimensions can impact the SWaP of the peripheral systems in a number of ways.
First, since all mass analyzers utilize electric fields in some manner to guide and separate
ions, lower voltages can be used to create the same field strengths at smaller dimensions,
leading to lower power electronics. Additionally, as the mass analyzer shrinks, so does the
required mean free path for ion-neutral collisions. This reduced mean free path leads to
higher allowable pressures and thus reduced vacuum requirements for all types of mass
spectrometers, albeit to varying degrees. Since the vacuum system is almost always the
largest contribution to a portable instrument’s size and weight, significantly reducing the
3 Sector Analyzers
The magnetic sector was one of the first mass analyzers to receive significant
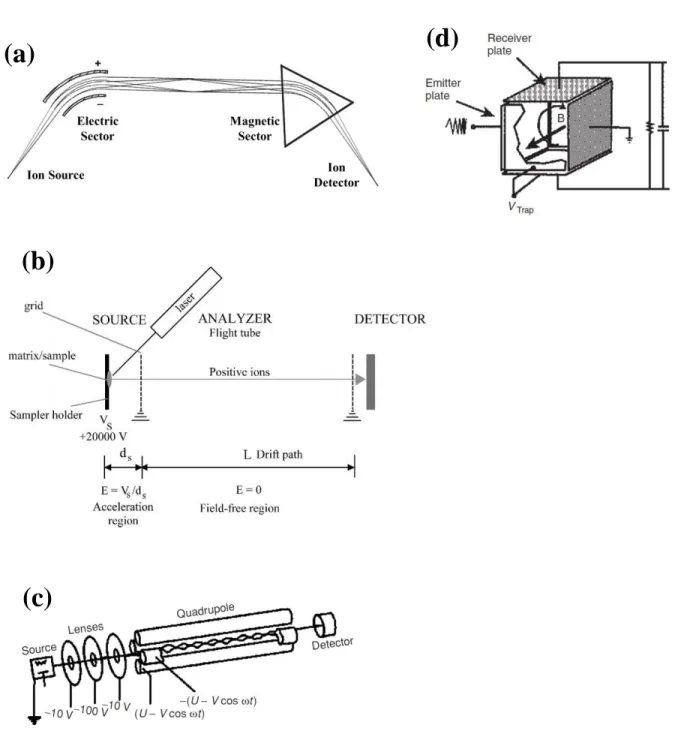
miniaturization efforts due to its long history and wide use in the field of mass spectrometry.3 The sector MS is a ‘beam type’ instrument in which an ion beam is controlled and separated
by means of a magnetic, and often an electric sector. (Figure 1.1a) Acting as a deterrent for
miniaturization, sectors are larger than most other mass spectrometers due to the large and
heavy magnetic and electric sectors employed. They also require comparatively strict
vacuum requirements, typically 10-6 Torr or lower . Offsetting some of these challenges to miniaturization is the fact that unlike other mass analyzers, sectors can employ exclusively
static fields, as in the Mattauch-Herzog geometry.4 This property reduces both power draw and complexity, aiding in the miniaturization of the electronics package. In addition,
miniaturization facilitates the use of small permanent magnets that draw no power at all.
Taking advantage of the ability of the Mattauch-Herzog geometry’s high MS
acquisition rate resulting from simultaneous detection of all ions at the array detector, Sinha
et al. developed an early miniaturized sector MS to interface with a fast gas chromatography
(GC) separation.5 This instrument, based on a permanent magnet greater than 10 kg with a 12.7 cm detection plane was able to successfully detect fast eluting peaks of 200-300 ms
from a microbore GC column. Other efforts have gone into packaging a sector of an
alternative geometry into a portable, suitcase sized instrument able to detect a wide variety of
organic compounds at a resolving power around 150.6 The weight and power consumption of 20 kg and 30 W respectively, while impressive for the time period, comes at the cost of
very low throughput and limited run times. Previously, even miniaturized sectors still had
4
been used to create a 2 cm radius miniature sector with crossed electric and magnetic fields
which achieve a resolving power of 106.7 Time-of-Flight
Time-of-flight (TOF) instruments are the most conceptually simple mass
spectrometers consisting of an acceleration region where all ions are accelerated to the same
kinetic energy (KE), a field free drift region where the ions are separated by flight time, and a
high bandwidth ion detector. (Figure 1.1b) Compared to the sector MS, the TOF mass
analyzer is typically much lighter in weight while the control electronics remain
straightforward and draw little power. Challenges to the miniaturization of TOFs include
their similar vacuum requirements to sector instruments as well as the fact that their resolving
power is directly related to flight tube length. However, the precise control of ion kinetic
energies achievable with simple electrode geometries can yield miniaturized TOF analyzers
with resolution comparable to many benchtop mass spectrometers.
By far the largest TOF miniaturization effort has been conducted in the lab of Dr.
Robert Cotter with their ‘Tiny TOF’ project yielding several successful instruments over the
years.8-10 This research has progressed in stages, starting with a modest reduction of the flight tube length from the common 1-1.5 m to 20 cm8 and finishing with their smallest sized TOF with a flight tube of 5 cm.9 Their instrument has been targeted towards biological samples and has a reported resolving power of 330. Knowledge gained from this work was
later used in the development of a suitcase sized TOF MS directed towards first responders.10 Another interesting application for miniaturized TOFs is in space exploration where the
5
ablation TOF analyzer has been developed by Riedo et al. The prototype system conducts
elemental analyses of solid samples at a resolving power of up to 600.11 Ion Cyclotron Resonance
When assessing mass analyzers for miniaturization, Fourier Transform Ion Cyclotron
Resonance (FT-ICR) mass spectrometry is possibly the least suited for such an endeavor.
FT-ICR instruments are both the largest of the conventional mass spectrometers due to the
size of the superconducting magnets required as well as having pressure requirements of
several orders of magnitude lower than sector or TOF analyzers. Large mean free paths are
needed to provide adequate time to measure the ions’ cyclotron resonant frequencies, and
thus their mass to charge ratios, within the magnetic and electric trapping fields. (Figure
1.1c) However, FT-ICR instruments routinely achieve resolving powers well into the
millions, making them the highest resolution instruments available. These characteristic
advantages and disadvantages remain upon miniaturization of the FT-ICR, with Dietrich et
al. developing a large suitcase sized instrument with a resolving power of 1000.12-13 This lone example of FT-ICR miniaturization still represents the highest mass resolution obtained
in miniaturized instruments, although significantly reducing its size much further seems
unlikely.
Linear Quadrupoles
Operating in the 10-4 – 10-5 Torr pressure range, the linear quadrupole is relatively pressure tolerant when compared to the previously discussed mass analyzers, and again, even
higher pressures are achieved as the ion path length is reduced in miniaturized instruments.
6
each pair creating a time varying quadrupolar field between the four rods. (Figure 1.1d)
These voltages are set such that only a narrow range of mass to charge values are passed
through the rods to the detector at a time, and a linked scan of the RF and DC voltages
produces the full mass spectrum. There exist two primary challenges towards the
miniaturizing of the linear quadrupole. The first challenge, having to do with the power
requirements of the large RF voltages, scales favorably with miniaturization as discussed
previously. The second challenge is that machining and alignment tolerances for the rods are
tight enough to pose a manufacturing challenge even for full size instruments. However,
microfabrication and next generation manufacturing techniques such as 3D printing show
promise in overcoming this limitation as well. As such, the miniaturization of the linear
quadrupole has been relatively successful, even finding commercial success as residual gas
analyzers (RGA).
Full-scale linear quadrupole rods ca. 20 cm in length and 10 mm in diameter can be
significantly reduced in size using conventional machining or high precision techniques such
as electrical discharge machining, without sacrificing much in the way of overall
performance. Research along these lines at Inficon, a gas analysis company, has led to a
RGA as small as 1.27 cm long with an inscribed radius, ro, of 0.33 mm.14 The resolution of
this device, ~0.9 Th, was found to be relatively constant even up to pressures of 10 mTorr
(~250 times higher pressure than full-scale linear quadrupoles). However, typical of linear
quadrupoles, sensitivity was reduced at higher pressures (~50% reduction at 2-3 mTorr)
caused by ions being lost before reaching the detector due to scattering collisions with the
7
Microfabrication techniques are also being utilized in linear quadrupole construction
to maintain dimensional tolerances as analyzer sizes are pushed ever smaller. As an example,
Taylor et al. fabricated a device using 30 mm long, 0.5 mm diameter metallized glass fibers
mounted on a microfabricated silicon support for alignment.15 While this device resulted in only modest resolution, it likely merits further study due to the precision and scalable
manufacturing potential of microfabricated devices. Also of note when moving to such
small dimensions, ion throughput and thus sensitivity can be compromised. To ameliorate
this trend, arrays of many linear quadrupoles have been operated in parallel, theoretically
increasing the device sensitivity linearly with each set added.16 This is a strategy we will see repeated with miniaturized quadrupole ion traps.
Quadrupole Ion Traps
While the quadrupole ion trap (QIT) has a shorter history, not becoming a viable
mass analyzer until the mid-1980s, they represent the bulk of the research into miniaturized
MS instruments due to their relatively small size, less stringent dimensional tolerances, and
most importantly, pressure tolerance. An in-depth overview of this research on miniature ion
traps and their operation at elevated pressures can be found in Section 1.3. However, as the
remainder of this dissertation deals exclusively with the quadrupolar ion trap, a detailed
description of its invention, development, and theory of operation will first be given in
8
1.2 The Quadrupole Ion Trap: Theory and Operation
Qualitative Description of QIT Trapping
Based on initial work by Penning,17 the first ion trapping devices employed a magnetic field trapping charged species in circular orbits while a cylindrically symmetric
quadrupolar electric field formed a potential well in the axial dimension. This configuration
has the limitation that it must be operated under high vacuum conditions, and as such,
continues to find use only in FT-ICR instruments.
Confinement of ions in the absence of a magnetic field was first reported by Paul and
Steinwedel18 and was achieved simply by oscillating the quadrupolar electric field of the Penning trap. Because the field strength increases with the square of the distance from the
center of the trap, where its value is zero, the net impulse over a single oscillation of the field
on an ion is non-zero. Put more simply, an ion will be forced a distance towards the center of
the trap during the attractive half of the cycle and repelled another distance during the
repulsive half. Because the ion is closer to the trap’s center during the repulsive half, the
average repulsive force will be weaker than the original attractive force resulting in a net
movement of the ion towards the trap’s center. The fact that the field is axially attractive
while being radially repulsive and vice versa is of no consequence, as over a period of
oscillation a net focusing impulse is achieved in both directions.
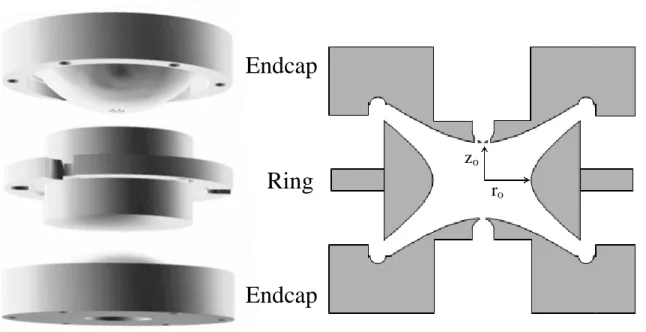
To achieve this cylindrically symmetric quadrupolar field, electrodes are constructed
along isopotential lines. This configuration yields three electrodes with hyperbolic surfaces
consisting of two endcap electrodes with a ‘ring’ electrode sandwiched between them (Figure
9
ring electrode, ro, and the shortest distance from the center to the endcaps, zo. To form an
ideal quadrupolar field, a ratio or ro2 = 2zo2 is required.
Mathematical Treatment of QIT Operation
Several detailed descriptions of the theory of ion motion in a QIT have been
previously presented,19-22 and the reader is directed to these for reference beyond the overview provided here. In a purely quadrupolar field, the potential, ϕx,y,z, at any point
varies quadratically with distance from the origin and can be written in its most simple form
as
ϕx,y,z = A(λx2+ σy2+ γz2) + C (1.1)
where A is a non-zero term including the electric potential applied between the electrodes, C
is a fixed potential applied to the whole system, and λ, σ, and γ are weighting constants
applied to the x, y, and z coordinates, respectively. It can be seen that there are no cross
terms (e.g. xy terms) which has the important implication that the force and thus ion motion
in each coordinate direction can be treated independently. As with all electric fields with
zero volume charge density, it is necessary for the Laplace condition to be met where the
second partial differential of the potential at any point must be equal to zero.
∇2ϕ =∂2ϕ
∂x2 +
∂2ϕ
∂y2 +
∂2ϕ
∂z2 = 0
(1.2)
From which Eq. (1.2) becomes
∇2ϕ = A(2λ + 2σ + 2γ) = 0 (1.3)
10
λ + σ + γ = 0 (1.4)
Because the QIT is cylindrically symmetric about the z-axis, λ and σ must be equal leading
to the simplest values for all three coefficients as
λ = σ = 1; γ = −2 (1.5)
Substituting these values into Eq. (1.1) and converting to cylindrical coordinates yields
ϕr,z = A(r2− 2z2) + C (1.6)
We now evaluate the general coefficients A and C in terms of the potential within the actual
ion trapping electrodes. First we define ϕo as the potential applied between the ring
electrode and endcaps. Combination of the cases ϕro,0 and ϕ0,zo leads to the expression
ϕo= A(ro2+ 2z
o2) (1.7)
Thus solving for A and substituting into Eq. (1.6) yields
ϕr,z =
ϕo(r2− 2z2)
(ro2+ 2zo2) + C
(1.8)
The easiest and most common way to operate a QIT is to apply the desired potential to the
ring electrode and ground the endcaps. Thus we can use the fact that ϕ0,zois equal to zero to
solve for the final coefficient C and substitute back into Eq. (1.8) yielding
ϕr,z =
ϕo(r2 − 2z2)
(ro2+ 2zo2) +
2ϕozo2
(ro2+ 2zo2)
(1.9)
As noted in the qualitative QIT description, the applied potential, ϕo, is oscillating. In
addition, there can also be a DC component applied in series to the ring electrode resulting in
11
ϕo= (U + V cos Ωt) (1.10)
where V is the maximum AC voltage amplitude, U is the DC voltage amplitude, t is time, and
Ω is the angular frequency of the AC voltage. Upon substitution into Eq. (1.9) we arrive at
the full equation for the potential inside a QIT as conventionally operated
ϕr,z =
(U + V cos Ωt)(r2− 2z2)
(ro2+ 2zo2) +
2(U + V cos Ωt)zo2
(ro2+ 2zo2)
(1.11)
Recalling that forces in each coordinate direction can be treated independently, we will start
with the z dimension. Combining the Lorentz force law for charged particles and Newton’s
second law we can write the expression for the force on an ion, Fz, of mass m and charge e as
Fz= −e (
dϕ dz) = e
4(U + V cos Ωt)z
(ro2+ 2zo2) = m (
d2z
dt2)
(1.12)
The expression for Fr is identical with the exception of the -2:1 relationship given by the
Laplace condition earlier, representative of the fact that the force on an ion is attractive
towards the origin in the z direction while being repulsive in the r dimension and vice versa.
The final equality above represents the differential equation of ion motion in a QIT.
Fortunately, a solution to this form of differential equation was determined by Mathieu in
1868 from his study of vibrating stretched skins.23 When Eq. (1.12) is rewritten and expanded as shown below,
(d2z
dt2) + [−
4eU m(ro2+ 2z
o 2)−
4eV cos Ωt m(ro2+ 2z
o
2)] z = 0
(1.13)
it becomes evident that this is a special form of the Mathieu equation as shown below in its
12 d2u
dξ2 + (au− 2qucos 2ξ)u = 0
(1.14)
Where u is a displacement; ξ is a parameter equal to Ωt/2 in this case; and a and q are
dimensionless parameters which in the special case of the QIT are known as “trapping
parameters.” A detailed walkthrough of the transformations made to yield the expressions
for the trapping parameters can be found here,19 but for the purposes of this description they will simply be given as
az= −
16eU m(ro2+ 2z
o2)Ω2
(1.15)
and
qz=
8eV m(ro2+ 2zo2)Ω2
(1.16)
Again, the expressions for ar and qr are identical after accounting for the -2:1 ratio. The
parameters auand qu are seen to be of particular interest as they are functions not only of an
ion’s mass to charge ratio, but of all the relevant instrumental parameters. Thorough
examination of the solutions to the Mathieu equations as they relate to the QIT, again shown
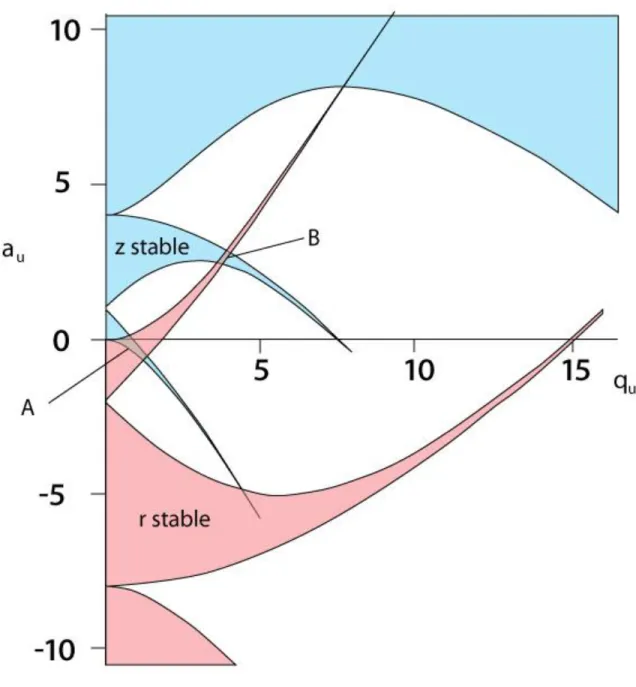
in detail elsewhere,19 reveal several regions in the a-q space where ion motion is stable and periodic. Figure 1.3 shows both the r-stable regions (upward pointing) and the z-stable
regions (downward pointing). An ion which resides in one of the several overlapping regions
will undergo stable motion in both dimensions and will thus remain trapped. The practically
useful region of ion stability near the a-q origin is shown in Figure 1.4. The regions of
stability are bound by lines corresponding to the β parameter equal to 0 and 1 for the r and z
13 Motion of Trapped Ions in the QIT
There remain a few aspects of ion motion in the QIT left to consider. Recall from the
qualitative description that for each RF cycle, a net force acts upon the ion toward the trap’s
center. The aggregate of these forces can be accurately modeled as the ion residing in a
parabolic pseudopotential well in which the ion undergoes stable simple harmonic motion.
The frequency of this motion can be expressed by a new trapping parameter, βu, which is a
complex function of a and q given by the continued fraction
βu2 = a u+
q2u
(βu+ 2)2− a
u− qu
2
(βu+ 4)2 − au− qu
2
(βu+ 6)2− au− ⋯
+ qu
2
(βu− 2)2− au− qu
2
(βu− 4)2 − au− qu
2
(βu− 6)2− au− ⋯
(1.17)
While this is straightforward to solve computationally, Hans Dehmelt, who shared the 1989
Nobel Prize in Physics with Paul for the development of the QIT, developed an
approximation valid for qz << 1 shown below.21
βz2 ≅ az+
q2z
2
(1.18)
This equation was verified experimentally to be valid within 1% for qz < 0.4 by Wuerker et
al.22 Owing to β being a dimensionless frequency, it can be converted to an ion’s real fundamental frequency of motion within a QIT which we will refer to as the ion’s secular
14 ωz=
βz Ω 2
(1.19)
Because β varies between 0 and 1 for a trapped ion, we can see that an ion’s secular
frequency of motion can vary between zero and half the RF drive frequency depending on
the trapping parameters. Again turning to the theory of the simple harmonic oscillator, the
depth of the pseudopotential well, Dz, can be derived24 to be
Dz= eV2 4mzo2Ω2 =
qzV 8
(1.20)
for the ideal case of ro2 = 2zo2.
Higher Order Fields
To this point, the discussion of the QIT has assumed a perfect cylindrically symmetric
quadrupolar field. In practice however, truncated hyperbolic electrodes, holes for ion
injection/ejection, and machining tolerances produce deviations from the ideal. A more
general approach to solving Laplace’s equation for a system with axial symmetry is given
here,25 the result of which yields an expanded equation for the potential in the ion trap.
ϕr,z = ϕo(A0+ A1
z ro+ A2
r2− 2z2
2ro2 + A3
3r2z − 2z3
2ro3
+ A4
3r4− 24r2z2+ 8z4
8ro4 + A5
15r4z − 40r2z3 + 8z5
8ro5 … )
(1.21)
where the coefficients A0, A1, A2, A3, A4, etc. are the weighting factors given to the monopole,
dipole, quadrupole, hexapole, octopole, etc. components respectively. For an ideal
15
of Eq. 1.8 derived earlier. In a real trap, the coefficients change based on the geometrical
imperfections introduced.
Inspection of Eq. 1.21 reveals several ‘cross terms’ in the higher order field
components. This has the important consequence that we can no longer consider the motions
in the r and z dimensions as strictly uncoupled in a real world device. However, due to the
higher order nature of these fields, the quadrupolar field remains dominant near the center of
the trap. This becomes an important point when performing mass spectrometry with a QIT.
The QIT as a Mass Spectrometer
Considering the substantial academic and commercial success of the QIT, it is
somewhat surprising that it took 30 years after the initial invention of the QIT for it to find
wide use as a mass spectrometer. Following the initial report18 and patent26 by Paul, the QIT was used primarily by physicists to study fundamental ion properties and ion-neutral
interactions. During this period there were some initial attempts to use the new device as a
MS starting with the realization by Dawson and Whetten that ions could be ejected through
holes drilled in the endcaps and detected with an electron multiplier.27-28 This same work pioneered the use of mass selective storage to generate mass spectra. This method sets the
RF and DC values so that a single mass to charge ratio (m/z) is trapped at the apex of the a-q
stability diagram before being ejected by a DC pulse on an endcap. This process is repeated
for each m/z generating the full mass spectrum. While this was an important step in QIT
development, this method offered little advantage over the already prevalent linear
16
The QIT remained relatively obscure as a mass analyzer until the early 1980s when
George Stafford conceived of a novel method of mass analysis, leading to the successful
commercialization of the QIT by the Finnigan Corporation.29 This method of mass analysis, known as the mass selective instability scan, traps ions using only an RF voltage so that all
the ions exist on the az = 0 axis in descending order of m/z. The RF amplitude is then
ramped linearly causing each ion’s qz to increase as per Eq. 1.16 until it reaches the stability
boundary at qz = 0.908, upon which it will be ejected from the trap in the z direction. In this
manner, ions are ejected in order of m/z from low to high values. While this method of
generating mass spectra worked comparatively well, two more important contributions came
out of Finnigan’s research before a successful commercial instrument was realized.
Even the most pressure tolerant instruments at that time saw deterioration in
performance when background pressures increased much above 10-5 Torr, and the same was also expected of the QIT. However, because the goal of Finnigan’s QIT project was to
produce an inexpensive GC-MS detector, the QIT’s performance was evaluated at increasing
helium pressures. Unexpectedly, upon introduction of ca. 1 mTorr of He background gas,
both the resolution and sensitivity were drastically improved. It was eventually realized that
the many ion collisions with the He buffer gas reduced the kinetic energy of the ions,
‘cooling’ them into a very small area in the center of the trap. From here, the ions could be
ejected far more efficiently out of the endcap to the detector. Additionally, with the ions
cooled very near the center of the trap where the quadrupolar term dominates, any effects of
higher order fields from non-ideal electrodes are largely mitigated. This leads to alignment
and machining tolerances being much less stringent than in the closely related linear
17
Even with buffer gas cooling effects, the Finnigan researchers found that large field
deviations from the endcap holes and truncated electrodes caused unpredictable mass shifts
for certain ions. An evaluation of the possible effects of higher order fields on mass analysis
led them to try increasing the ring-endcap distances symmetrically, introducing even term
(octopolar, dodecapolar, etc) higher order fields. They found that a 10.4% stretch in the z
dimension adequately compensated for the inherent electrode non-idealities and solved the
mass shift problem. Most of the QITs today still feature this type of modification.
This final breakthrough allowed for the successful commercialization of the QIT as
both a GC-MS instrument (1984) and a standalone research instrument (1985) with both
using the now standard trap size of ro = 1 cm. No longer being limited to a few
instrumentation labs, research into applications and development of the QIT exploded. Its
ruggedness, low cost, ability to interface with multiple ion sources, and ability to perform
multiple stages of mass spectrometry (MS/MS) efficiently has secured its place as a
workhorse MS even today.
1.3 Miniature Ion Traps and High Pressure Operation
As stated in Section 1.1, ion trapping instruments have received the most attention in
terms of miniaturized MS. This section covers the benefits and challenges of using ion traps
as miniature mass analyzers as well as some of the strategies to overcome some of these
challenges.
The Cylindrical Ion Trap
A major challenge when miniaturizing the QIT is maintaining adequate tolerances for
18
recently developed additive manufacturing techniques32 have been utilized to recreate hyperbolic trap surfaces at ro around 2 mm, representing a 5x decrease in size from the
conventional QIT. This however appears to be near the current limit in the ability to create
these precisely shaped electrodes. In response, much work has gone into the development of
a simplified geometry in which flat surfaces are used for the endcap electrodes and a straight
cylindrical surface is used as the ring electrode as shown in Figure 1.5b. This cylindrical ion
trap (CIT) is far easier to manufacture by both conventional and microfabrication techniques
down to scales that are several orders of magnitude smaller than the conventional QIT.
The CIT was patented by Langmuir et al. as a simple ion storage device in 1962,33 which of course predated the mass selective instability mode of operation. It took until 1998
for the use of a CIT as a mass analyzer to be explored.34 In this work, a ‘full size’ CIT of ro = 1 cm was used to generate mass spectra with better than unit mass resolution and an
upper mass limit of 600 Th, which is comparable in performance to a QIT with hyperbolic
electrodes. As shown in Figure 1.5, the quadrupolar field of the QIT is well approximated by
the CIT in the center of the trap where the ions reside. This allows the CIT to be operated in
exactly the same manner as the QIT without much loss in performance. Building on
information learned from the initial CIT work, the Cooks group from Purdue University soon
after developed an entire miniaturized MS system based on a 1/4 scale CIT (ro = 2.5 mm). 35-36
Performance was adequate with resolving power of ~100 and a 250 Th mass limit, even
employing a membrane inlet system for atmospheric sampling. This initial system was
relatively large at 55 kg including a 20 kg battery but represented an important first step
19
These initial results spawned several subsequent generations of miniature trapping
instruments, culminating in the ‘Mini 10’ instrument weighing in at 10 kg and drawing 70 W
of power.37 The group was able to maintain performance in terms of mass resolution and range while iteratively reducing the size of the various instrumental components with each
generation. This approach to miniaturization, consisting of starting with a laboratory scale
instrument and systematically reducing component size while retaining performance, has
been termed the “top-down approach.”38 Microscale Cylindrical Ion Traps
The top-down approach to miniaturizing instruments has the major benefit of
retaining much of the performance of their benchtop counterparts, but this high performance
typically accompanies higher costs and lower durability. For these reasons, high performing
portable instruments such as these have yet to find their way into general use. The
alternative, deemed the “bottom-up approach” to miniaturization, starts with a microscale
mass analyzer and designs the system around this element. This method seeks to produce
smaller instruments of modest performance while taking advantage of the inherent low cost
of microfabricated devices. The end goal is a low cost, durable, hand-portable device that
can bring mass spectrometry into a variety of new fields.
The research into microscale CITs has varied in scale considerably from ro values in
the 500 µm range39-43 that can be made with conventional machining or microfabrication, down to the tens of microns and below44-46 which can require advanced microfabrication techniques. The first attempt at operating a CIT with critical dimensions below 1 mm was by
20
requisite endcap and ring electrode holes were separated by insulating sheets to maintain
electrical isolation and achieve proper electrode spacing.39 Using this same trap, they also described a method of double resonance ejection which improved signal intensity and
resolution in microscale traps.40 It had long been useful to interact with and even eject trapped ions by employing an AC signal on the endcaps at the ion’s secular frequency,47 but Ramsey et al. demonstrated improved performance by setting this frequency to a non-linear
resonance of the trap, taking advantage of the increased presence of higher order fields.
An obvious consequence of smaller CITs is that they hold fewer ions, leading to poor
sensitivity. In fact, simulations predict that once ro values reach ca. 1 µm, this capacity falls
to a single ion.45 However, utilizing arrays of many CITs operated in parallel, one can gain back this sensitivity and even hold more ions than a single trap occupying the same footprint.
Geometrically, when ro is reduced by a factor of n, it is possible to fit 2n traps in the same
footprint. Additionally, it has been simulated that the number of ions a trap can hold scales
with rox with x = 1.55 (and even lower as the drive frequency is increased).48 This results in a
net increase in ions stored in a given footprint as the trap size is reduced but comes with the
caveat that to maintain resolution all traps must be made identical to tight tolerances. This
concept has been utilized in microfabricated trap arrays of 256 and 2304 elements, each of
which is a CIT with ro = 20 µm.44 The mass spectrum of xenon shown, while modest in
resolution, represents the operation of the smallest mass analyzer to date. Blain et al. utilized
state of the art microfabrication techniques to construct CIT arrays with ro = 1, 2, 5, and
10 µm but several issues including high device capacitance and exposed dielectric material
21
the theoretical requirements for operation at atmospheric pressure, and therefore successful
operation at this scale is a future goal of the field.
High Pressure Operation of CITs
As mentioned earlier, operation at higher vacuum pressures, allowing the elimination
of heavy and power hungry vacuum pumps, is vital for the development of a hand-held mass
spectrometer. Because ion traps already operate at background pressures several orders of
magnitude higher than other mass analyzers, they have the greatest potential for achieving
small handheld size. Several theoretical papers have explored CIT operation at elevated
pressures.49-50 Out of this work, a simple relationship between pressure, P; drive frequency, Ω; and resolution, Δm/m of
Δm
m ∝
P Ω
(1.22)
The equation above shows peak widths in the mass spectrum increase linearly with pressure
while raising the drive frequency has the opposite effect. This relationship is qualitatively
reasonable; the increased number of ion-neutral collisions when the pressure is raised starts
to compete with the electric field for control of ion motion leading to wider MS peaks. On
the other hand, increasing the frequency along with the pressure so that the number of
collisions per RF cycle stays relatively constant keeps the ion motion RF-dominated, leaving
the resolution unchanged.
To date, there has been little reported in the way of experimental verification of the
above relationship, save for one study that evaluated performance of an ion trap up to
22
widths of about 2 Th at 50 mTorr were used to model the predicted peak widths at 250 mTorr
as ca. 10 Th. Mass spectrometry at 1 Torr background pressures represents a reasonable
benchmark for developing a device with small, lightweight pumps, but it is clear that a mass
analyzer with this pressure dependence would be quite useless with peak widths near 40 Th
at this pressure.
However, there are several reasons to have optimism in the face of this study. First, it
is unclear how the authors determined the pressure inside the MS as there was only indirect
measurement and back-calculations of pressures are very dependent on the assumptions
made. More importantly, the trap used was relatively large (critical dimensions near 4 mm)
and was operated using a low RF frequency of 1.08 MHz. From Eq. 1.22, we know that
increasing the RF frequency will reduce peak widths. However, the RF voltage requirements
scale with Ω2
as seen in Eq. 1.16, necessitating a corresponding decrease in trap dimensions
to keep the voltages in an attainable range. This relationship between RF drive frequency,
pressure, and trap size outlines a clear path towards MS instrumentation capable of operation
under ever lower vacuum conditions. The goal of our laboratory is to utilize small, high
23 1.4 Figures
Figure 1.1: Diagrams of several different mass analyzers that have been subject to
miniaturization efforts including (a) sector, (b) time-of-flight, (c) linear quadrupole, and (d) ion cyclotron resonance mass analyzers. Reproduced with permission from Mass
Spetrometry Principles and Applications by de Hoffmann and Stroobant, Wiley and Sons, 2007.1
(a)
(b)
(c)
24
Figure 1.2: A 3D exploded view (left) and 2D cross section (right) of a quadrupole ion trap showing the hyperbolic ring and endcap electrodes. Spacing and alignment is typically achieved via precision ceramic spacers (not shown).
Endcap
zo
ro
25
26
Figure 1.4: A zoomed in view of the principal region of stability near the origin in which all ion traps operate with iso-beta lines shown in light blue. Green circles represent ions of different masses lying along the az = 0 line corresponding to the normal RF only mode of
operation. Ions are scanned to higher qz values until they reach 0.908 at which point they
27
Figure 1.5: Field lines from an ideal quadrupolar field formed by (a) hyperbolic electrodes shown in comparison to (b) those resulting from the cylindrical ion trap geometry. This comparison illustrates that the CIT closely approximates a quadrupolar field near the center of the trap where the ions are held.
28 1.5 References
1. de Hoffmann, E.; Stroobant, V., Mass Spectrometry Principles and Applications. 3rd ed.; John Wiley & Sons: West Sussex, England, 2009; p 489.
2. Janasek, D.; Franzke, J.; Manz, A., Scaling and the design of miniaturized chemical-analysis systems. Nature 2006, 442 (7101), 374-380.
3. Badman, E. R.; Graham Cooks, R., Miniature mass analyzers. Journal of Mass Spectrometry 2000, 35 (6), 659-671.
4. Mattauch, J.; Herzog, R., Über einen neuen Massenspektrographen. Z. Physik A 1934,
89, 786-795.
5. Sinha, M. P.; Gutnikov, G., Development of a miniaturized gas chromatograph-mass spectrometer with a microbore capillary column and an array detector. Analytical Chemistry 1991, 63 (18), 2012-2016.
6. Kogan, V. T.; Pavlov, A. K.; Chichagov, Y. V.; Tubol'tsev, Y. V.; Gladkov, G. Y.; Kazanskii, A. D.; Nikolaev, V. A.; Pavlichkova, R., Design and testing of a portable magnetic mass spectrometer. Field Analytical Chemistry & Technology 1997, 1 (6), 331-342.
7. Diaz, J. A.; Giese, C. F.; Gentry, W. R., Sub-miniature ExB sector-field mass spectrometer. Journal of the American Society for Mass Spectrometry 2001, 12 (6), 619-632.
8. Bryden, W. A.; Benson, R. C.; Ecelberger, S. A.; Phillips, T. E.; Cotter, R. J.; Fenselau, C., The Tiny-TOF Mass-Spectrometer for Chemical and Biological Sensiing. Johns Hopkins APL Tech. Dig. 1995, 16 (3), 296-310.
9. Cotter, R. J.; Fancher, C.; Cornish, T. J., Miniaturized time-of-flight mass
spectrometer for peptide and oligonucleotide analysis. Journal of Mass Spectrometry
1999, 34 (12), 1368-1372.
10. Ecelberger, S. A.; Cornish, T. J.; Collins, B. F.; Lewis, D. L.; Bryden, W. A., Suitcase TOF: A Man-Portable Time-of-Flight Mass Spectrometer. Johns Hopkins APL Tech. Dig. 2004, 25, 14-19.
11. Riedo, A.; Bieler, A.; Neuland, M.; Tulej, M.; Wurz, P., Performance evaluation of a miniature laser ablation time-of-flight mass spectrometer designed for in situ
investigations in planetary space research. Journal of Mass Spectrometry 2013, 48
29
12. Dietrich, D. D.; Keville, R. F. Portable ion trap mass spectrometer for pollutant detection - has electron source, mass analyser and ion detector assembly combined into single device and mounted in hollow permanent magnet. U.S. 5,451,781 A, US5451781-A 19 Sep 1995 H01J-049/38 199543 Pages: 13, 1994.
13. Henry, C. M., Focus: The incredible shrinking mass spectrometers. Analytical Chemistry 1999, 71 (7), 264A-268A.
14. Holkeboer, D. H.; Karandy, T. L.; Currier, F. C.; Frees, L. C.; Ellefson, R. E., Miniature quadrupole residual gas analyzer for process monitoring at milliTorr pressures. Journal of Vacuum Science & Technology A 1998, 16 (3), 1157-1162.
15. Taylor, S.; Tunstall, J. J.; Leck, J. H.; Tindall, R. F.; Jullien, J. P.; Batey, J.; Syms, R. R. A.; Tate, T.; Ahmad, M. M., Performance improvements for a miniature
quadrupole with a micromachined mass filter. Vacuum 1999, 53 (1–2), 203-206.
16. Orient, O. J.; Chutjian, A.; Garkanian, V., Miniature, high-resolution, quadrupole mass-spectrometer array. Review of Scientific Instruments 1997, 68 (3), 1393-1397.
17. Penning, F. M., Glow discharge at low pressure between coaxial cylinders in an axial magnetic field. Physica 1936, 3 (9), 873-894.
18. Paul, W.; Steinwedel, H., A new mass spectrometer without a magnetic field. Z Naturforsch 1953, 8a, 448-450.
19. March, R. E., Quadrupole ion traps. Mass Spectrometry Reviews 2009, 28 (6), 961-989.
20. March, R. E., An Introduction to Quadrupole Ion Trap Mass Spectrometry. Journal of Mass Spectrometry 1997, 32 (4), 351-369.
21. Major, F. G.; Dehmelt, H. G., Exchange-Collision Technique for the rf Spectroscopy of Stored Ions. Physical Review 1968, 170 (1), 91-107.
22. Wuerker, R. F.; Shelton, H.; Langmuir, R. V., Electrodynamic Containment of Charged Particles. Journal of Applied Physics 1959, 30 (3), 342-349.
23. Mathieu, E., Mémoire sur le mouvement vibratoire d'une membrane de forme elliptique. J. Math. Pure Appl. 1868, 13, 137.
24. Todd, J. F. J.; Lawson, G.; Bonner, R. F., Quadrupole Mass Spectrometry and its Applications. Elsevier: 1976; p 181-224.
30
26. Paul, W.; Helmut, S. Apparatus for separating charged particles of different specific charges. U.S. Patent 2,939,952 A, 1960.
27. Dawson, P. H.; Whetten, N. R., Ion Storage in Three-Dimensional, Rotationally Symmetric, Quadrupole Fields. I. Theoretical Treatment. Journal of Vacuum Science & Technology 1968, 5 (1), 1-10.
28. Dawson, P. H.; Whetten, N. R., Ion Storage in Three-Dimensional, Rotationally Symmetric, Quadrupole Fields. II. A Sensitive Mass Spectrometer. Journal of Vacuum Science & Technology 1968, 5 (1), 11-18.
29. Syka, J. E. P., Chapter 4 - Commercialization of the Quadrupole Ion Trap. In
Practical Aspects of Ion Trap Mass Spectrometry, March, R. E.; Todd, J. F. J., Eds. CRC Press: 1995; Vol. 1, pp 169-205.
30. Kaiser Jr, R. E.; Graham Cooks, R.; Stafford Jr, G. C.; Syka, J. E. P.; Hemberger, P. H., Operation of a quadrupole ion trap mass spectrometer to achieve high
mass/charge ratios. International Journal of Mass Spectrometry and Ion Processes
1991, 106 (0), 79-115.
31. Lammert, S. A.; Rockwood, A. A.; Wang, M.; Lee, M. L.; Lee, E. D.; Tolley, S. E.; Oliphant, J. R.; Jones, J. L.; Waite, R. W., Miniature Toroidal Radio Frequency Ion Trap Mass Analyzer. Journal of the American Society for Mass Spectrometry 2006,
17 (7), 916-922.
32. Clare, A. T.; Gao, L.; Brkić, B.; Chalker, P. R.; Taylor, S., Linear Ion Trap Fabricated Using Rapid Manufacturing Technology. Journal of the American Society for Mass Spectrometry 2010, 21 (2), 317-322.
33. Haywood, S.; Langmuir, D. B.; Langmuir, R. V.; Wuerker, R. F. Containment device. U.S. Patent 3,065,640, 1962.
34. Wells, J. M.; Badman, E. R.; Cooks, R. G., A Quadrupole Ion Trap with Cylindrical Geometry Operated in the Mass-Selective Instability Mode. Analytical Chemistry
1998, 70 (3), 438-444.
35. Patterson, G. E.; Guymon, A. J.; Riter, L. S.; Everly, M.; Griep-Raming, J.; Laughlin, B. C.; Zheng, O.; Cooks, R. G., Miniature Cylindrical Ion Trap Mass Spectrometer.
Anal. Chem. 2002, 74 (24), 6145-6153.
36. Riter, L. S.; Peng, Y.; Noll, R. J.; Patterson, G. E.; Aggerholm, T.; Cooks, R. G., Analytical Performance of a Miniature Cylindrical Ion Trap Mass Spectrometer.
Analytical Chemistry 2002, 74 (24), 6154-6162.
31
38. Ouyang, Z.; Gao, L.; Fico, M.; Chappell, W. J.; Noll, R. J.; Cooks, R. G., Quadrupole ion traps and trap arrays: geometry, material, scale, performance. Eur. J. Mass
Spectrom. 2007, 13 (1), 13-18.
39. Kornienko, O.; Reilly, P. T. A.; Whitten, W. B.; Ramsey, J. M., Micro ion trap mass spectrometry. Rapid Communications in Mass Spectrometry 1999, 13 (1), 50-53.
40. Moxom, J.; Reilly, P. T. A.; Whitten, W. B.; Ramsey, J. M., Double resonance ejection in a micro ion trap mass spectrometer. Rapid Communications in Mass Spectrometry 2002, 16 (8), 755-760.
41. Moxom, J.; Reilly, P. T. A.; Whitten, W. B.; Ramsey, J. M., Analysis of Volatile Organic Compounds in Air with a Micro Ion Trap Mass Analyzer. Analytical Chemistry 2003, 75 (15), 3739-3743.
42. Blakeman, K.; Wolfe, D. W.; Cavanaugh, C. A.; Ramsey, J. M., Mass Spectrometry at Pressures Exceeding 1 Torr in a Microscale Cylindrical Ion Trap. 2014, In
Preparation.
43. Chaudhary, A.; van Amerom, F. H. W.; Short, R. T.; Bhansali, S., Fabrication and testing of a miniature cylindrical ion trap mass spectrometer constructed from low temperature co-fired ceramics. Int. J. Mass Spectrom. 2006, 251, 32-39.
44. Pau, S.; Pai, C. S.; Low, Y. L.; Moxom, J.; Reilly, P. T.; Whitten, W. B.; Ramsey, J. M., Microfabricated quadrupole ion trap for mass spectrometer applications. Phys. Rev. Lett. 2006, 96 (12), 120801.
45. Blain, M. G.; Riter, L. S.; Cruz, D.; Austin, D. E.; Wu, G.; Plass, W. R.; Cooks, R. G., Towards the hand-held mass spectrometer: design considerations, simulation, and fabrication of micrometer-scaled cylindrical ion traps. Int. J. Mass Spectrom. 2004,
236 (1-3), 91-104.
46. Cruz, D.; Chang, J. P.; Fico, M.; Guymon, A. J.; Austin, D. E.; Blain, M. G., Design, microfabrication, and analysis of micrometer-sized cylindrical ion trap arrays. Rev. Sci. Instrum. 2007, 78 (1), 015107/1-015107/9.
47. March, R. E.; Todd, J. F. J., Quadrupole Ion Trap Mass Spectrometry. 2nd ed.; John Wiley & Sons: Hoboken, NJ, 2005.
48. Tian, Y.; Higgs, J.; Li, A.; Barney, B.; Austin, D. E., How far can ion trap miniaturization go? Parameter scaling and space-charge limits for very small cylindrical ion traps. Journal of Mass Spectrometry 2014, 49 (3), 233-240.
32
50. Arnold, N. S.; Hars, C.; Meuzelaar, H. L. C., Extended theoretical considerations for Mass resolution in the resonance ejection mode of quadrupole Ion Trap Mass
Spectrometry. Journal of the American Society for Mass Spectrometry 1994, 5 (7), 676-688.
51. Xu, W.; Song, Q.; Smith, S.; Chappell, W.; Ouyang, Z., Ion trap mass analysis at high pressure: A theoretical view. Journal of the American Society for Mass Spectrometry
2009, 20 (11), 2144-2153.
33
CHAPTER 2: THE STRETCHED LENGTH ION TRAP
Introduction
Quadrupole ion traps remained largely unchanged from their commercialization in
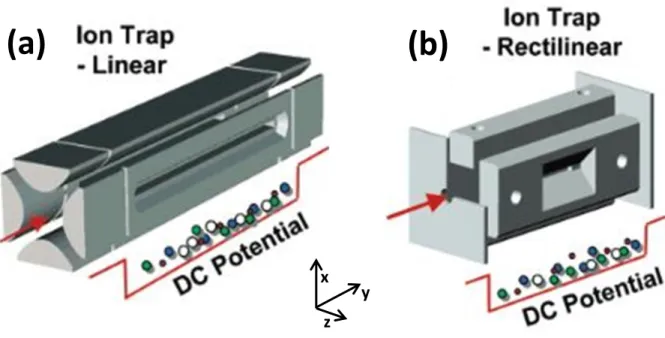
1984 until 2002, when the first linear ion trap (LIT) was reported by Hager1 and improved by Schwartz et al. later that year.2 Shown in Figure 2.1a, the LIT is simply a linear quadrupole with hyperbolic faces split into three segments. Ions are contained in the x and z dimensions
by the RF potential as in the linear quadrupole but are now also contained along the y axis by
holding the outer sections at a higher DC potential. Ions are scanned out of the trap in the
same manner as the QIT, with ramping of the RF amplitude until ions become unstable and
are ejected through slots cut into the rods. The symmetry of the electrodes results in ions
being ejected in both x and z dimensions simultaneously so a resonant AC voltage is added to
one rod pair, directing ejection only in the z dimension.
The linear trapping geometry operates under similar pressures as the QIT, and in
addition has several major advantages over QITs. The most obvious advantage is that due to
trapping of ions along a line rather than a point, the total ion capacity is greatly increased
(near 40x for a commercial LIT),2 making the LIT less sensitive to space charge effects. Second, by operating with opposite phase RF on each electrode pair, the potential along the
y-axis is zero. Therefore, ion injection along this axis can be near 100% efficient. This is in