VARIATIONS IN INFLAMMATORY AND CELL CYCLE GENES AND PRETERM BIRTH, SMALL FOR GESTATIONAL AGE AND HYPERTENSIVE DISORDERS OF PREGNANCY
Quaker Harmon
A dissertation submitted to the faculty of the University of North Carolina at Chapel Hill in partial fulfillment of the requirements for the degree of Doctor of Philosophy in the School of Public Health (Epidemiology).
Chapel Hill 2012
iii
ABSTRACT
QUAKER HARMON: Variations in Inflammatory and Cell Cycle Genes and Preterm Birth, Small for Gestational Age and Hypertensive Disorders of Pregnancy
(Under the direction of Stephanie Engel)
The maternal outcome of preeclampsia and the fetal outcomes of preterm birth and poor intrauterine growth often occur together, share placental pathology and are marked by changes in inflammatory biomarkers. Genetic polymorphisms in inflammatory genes have been
investigated with respect to all of these outcomes with conflicting results. In previous studies case groups have been small or non-representative of US populations, and coverage of
candidate genes has been sparse. We sought to expand coverage of inflammatory genes related to natural killer cells and T cells and in addition included candidate genes related to cell cycle function. In a sample of 1646 women from a bi-racial prospective pregnancy cohort, we
examined the relationship between 503 tagSNPs in 40 genes and the outcomes of preterm birth, small for gestational age, gestational hypertension and preeclampsia.
v
ACKNOWLEDGEMENTS
In addition to my dissertation committee, I would also like to gratefully acknowledge the significant contributions of the following personnel: Dr. Amy Herring and Dr. Steve Cole for bio-statistical support, Dr. Patricia Basta UNC Biospecimen Processing Facility, Kathryn Carrier UNC Project Manager, Kevin Jacobs NCI/NIH for help with plate design, Michael Andre and Amanda Beaty for genotyping at UNC Genomics Core and Alison Wise for help with validation of the preeclampsia outcome.
TABLE OF CONTENTS
LIST OF TABLES ... xii
LIST OF FIGURES ... xv
LIST OF ABBREVIATIONS ... xvi
CHAPTER 1 BACKGROUND ... 1
Introduction ... 1
1.2.1 Preterm Birth ... 4
Descriptive Epidemiology ... 4
Classification ... 4
Time Trends ... 5
Sequelae ... 6
Risk Factors ... 8
1.2.2 Hypertensive Disorders of Pregnancy... 8
Descriptive Epidemiology ... 8
Classification ... 9
Time Trends ... 10
Sequelae ... 10
vii
1.2.3 Fetal Growth ... 12
Fetal Growth as a Reproductive Outcome ... 12
Types ... 14
Time trend ... 15
Sequelae ... 15
Risk Factors ... 16
1.3 Role of Inflammation in Adverse Pregnancy Outcomes ... 18
1.3.1 Preterm Birth ... 18
1.3.2 Hypertensive Disorders of Pregnancy and SGA ... 19
1.3.3 Selection of Inflammatory Genes ... 21
1.4 Role of Cell Cycle in Outcomes ... 27
1.4.1 Description of the Cell Cycle ... 27
1.4.2 Relevance of cell cycle processes ... 28
1.4.3 Selection of Candidate Cell Cycle Genes ... 29
1.5 Evidence of Genetic Component ... 30
Preterm Birth ... 30
SGA ... 32
Preeclampsia ... 32
1.6 Review of Genetic Epidemiologic Studies ... 34
Preterm Birth ... 35
Hypertensive Disorders of Pregnancy ... 47
SGA ... 55
CHAPTER 2 METHODS ... 58
2.1 Specific Aims ... 58
2.2 Study Population ... 60
2.2.1 Pregnancy Infection and Nutrition Study ... 60
2.2.2 Selection of Cases and Controls ... 64
Case selection ... 64
Non-case Selection ... 65
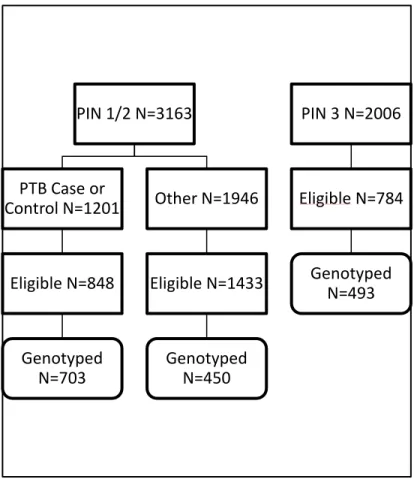
Sources of DNA (Figure 2.2) ... 65
2.3 Variable Measurement ... 67
2.3.1 Outcomes ... 67
2.3.1.1 Preterm Birth ... 67
2.3.1.2 Hypertensive Disorders of Pregnancy ... 67
Validation Study ... 69
2.3.1.3 Small for gestational age ... 73
2.3.2 Main Exposures ... 73
ix
2.3.2.2 Tag Selection ... 74
2.3.2.3 GoldenGate Process ... 75
2.3.2.4 Quality Control ... 76
Genotyping ... 76
Hardy Weinberg ... 76
Participants ... 77
2.3.3 Genetic Ancestry ... 77
2.3.4 Additional covariates ... 78
2.3.4.1 Smoking ... 78
2.3.4.2 Height and Body Mass Index ... 78
2.3.4.4 Parity ... 79
2.3.4.5 Age ... 79
2.3.4.6 Poverty ... 79
2.4 Analysis Plan ... 79
2.4.1 Stage 1 ... 80
2.4.2 Stage 2 ... 88
2.4.3 Stage 3 ... 94
2.4.4 Covariate analysis ... 94
2.4.4.1 Cell cycle ... 94
Preterm Birth ... 98
Gestational Hypertension ... 101
SGA ... 103
2.4.5 Population Stratification ... 104
2.4.6 Power ... 107
2.4.7 Strengths and Limitations ... 112
CHAPTER 3 QUALITY CONTROL RESULTS ... 115
3.1 Quality Control Summary ... 115
Individual Samples ... 115
SNPs ... 116
3.2 Quality Control for SNPs ... 116
3.2.1 Blinds ... 116
3.2.2 Trios ... 117
3.2.3 Hardy Weinberg Equilibrium ... 118
3.2.4 Additional SNP considerations ... 119
3.3 Quality Control for Individuals ... 120
3.3.1 Cryptic Associations ... 120
3.3.2 Missing Genotype Information ... 121
3.3.3 Exclusions based on pregnancy outcome ... 121
xi
3.5 Assessment of genetic ancestry ... 125
CHAPTER 4 RESULTS ... 128
Summary Paper 1 ... 128
Summary Paper 2 ... 129
Paper #1: Polymorphisms in Natural Kill Cell Related Genes are Associated with Preterm Birth ... 131
Paper #2: Polymorphisms in Inflammatory Genes are Associated with Term SGA and Preeclampsia ... 150
Additional results ... 171
CHAPTER 5 DISCUSSION ... 172
Summary of results ... 172
Heterogeneity by genetic ancestry ... 174
Future approaches ... 179
Public Health Implications ... 181
APPENDIX: SUPPLEMENTAL TABLES ... 183
LIST OF TABLES
Table 1.1 Risk factors for preterm birth ... 8
Table 1.2 Risk factors for hypertensive disorders of pregnancy ... 12
Table 1.3 Factors associated with fetal growth ... 17
Table 1.4 Candidate genes involved in inflammation ... 25
Table 1.5 Overview of role and supportingevidence for cell cycle genes ... 29
Table 1.6 Review of Genetic Epidemiology Studies of Preterm Birth ... 37
Table 1.7 Review of Genetic Epidemiology Studies of Preeclampsia ... 49
Table 1.8 Review of Genetic Epidemiology Studies of Smallfor Gestational Age ... 56
Table 2.1 Comparison of the entire PIN cohort, eligible for genotyping and genotyped ... 63
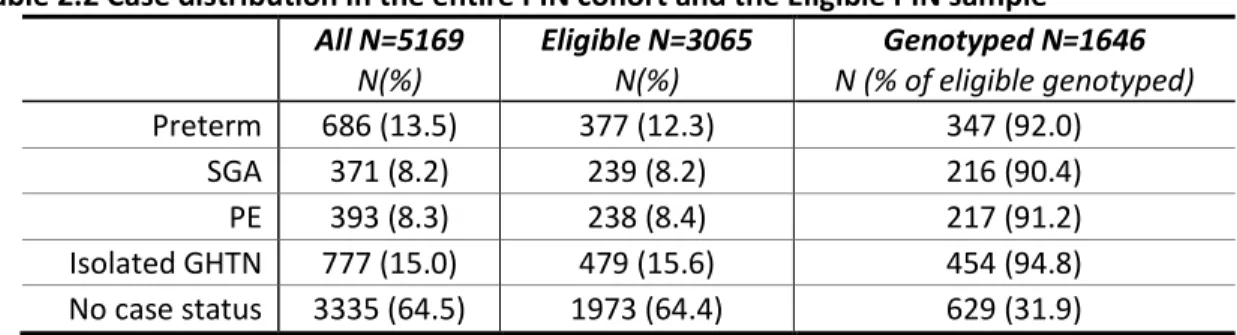
Table 2.2 Case distribution in the entire PIN cohort and the Eligible PIN sample ... 64
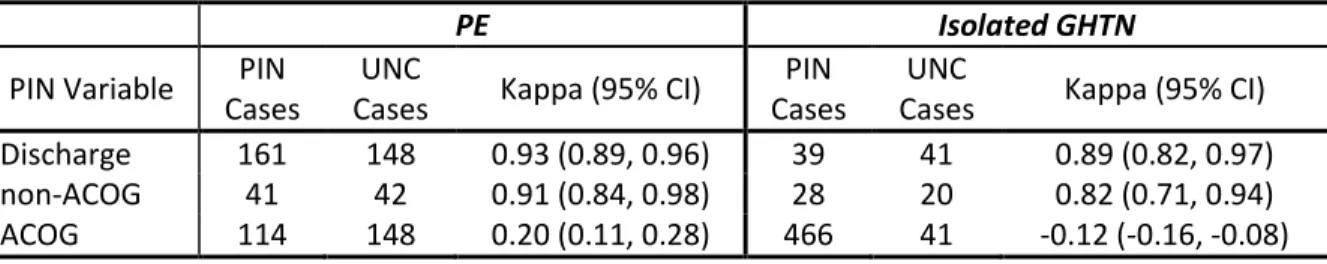
Table 2.3 Agreement between PIN variables and the UNC Perinatal Database for 1223 women with discordant PIN values ... 70
Table 2.4 Case definition for Preeclampsia (PE) and Isolated Gestational Hypertension (GHTN) ... 71
Table 2.5 Number of SNPs in each gene set for inflammatory genes ... 84
Table 2.6 Number of SNPs in each gene set for cell cycle genes ... 84
Table 2.7 Number of individuals with complete genotype information for each gene set and outcome stratified by genetic ancestry group... 85
Table 2.8 Breakdown of Cases and Controls by outcome and genetic ancestry ... 91
Table 2.9 Missing in possible covariates stratified by race ... 96
Table 2.10 Impact of adjustment for all possible covariates for each case group and the non-case group ... 97
Table 2.11 Criteria used in power calculations... 108
xiii
Table 2.13 Power to detect multiple risk alleles ... 110
Table 2.14 Power with OR 1.4 to find one allele with a range of MAF and Type 1 error .... 111
Table 3.1. Distribution of p-values for 1429 SNPs ... 118
Table 3.2 SNPs with exact p-value for HWE <0.01 among non-cases stratified by genetic ancestry ... 119
Table 4.1 Paper #1 Demographic Characteristics of PIN Mothers ... 144
Table 4.2 Paper #1 Q values from SKAT analysis for each geneset stratified by genetic ancestry ... 145
Table 4.3 Paper #1 Single SNP Relative Risk and 95% Confidence Intervals for Preterm and Spontaneous Preterm Birth among Mothers Stratified by Genetic Ancestry ... 146
Table 4.4 Paper #2 Demographic characteristics of small for gestational age (SGA) cases and controls ... 163
Table 4.5 Paper #2 Demographic characteristics of gestational hypertension (GHTN) and preeclampsia (PE) cases and controls ... 164
Table 4.6 Paper #2 Q values from SKAT analysis for each SNP-set stratified by genetic ancestry ... 165
Table 4.7 Paper #2 Single SNP associations, risk ratio and 95% confidence interval for maternal SNPs for SGA and Term SGA in infants stratified by maternal genetic ancestry ... 166
Table 4.8 Paper #2 Single SNP associations, risk ratio and 95% confidence interval for maternal SNPs and Preeclampsia stratified by genetic ancestry ... 167
Table S1 Placental Pathology in PIN 3 ... 183
Table S2 RS number and minor allele frequency for SNPs in Inflammatory Genes ... 184
Table S3 RS number and minor allele frequency for SNPs in Cell Cycle Genes ... 192
Table S4 List of PIN blinds and corresponding PIN ID ... 194
Table S5 Summary of disposition of blinds and corresponding original sample ... 195
Table S6 Identification of trio members from five Utah families ... 195
Table S8 SNPs (N=106) deleted for poor genotyping ... 197
Table S9 SNPs excluded for being non-polymorphic ... 198
Table S10 PIN participant IDs excluded from analysis (N=48) ... 198
Table S11 List of AIMS Genotyped (N=156) ... 199
Table S12 Individuals with ambiguous genetic ancestry ... 200
Table S13 Individuals with discordant self-reported race and genetic ancestry ... 200
Table S14 Paper #1 Number of individuals included in each SNP-set for SKAT analysis ... 201
Table S15 Paper #1 Demographics for entire PIN cohort, eligible cohort and genotyped cohort ... 202
Table S16 Paper #1 Risk Ratio and 95% Confidence Interval for all SNPs stratified by genetic ancestry ... 203
Table S17 Paper#2 Demographics for entire PIN cohort, eligible cohort and genotyped cohort ... 215
Table S18 Paper #2 Risk ratio and 95% confidence interval for all genotyped SNPs for SGA and Term SGA stratified by genetic ancestry ... 216
Table S19 Paper #2 Risk ratios and 95% confidence intervals for all genotyped SNPs and Preeclampsia and Gestational Hypertension stratified by genetic ancestry ... 230
xv
LIST OF FIGURES
Figure 2.1 Flow Chart of sample selection ... 62
Figure 2.2 Sources of DNA for the current study ... 66
Figure 2.2 Sources of DNA for the current study ... 66
Figure 2.3 General DAG for inflammation pathway ... 96
Figure 2.4 DAG for Preterm Birth ... 100
Figure 2.5 Alternate DAG for Preterm Birth ... 100
Figure 2.6 DAG for Gestational Hypertension ... 101
Figure 2.7 DAG for SGA ... 103
Figure 3.1 Flow Chart of Exclusions of Individuals ... 123
Figure 3.2 Flow Chart of SNP Exclusions ... 124
Figure 3.3 Triangle Plot of Genetic Ancestry ... 126
Figure 3.4 Bar plot of%ancestry for all individuals by self-reported race ... 126
Figure 4.1 Linkage Disequilibrium in IL12A within European and African Americans ... 148
Figure 4.2 Linkage Disequilibrium in CSF2 in European Americans... 148
Figure 4.3 Linkage Disequilibrium within IL13 and IL4 within European Americans ... 149
Figure 4.4 Linkage Disequilibrium within IFNGR2 for European Americans ... 149
Figure 4.5 Linkage disequilibrium (r2) in IL6 stratified by genetic ancestry... 168
Figure 4.6 Linkage disequilibrium (r2) in KLRD1 stratified by genetic ancestry ... 169
LIST OF ABBREVIATIONS
ABI Applied Biosystems
ACOG American College of Obstetricians and Gynecologists
BMI body mass index (kg/m2)
CES-D Center for Epidemiologic Studies Depression Scale
CEPH Centre d’Etude du Polymorphism Humain, Northern and Western European Ancestry
CEU Northern and Western Europe Ancestry
CI confidence interval
CVD cardio vascular disease
DAG directed acyclic graph
DBP diastolic blood pressure
DNA deoxyribonucleic acid
GDM gestational diabetes mellitus
GHTN gestational hypertension
HWE Hardy Weinberg Equilibrium
xvii IPW inverse probability weighting
IQR inter-quartile range
IUGR intrauterine growth restriction
kg kilogram
LD linkage disequilibrium
MAF minor allele frequency
MOS Medical Outcomes Study
OR odds ratio
PE preeclampsia
PIN Pregnancy Infection and Nutrition
PPROM preterm premature rupture of amniotic membranes
PPV positive predictive value
PTB preterm birth
PTL preterm labor
QC quality control
SBP systolic blood pressure
SNP Single Nucleotide Polymorphism
UNC University of North Carolina
US United States
CHAPTER 1 BACKGROUND
Introduction
Pregnancy is a state of altered inflammatory function.1, 2 In the majority of pregnancies, the altered inflammatory function works to the benefit of both mother and fetus by mitigating the immune rejection of fetal tissue3, 4 while restricting the extent of invasion of the fetally derived placenta.5 As the pregnancy progresses, the balance of pro and anti-inflammatory cytokines may act as a determinant of the timing of delivery.4 Perturbations in inflammatory pathways from pre-conception through delivery have significant impacts on the success of the pregnancy and the health of both the mother and the fetus. Increased inflammation has been implicated in preterm birth,2, 6 poor fetal growth as measured at birth (Small for Gestational Age, SGA)4, 7 and Hypertensive Disorders of Pregnancy including Preeclampsia (PE) and Gestational Hypertension without proteinuria (GHTN).1, 8
have been limited and only a handful of studies have measured associations with SGA, covering fewer than 10 inflammatory genes in total.
Given the dramatic growth of the placenta during pregnancy and the pivotal role it plays in sustaining the fetus, factors that limit placental growth or function may be involved in SGA, PE and preterm birth. In addition to placental growth, remodeling of the uterine wall and
vasculature is extensive and must occur for a successful pregnancy. Cell cycle processes are fundamental for cell proliferation, and genetic polymorphisms in cell cycle genes may result in reduced cell proliferation and poor placental development, leading to poor fetal growth and/or preeclampsia. Genetic polymorphisms in cell cycle genes have not been extensively studied for the outcomes of PE, SGA or preterm birth. A few studies have found associations with other reproductive outcomes such as missed abortion16 and gestational diabetes.17 Additionally, a number of cell cycle genes have been implicated in related outcomes such as cardiovascular disease18 and type 2 diabetes.19 Animal and human placental expression studies have also suggested that cell cycle genes are differentially expressed in placental tissue20, 21 and may differ in expression, quantity or function in women with PE or SGA. Therefore cell cycle genes
contribute to a novel pathway that may be important in the outcomes of PE, SGA and preterm birth.
The Pregnancy Infection and Nutrition Cohort offers a good opportunity to study
3
Descriptive epidemiology of Preterm, SGA/IUGR and Preeclampsia/Gestational Hypertension
Preterm birth, poor fetal growth and gestational hypertension are maternal and infant outcomes that often co-occur. Hypertensive disorders of pregnancy (including both
preeclampsia and gestational hypertension) are maternal conditions that result in preterm birth in up 60% of pregnancies complicated by preeclampsia and poor fetal growth in up 25%.22 Preterm birth due to medical indications, which may include maternal disease due to gestational hypertension, only accounts for 30% of preterm births23 with the majority of preterm births having an etiology unrelated to gestational hypertension. While poor fetal growth is present in some pregnancies complicated by gestational hypertension, the association with preterm birth is more complicated. While there is evidence that infants born preterm may be smaller than their in utero peers at a given gestational age,24 a measure of fetal growth such as SGA (small for gestational age) that is adjusted for gestational age, should have a similar proportion of ‘small’ infants at each gestational age.
Despite the similarities and co-occurrence of these outcomes, they share distinct risk factors and etiologies, which will be explored below. In studying closely associated outcomes such as these, similarities in genetic associations must be examined for confounding, and phenotypes should be adjusted when appropriate. By examining this group of outcomes in the same population, it is our hope that identification of both similar and distinct genetic
1.2.1 Preterm Birth
Descriptive Epidemiology
Preterm birth is defined as delivery before 37 completed weeks of gestation. In the United States, preterm birth occurs in approximately 12% of births. Although it is primarily defined by the timing of delivery, preterm birth is a heterogeneous outcome with multiple pathways leading to a birth before term. Preterm birth has been divided into subtypes based on the indication for delivery, the timing of delivery, or the presumed underlying pathology. Preterm birth is of importance due to the significant medical and societal impacts borne by the infants and their families throughout the life course.25
Classification
Based on indication for delivery, preterm birth can be characterized as preterm labor, preterm premature rupture of the fetal membranes or a medically indicated delivery for the health of the mother or infant. Although these subtypes are commonly used and may have different risk factors, the distinction between the indications for preterm delivery may not always be etiologically important.26-28
5
and infant mortality as well as the highest risk of later complications.25 There is some indication that early preterm birth may have distinct risk factors.26
A classification of preterm based on the underlying pathology resulting in preterm birth would be most interesting from an etiologic perspective. While specific maternal medical conditions (preeclampsia, underlying chronic disease), fetal conditions (severely low amniotic fluid, fetal distress, and certain congenital defects), maternal trauma or serious illness may often be an apparent cause of preterm birth, many etiologies of preterm birth (subclinical placental abruption, placental pathology, subclinical uterine infection or inflammation) are neither apparent, nor susceptible to diagnosis prior to delivery.
Time Trends
Sequelae
Infant
Neonatal and infant death is the most serious consequences of preterm birth. In 2006 the U.S. the infant mortality rate for preterm was 35 per 1,000, compared with 2 per 1,000 among term infants. Among preterm infants, the risk of mortality is highest for those born earliest with very preterm infants (less than 32 weeks) having an infant mortality rate of 176 per 1,000, compared with 7 per 1,000 among late (34-36 week) preterm infants.34 Although preterm birth, and in particular very preterm birth, is relatively uncommon, the high death rate among preterm infants results in infant mortality among preterm infant accounting for 68% of total infant mortality in 2006.
In addition to mortality, preterm infants are at increased risk for significant morbidity. Acute complications include respiratory distress, necrotizing enterocolitis, feeding intolerance, apnea, infection, cardiac abnormalities, anemia, and brain injury (intraventricular hemorrhage and periventricular leukomalacia). Chronic health concerns include chronic lung disease, gastro-espohageal reflux, vulnerability to infection (particularly respiratory syncitial virus), hearing loss, eye disorders (retinopathy of prematurity), cerebral palsy, cognitive deficits, behavioral
problems and epilepsy.25, 35 Follow-up studies have also shown an association between gestational age at birth and educational attainment and income later in life.35, 36 As with mortality, the risk and severity of acute and chronic morbidity is associated with the severity of preterm, with infants born before 28 weeks at highest risk.33
7
infants, and these infants also had increased respiratory distress syndrome, sepsis,
intraventricular hemorrhage and NICU admission.37 Although there are fewer long-term studies among late preterm infants specifically, there is some indication that there may be a risk of long term behavioral problems as well.38
Maternal
Maternal health consequences from preterm birth are fewer compared with infant
sequelae, and they may be attributable to shared pathways between preterm delivery and later health outcomes, rather than early delivery itself. Women with a previous preterm birth are more likely to have subsequent preterm births.23, 39 Many of the medical sequelae for women with preterm delivery are related to the underlying pathology that necessitated the preterm birth such as complications from preeclampsia, gestational diabetes, coagulation disorders or underlying cardiac or respiratory conditions. As such, the preterm delivery is associated with subsequent maternal health complications, but the preterm delivery is not causative.
Risk Factors
Apart from pre-existing or emergent maternal medical conditions and previous preterm birth, few strong risk factors for preterm birth have been identified. Table 1.1 highlights the most commonly identified risk factors. Heritability will be discussed in Section 1.5.
Table 1.1 Risk factors for preterm birth23, 25, 41, 42
Behavioral and Psychosocial Pregnancy Complications Maternal Medical Condition
Smoking Infection Assisted Reproduction
High psychological or social stress Vaginal bleeding Short inter-pregnancy interval Long work hours, hard physical labor. Placental abruption History of thyroid, renal, Cocaine, heroin use High or low amniotic fluid respiratory, cardiac, diabetes, Heavy alcohol use Placenta previa auto-immune conditions,
Depression Abdominal surgery hypertension.
Poor nutrition Multiple gestation Cervical cone biopsy or LEEP Pre eclampsia Previous preterm
Demographic and Anthropometric Short cervical length African American race Environmental Exposures Uterine abnormalities Low socio-economic status Lead
Low education Occupational exposure to PCB
Extremes of age DDT
Unmarried status Environmental tobacco smoke Low pre-pregnancy BMI Air pollution
1.2.2 Hypertensive Disorders of Pregnancy
Descriptive Epidemiology
9
disorders overall.45 Although the exact incidence may be uncertain, hypertensive disorders of pregnancy are a leading cause of maternal mortality. In the United States, from 1991 to 1999 hypertensive disorders of pregnancy was the identified cause of death in 15.7% of maternal deaths46 while from 1998 to 2005 hypertensive disorders of pregnancy were identified as cause of death in 12.3% of maternal deaths.47
Classification
Although there is some variation in the nomenclature used to describe the specific conditions,45 the following terminology will be used. Gestational hypertension (GHTN) is an increase in blood pressure after 20 weeks of gestation without proteinuria (protein in urine). Preeclampsia (PE) is an increase in blood pressure after 20 weeks gestation with evidence of proteinuria. Women with preeclampsia may also have edema, visual disturbances, headache and abdominal pain. Severe preeclampsia includes a blood pressure above 160 mmHg systolic or 110 mmHg diastolic, proteinuria in excess of 5 grams per 24 hours (3+ dipstick), low urine output, pulmonary edema, low platelets and elevated liver enzymes. Eclampsia is diagnosed when a woman with preeclampsia experiences a new-onset seizure. In a woman with pre-existing hypertension or renal impairment, a diagnosis of superimposed preeclampsia can be made with worsening of hypertension or proteinuria or the new involvement of other systems (neurological, liver, hematologic).22,45
of preeclampsia used a “30-15” rule; an increase in systolic blood pressure of 30 mmHg or an increase in 15 mmHg in the diastolic blood pressure over baseline.45
There is some suggestion that preeclampsia is a heterogeneous disorder with different pathophysiology for those cases arising early in pregnancy with impaired fetal growth compared to cases arising later in pregnancy with little fetal compromise.48
Time Trends
The changing and differing diagnostic criteria for hypertensive disorders of pregnancy, as well as poor data quality on birth certificates, has complicated the analysis of these disorders over time. Using data from the National Hospital Discharge Survey, Wallis found an increase in both gestational hypertension and preeclampsia over the period from 1987 to 2004. GHTN increased from 10.7 per 1,000 deliveries in 1987-1988 to 30.6 per 1,000 deliveries in 2003-2004. Over the same time period preeclampsia increased from 23.6 per 1,000 deliveries to 29.4 per 1,000.49 An analysis of preeclampsia in Norway, which has had more stable diagnostic criteria and universal access to care, over the period of 1967-2003 suggested a gradual increase in the incidence of preeclampsia in first pregnancies from 3.1% in the first decade of the study to 5.5% in the final decade.50 Currently, rising rates of obesity, a risk factor for preeclampsia, have led to concerns that the incidence of preeclampsia may continue to increase.22, 43
Sequelae
Fetal
11
fetal or maternal indications.22 Preterm birth can be indicated due to intrauterine growth restriction, placental abruption, low amniotic fluid or non-reassuring fetal testing. Acute and chronic sequelae from preterm birth and poor fetal growth are covered in Sections 1.2.1 and 1.2.3. Still birth and infant death are rare fetal outcomes, which are elevated compared with non-hypertensive pregnancies.22, 50
Maternal
Many of the symptoms of hypertensive disorders of pregnancy resolve with the delivery of the infant. In severe cases, there can be longer lasting sequelae including neurologic deficits as a result of seizure or stroke, renal failure, liver failure or hemorrhage.45 Hypertensive disorders of pregnancy are one of the leading causes of maternal mortality.
Women with a prior pregnancy complicated by hypertension are more likely to have recurrent gestational hypertension and preterm birth.22, 45 There is also evidence that women with gestational hypertension or preeclampsia are at increased risk for cardiovascular disease (CVD) and diabetes later in life,51, 52 with some evidence to suggest that early preeclampsia or recurrent preeclampsia are stronger risk factors for later CVD.
Risk Factors
The strongest known risk factor for preeclampsia is the presence of antiphospholipid antibodies and a previous pregnancy with preeclampsia.53 These are associated with a more than 5 fold increase in risk. However preeclampsia is most often associated with first
Table 1.2 Risk factors for hypertensive disorders of pregnancy22, 45, 53
Maternal Medical Conditions Pregnancy Related Conditions Demographic and Anthropometric Factors
Antiphospholipid syndrome Previous PE Increased BMI
Chronic Hypertension First birth Extremes of age
Diabetes Multiple Gestations Family History of PE
Pre-existing disease; renal, Long Inter pregnancy Interval African American race autoimmune, vascular, Infection
connective tissue, rheumatic, New Father* Behavioral
thrombophilias Smoking (protective)
*The risk associated with novel sperm exposure is quite controversial
Smoking
Of note, smoking has an accepted and seemingly robust, if weak, protective association with preeclampsia. Multiple studies and systematic reviews have shown an association between smoking and both gestational hypertension and preeclampsia in the range of OR 0.5-0.754-56 with some suggestion that heavy smokers, women who smoke until the end of pregnancy and lean women57 have more protection.
1.2.3 Fetal Growth
Fetal Growth as a Reproductive Outcome
13
and the inability to obtain a true fetal weight until the time of delivery, assessment of fetal growth is quite difficult.
Despite the difficulties in assessing the trajectory of fetal growth, the final product of fetal growth, birth weight, is a well-measured and well recorded outcome. Low birth weight (<2500 g) in particular, is associated with a number of important neonatal outcomes including neonatal mortality and morbidity. However, focusing simply on birth weight obscures important individual level and population associations. Historically, given the difficulty is assessing gestational age accurately, preterm birth was sometimes equated with low birth weight. However, not all preterm births are also low birth weight. Additionally small term infants may have undergone restricted growth in utero, and so-called “normal” birth weight infants may not have reached their full potential. At the population level, factors such as altitude that result in a lower mean birth weight may not be pathological.
Within the population of “small” infants, only a fraction are small for reasons that will result in meaningful health consequences. Yet attempts to identify small infants who are also high risk for other outcomes have had only limited success. At a population level with large numbers, the residual distribution of birth weight can help identify populations at risk for higher infant mortality by identifying a surplus of small preterm infants.58 At the individual level, birth weight adjusted for gestational age through a small for gestational age (SGA) or z-score
measurement overcomes some of the difficulty with looking solely at low birth weight by taking time in utero available for growth into account.
this discrepancy and may fail to capture many preterm infants who have been growth restricted in utero.60 Use of ultrasound-based measures of fetal growth has been offered as a possible solution to the difficulties of a live birth standard.60 Ultrasound-based measures however are algorithms that also have inherent errors and can only be established and validated in a select population, inviting bias and non-generalizabilty .
For purposes of this study, the outcome of interest is intrauterine or placental conditions that prevent the fetus from attaining maximal growth. While frequent longitudinal ultrasound measurements starting at a very early in pregnancy for cohort members along with a
comparable population sample would be ideal, these data were not available for this secondary analysis. The SGA variable collected for the study cohort may under-represent growth restricted preterm infants, but the cut-point of 10% offers a reasonable balance between more stringent definitions, which would further bias the preterm infants, and a more permissive definition, which would identify more constitutionally small infants.
Types
15 Time trend
As measured by SGA, poor fetal growth will, by definition, remain stable over time. Therefore continuous measures such as the distribution of birth weights, residual distributions of small preterm infants, or mean birth weight over time will provide more information about temporal trends in birth weight. National statistics from the US suggest a fairly stable birth weight distribution between 1950 and 2000 with a very slight shift towards heavier births.33 A study in Norway examined birth weights from 1860 to 1984, a time period that included both industrialization and periods of industrial collapse, World Wars and modern times with a strong social support system, all of which all affect the livelihood, nutrition and general health of women. Over this period of time in Norway birth weights increased just under 200g over the course of 120 years.63 These data suggest that population-level birth weight has remained fairly stable over time.
Sequelae
Infant
Low birth weight is consistently associated with increased neonatal mortality33 although it is difficult to ascribe causation given the number of causes of low birth weight (preterm birth in particular) and the possibility of an unknown common cause of low birth weight and neonatal mortality.64 The immediate neonatal sequelae of low birth weight are often intertwined with the sequelae of early gestational age, although the association between infant mortality and birth weight is evident at all gestational ages.58
health outcomes.65 However, while birth weight may not be causally linked to subsequent outcomes, there are a number of observed associations between birth weight and later health outcomes.
The Barker Hypothesis66-68 suggests that impaired growth and development in fetal life and infancy programs persistent changes in metabolic, physiologic and structural processes that influence the development of chronic disease later in life. In particular, heart disease and diabetes have been associated with lower weight at birth. While the association with all-cause mortality has been less clear cut, there is the suggestion of higher cardiovascular and all-cause mortality among low birth weight infants compared with their “normal” birth weight peers.69
Maternal
Delivery of a small fetus is often less physically difficult for women with lower incidence of perineal damage and need for c-section due to fetal size. As with preterm delivery, the
immediate maternal sequelae depend on the cause of the low birth weight. There is some suggestion that women who deliver low birth weight infants may be at increased risk for later CVD. The association with later CVD seems to be driven by the preterm aspect of low birth weight and is likely due to common cause between CVD and poor fetal growth or preterm birth.40, 70 There is however suggestive evidence that a biologic process activated during pregnancy that results in a low birth weight infant may persist and result in later CVD.71
Risk Factors
17
negative sequelae. Although this study is focused on poor fetal growth as a marker of placental dysfunction, large infants also can have poor outcomes.
Risk factors for poor or excessive fetal growth are complex. Birth weight is the culmination of fetal, maternal and environmental factors. Potential for infant height and weight is
determined by fetal genetics. Attainment of that potential is influenced by maternal ability to supply the necessary nutrients and the intervention of many possibly environmental insults.
A number of natural experiments in maternal malnutrition, such as severe famines during times of war, have shown that acute maternal malnutrition, below 1,500 calories a day, especially during the third trimester, is associated with birth weight decrements of approximately 300g. However, above this minimum level, maternal adaptation appears to protect the fetus from significant weight loss.63
Table 1.3 lists a number of factors that are associated with birth weight across the range of birth weight with some conditions increasing the risk for large infants (diabetes) and others associated with small infants (smoking). Heritability and recurrence of low birth weight will be explored in Section 1.5.
Table 1.3 Factors associated with fetal growth 33, 41, 61
Maternal/Paternal Pregnancy Related Environmental (all limited evidence)
Ethnicity/ Race Parity Lead
Social Class Plurality DDT/DDE
Maternal height and weight Smoking Environmental Tobacco Smoke Parental birth weight Fetal sex Outdoor air pollution
Previous LBW infant Gestational hypertension Disinfection by products Gestational diabetes Nitrate in water
1.3 Role of Inflammation in Adverse Pregnancy Outcomes
Pregnancy is a state of altered inflammatory function.1 During an uncomplicated pregnancy, there are distinct changes in maternal immunity that result in an enhancement of defensive or innate immunity and a decrease in adaptive immunity through reduced natural kill cell and T cell inflammatory activity. Compared with post-partum levels, there are marked changes in cytokine concentrations, activity and response to stimulation.72, 73 In the majority of pregnancies, the altered inflammatory function benefits both mother and fetus by mitigating the immune rejection of fetal tissue3 while restricting the extent of invasion of the fetally-derived placenta.5 As the pregnancy progresses, the balance of pro- and anti-inflammatory cytokines may act as a determinant of the timing of delivery.74 Dysregulation in inflammatory pathways from pre-conception through delivery may impact the success of the pregnancy and the health of both the mother and the fetus.
1.3.1 Preterm Birth
Although the biological pathways behind the initiation of labor, whether at term or preterm, are still poorly understood, inflammatory cytokines are integral to a number of processes that occur at the time of delivery. As reviewed by Bowen,74 pro-inflammatory cytokines tend to increase towards term, and labor itself is a pro-inflammatory state.
Inflammatory cytokines (1, TNFα, 6) in addition to anti-inflammatory cytokines (4 and IL-10) influence the production and metabolism of prostaglandins which enhance uterine
contractility.75 TNFα, IL-1β, IL-6, CSF1, TGFβ and IL-8 influence the secretion of
19
Given the role of infection in preterm delivery, evidence of elevated inflammatory cytokines in preterm deliveries may be due to underlying acute or chronic infection. However pregnancies uncomplicated by infection show elevated levels of IL-8 and IL-1β, suggesting an independent role of inflammatory cytokines.75
1.3.2 Hypertensive Disorders of Pregnancy and SGA
Although distinct outcomes, Hypertensive Disorders of Pregnancy and SGA share certain common biologic process and will be considered together. Among the similarities, Ness9 and others3, 7, 10 note that many cases of SGA and PE share common placental pathology that includes shallow placentation. In normal pregnancy, fetal cytotrophoblasts invade the maternal tissue and orchestrate remodeling of the maternal vasculature. Maternal spiral arteries that had previously been narrow and contractile become wider with erosion of the muscular lining so that resistance to placental blood flow is reduced and no longer subject to vasomotor
contraction.3, 8 The process of changes in the maternal uterine wall (myometrium and decidua) is referred to as remodeling. Part of the pathology associated with both preeclampsia and poor fetal growth is shallow placentation, with both the myometrium and decidua showing reduced transformation. For PE there is sometimes evidence of absence of vascular remodeling in the myometrium and reduced remodeling in the decidua. For pregnancies that result in poor fetal growth, however, there is some, but still diminished, remodeling in both the myometrium and decidua.76
Inflammatory cytokines play a role in successful placental invasion and development74 and may influence the invasive phenotype of trophoblasts. The interaction between fetal
remodeling, limits the extent of the invasion.5 Inflammatory cytokines may also play a role in placental development by influencing the hypoxia inducible factor (HIF), a transcription factor which is central in placental angiogenesis.9
The later manifestations of poor placentation can be maternal, fetal or both, with SGA and PE occurring both concurrently and in isolation.77 Fetal effects of poor placentation include SGA. With inadequate transformation of spiral arteries, the resistance to placental blood flow
remains high, and as a result there is inadequate delivery of both oxygen and other nutrients to the fetus. While some degree of maternal and fetal adaptation can occur (increased maternal cardiac function and increased erythropoiesis to improve oxygen carrying capacity and delivery, and fetal shunting of blood, decreased fetal movement and tone), in SGA these adaptations are insufficient to overcome the restricted oxygen and nutrients available to the fetus.78
Maternal effects of poor placentation can include symptoms of gestational hypertension including increased blood pressure, decreased renal function and endothelial dysfunction. As result of shallow placentation, hypoxia and ischemic-reperfusion injuries occur with increased levels of inflammatory cytokines. These inflammatory cytokines may act directly to create the symptoms of preeclampsia or may act through other biological pathways including angiogenesis, the rennin-angiotensin system, endothelial activation, or clotting system disturbances.1, 8, 9 Ness also hypothesizes that the inflammatory cytokines may interact with preexisting risk factor for metabolic syndrome (adiposity, hyperglycemia, insulin resistance, hyperlipidemia,
coagulopathy) to predispose some women with poor placentation to exhibit symptoms of PE.9
21
blood pressure, decrease blood flow and renal function) by infusing rats with pro-inflammatory cytokines.
Inflammatory cytokines have been measured in the serum of women with gestational hypertension, preeclampsia and SGA. Increases in pro-inflammatory cytokines (TNFα, IL-6, IL-8) have been identified in women with PE8 and SGA (IL-6, TNFα, IL-1, IL-8) 1, 4, 7, 9 and in women who will go onto develop PE. 74, 79, 80 Decreased levels of anti-inflammatory cytokines (IL-10) has also been associated with PE 8 and SGA.4, 74 Although not all studies are consistent and vary with respect to timing of sample collection, sample tissue, outcome definition and comparison groups, there is sufficient evidence to implicate inflammatory cytokines in the outcomes of GHTN and SGA.
1.3.3 Selection of Inflammatory Genes
The inflammatory pathway is complex and interconnected with a number of other biologic pathways. Review of existing genetic studies (Section 1.6) suggested some genes that are important to consider (TNFα, LTA (TNFβ), IL6, IL6R, IL1A, IL1B, IL10, IL2, IL4, IL13). Some of the genes found in previous studies (TNFR1, TNFR2, IL5, IL1RA) were not included in the current panel due to design issues, including identification of more biologically relevant genes, poor tag design scores, difficulty tagging the gene in a combined CEU and YRI population, too many SNPs required to tag the gene, or previous findings based solely on tags with poor replication.
In order to expand on candidate genes, we considered the underlying immune system and links to cardiovascular outcomes. Although the three outcomes under consideration have different underlying pathology, the inflammatory genes involved may be similar. The
and placental studies. Saito81, 82 provides a conceptual framework for preeclampsia that
highlights the delicate balance between different arms of the immune system during pregnancy.
The human immune system can be divided into the innate immune system and the adaptive immune system.83 The innate immune system is non-specific and acts quickly in response to multiple insults (injury, pathogens) by recruiting immune cells, activating cells to identify pathogens and remove dead cells, and activating the adaptive immune system. Inflammation is one of the first responses in the innate immune system and can be induced by infection or injury to prevent the spread of infection and promote healing. Cytokines released as a part of the innate immune system (IL1, IL6, IL8, IFNγ, TNFα) induce local reactions (swelling, redness, warmth) and recruit additional immune cells to the site. Innate immunity is non-specific and does not produce long-term immune memory or protection.
The adaptive immune system, while slower to respond compared with the innate immune system, results in the creation of antibodies and generates specific immune responses based on the type of pathogen present. The adaptive system is responsible for immunologic memory and longer-term immune protection. The adaptive immune system functions through T cells and B cells and can produce Type 1 (Th1) or Type 2 (Th2) cytokines.
23
The Th2 response results in humoral immunity. Type 2 cytokines (IL4, IL5, IL6, IL10, IL13) recruit and stimulate B cells, which produce antibodies. These antibodies are responsible for marking pathogens for death and for immune memory. Type 2 cytokines also activate
phagocytic cells (macrophages and neutrophils) to remove antigen, bacteria and complement, which can destroy organisms or make it easier to be spotted as foreign so that other cells will destroy it.
The mechanism that drives the differentiation of naïve T cells to Th1 or Th2 is unknown and is thought to depend on the local cytokine milieu. IFNγ and IL12 drive Th1 cell production while IL10 and IL4 inhibit Th1. IL4, along with IL6 and IL1, drives Th2 production while IFNγ inhibits Th2
cells. Therefore the two cells lines act to inhibit the other and, in as much as both Th1 and Th2 are needed for complete immunity, the two cell lines compete for dominance depending on the unique situation.
Saito suggests that while pregnancy is generally a pro-inflammatory state, the balance of inflammation during pregnancy is in favor of Th2 cells as opposed to Th1 cells. In pregnancy an over expression of the Th1 response may result in rejection of the semi-foreign fetus and trophoblast cells, which are necessary for placental development.
Saito posits that an excessive Th1 response results in the rejection of the fetus
25
Table 1.4 Candidate genes involved in inflammation
Gene Role in Immune
System Association with Reproductive Outcomes
Association with CVD and Metabolic
Syndrome
IL1A Innate Preeclampsia,
84, 85
PTB.86 Increased in response to hypoxia22
IL1B Innate Recurrent Fetal Loss,
87
PTB,88, 89 PE,85 Increased in response to hypoxia22
TNFα Innate/ Th1
PE with IUGR.90 PTB6, 91 Increased in response to hypoxia.22 In rat models
infusion mimics PE8
SBP, Cholesterol ratios, CVD risk factors.92 Diabetes93
IL6 Innate/Th2
Recurrent pregnancy loss.87 PTB6, 91, 94, 95 PE1 Increased in response to reduced
placental blood flow22
Type 1 and Type 2 Diabetes93 MI96
IL6R Innate/Th2 Associated with PTB94, 97, 98
CRP levels.99 CRP levels and risk of CHD.100 Type 2
diabetes101
IL8 Innate
Increased in response to reduced placental blood flow.22 Levels increased
in PE8 Increased placental expression with hypoxia (Thomas Moran)
IL8RB Innate Receptor for IL8
CSF2 Innate (5q31 cluster)
Shows variable expression over the course of pregnancy (Thomas Moran)
LTA Innate/Th1 Recurrent pregnancy loss.102 PTB6 MI103, 104
IL10 (Tr1) Blocks excessive inflammation
Associated with PTB105 PE106-108 Levels decreased in PE8
Graft v host disease109
TGFB1, TGFB3 (Th3)
Block excessive inflammation
May regulate T cell differentiation110 PTB.4, 111 Involved in trophoblast
differentiation112
TNFRSF1B Innate/Th1 PTB113, 114 Hypertension115
IL2 Th1 Increased expression in placenta9 Type 1 Diabetes116 TBX21 (TBET) Th1 Key transcription factor in Th1110
IFNγ Th1 Associated with PTB111
IFNGR2 Th1 Recommended by Thomas Moran (Mt. Sinai Immunologist)
IL12A/IL12B Th1 Influences release of IFNγ by NK cells
22
Plays a role in T cell differentiation82
Type 1 Diabetes117,
118
IL18 Th1 Plays a role in T cell differentiation82
Obesity, diabetes, CHD119 CVD and CVD mortality120 CXCL10 Th1 Closely associated with IFNγ.
IL4 Th2 Associated with PTB4, 105 SGA4 PE121 MI122
IL13 Th2 Associated with PTB4
GATA3 Th2 Key transcription factor in Th2 cells110 Asthma123 IL15 Th1/ NK Associated with PTB98
NFκB1
Transcription factor implicated in many pathways
NFκB signaling in involved in the inflammatory excess seen in obesity124
Abbreviations: PTB (preterm birth), PE (preeclampsia), IUGR (intrauterine growth restriction), SBP (systolic blood pressure), CVD (cardiovascular disease), MI (myocardial infarction), CRP (c-reactive protein), CHD (coronary heart disease), SGA (small for gestational age), NK (Natural Killer Cells)
In addition we had an interest in Natural Killer cells and their role in these outcomes given placental expression data.73 Natural Killer (NK) cells are a part of the innate immune system although they play an important role in adaptive immunity as well. They induce apoptosis in cells and can be activated by mitogens (chemical substance that triggers mitosis), INFγ and IL12 in the absence of antigen or antibody.83 As a response to NK cells, inhibitory KIR cells bind to specific receptors on MHC class 1 molecules and provide protection against cell destruction. Uterine NK cells are the predominate leukocyte in the uterine mucosa and are most abundant in early pregnancy, less conspicuous after 20 weeks and nearly absent at term.126 The fetus and invading trophoblasts are in a sense semi-foreign tissue and are at risk of being destroyed by the maternal immune system. In order to evade detection and destruction, trophoblasts only express the MHC molecules (HLA-C, HLA-E and HLA-G) which have specific ligands for NK cell receptors such as KIRs. Inhibitory KIR binding to the HLA-G expressed by the trophoblast may protect these cells from maternal immune detection and destruction by NK cells.127 There is some evidence that the KIR haplotypes maybe implicated in recurrent miscarriage and PE.128, 129
27
1.4 Role of Cell Cycle in Outcomes
1.4.1 Description of the Cell Cycle
The cell cycle refers to the processes that occur within a cell that leads to duplication of the genetic material and the division of the cell into two daughter cells. Cell cycle functions are vital for the growth of embryonic, fetal and placental tissue and continue to play a role throughout the life cycle in the maintenance and renewal of human tissues and organs.
The cell cycle can be divided into two periods: interphase, during which genetic material is replicated, and mitosis, when the cell splits into two daughter cells each with a full complement of genetic material.
Interphase is composed of G1, S and G2 phase. Briefly, G1 and G2 are periods of cell growth and maintenance during which time biochemical processes ready the cell for DNA synthesis (G1) or mitosis (G2). During S phase, DNA replication occurs and the cell temporarily has two sister chromatids. Since accurate DNA replication and successful cell division is critical to an
organism’s survival, regulation of the cell cycle is tightly controlled. Transitions between the phases of the cell cycle are controlled by checkpoint proteins, which ensure that the cell is prepared to enter the next phase. When factors that might be damaging to the cell, such as UV radiation, reactive oxygen species, and inflammation, are present, and/or DNA damage is detected, arrest of cell cycle progression allows time for a variety of processes, including DNA repair and reduction of cellular stress. If damage is irreparable, arrest of cell cycle progression may result in the cell entering apoptosis (cell death) as opposed to replication.
cell cycle. Disruptions of these cell cycle regulatory proteins can result in cells that are arrested in G1 or G2 and cease replication and/or division. In addition, inhibitory proteins, including cyclin-dependent kinase inhibitors and protein 53 (p53), can block progression of the cell cycle and arrest the cell in a specific phase.
M phase includes both mitosis and cytokinesis. Mitosis is the process by which the chromosomes are separated into two identical sets of chromosomes in two nuclei. Following mitosis, cytokinesis occurs, and the single cell with two nuclei is divided into two daughter cells that are each diploid. M phase accounts for approximately 10% of the cell cycle. Although M phase is vital for cell division, this project will focus on genes associated with interphase and the checkpoint proteins that regulate the entry into S and M phase.
1.4.2 Relevance of cell cycle processes
Epidemiologic studies have noted a strong correlation between placental weight and birth weight and SGA.130-132 Placentas from pregnancies complicated by PE also tend to be smaller, although small placentas are more likely in preterm PE and in PE complicated by SGA.131, 133 As the placenta is essentially an organ that grows de novo over the course of pregnancy,
fundamental cell growth processes maybe influence placental growth. Poor cell cycle function due to genetic polymorphisms may result in reduced cell proliferation and poor placental development with the ultimate outcome of poor fetal growth and/or preeclampsia.
29
expression studies have also suggested that cell cycle genes are differentially expressed in placental tissue20, 21 and may differ in expression, quantity or function in women with PE or SGA.134-138 Therefore cell cycle genes comprise a novel pathway that may be important in the outcomes of preterm birth, GHTN, PE and SGA.
1.4.3 Selection of Candidate Cell Cycle Genes
Candidate genes were chosen to represent a number of important check points in the cell-cycle. In addition, placental expression studies and associations with reproductive, metabolic or cardiovascular outcomes were used to focus on genes that may be relevant (Table 1.4.3).
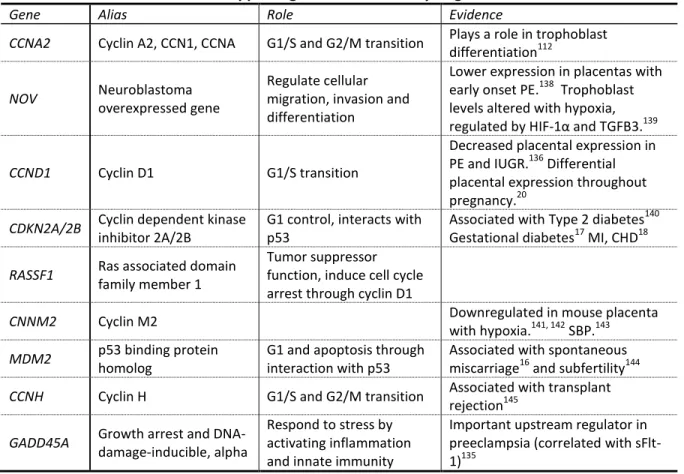
Table 1.5 Overview of role and supporting evidence for cell cycle genes
Gene Alias Role Evidence
CCNA2 Cyclin A2, CCN1, CCNA G1/S and G2/M transition Plays a role in trophoblast differentiation112
NOV Neuroblastoma
overexpressed gene
Regulate cellular migration, invasion and differentiation
Lower expression in placentas with early onset PE.138 Trophoblast levels altered with hypoxia, regulated by HIF-1α and TGFB3.139
CCND1 Cyclin D1 G1/S transition
Decreased placental expression in PE and IUGR.136 Differential placental expression throughout pregnancy.20
CDKN2A/2B Cyclin dependent kinase
inhibitor 2A/2B
G1 control, interacts with p53
Associated with Type 2 diabetes140 Gestational diabetes17 MI, CHD18
RASSF1 Ras associated domain
family member 1
Tumor suppressor function, induce cell cycle arrest through cyclin D1
CNNM2 Cyclin M2 Downregulated in mouse placenta
with hypoxia.141, 142 SBP.143
MDM2 p53 binding protein
homolog
G1 and apoptosis through interaction with p53
Associated with spontaneous miscarriage16 and subfertility144
CCNH Cyclin H G1/S and G2/M transition Associated with transplant
rejection145
GADD45A Growth arrest and
DNA-damage-inducible, alpha
Respond to stress by activating inflammation and innate immunity
1.5 Evidence of Genetic Component
Preterm Birth
One of the stronger risk factors for preterm birth is a previous preterm pregnancy.33 In addition to the high risk of recurrence, twin studies suggest a heritability of 34% for birth timing.146 The genetic risk of preterm birth is complicated by the contributions of three genetic lineages -- maternal, paternal and fetal -- as well as the role of shared environment within a single woman or within her family of birth. Recent population based studies in Norway,12
Denmark13 and Sweden14 have attempted to assess the role of maternal genes in the outcome of preterm birth.
The study in Sweden14 used three generations to generate pairwise odds ratios between siblings and within siblings to assess familial aggregation. Modeling also allowed the estimation of maternal and fetal genetic effects and environmental effects of the couple, sibling
environment and non-shared environment. The Swedish study found an increased risk of preterm birth among sisters (OR 1.9, 95% CI 1.6, 2.2) but not among brothers or mixed sibling pairs. The increased risk among sisters could reflect maternal or fetal genetic effects or a shared sibling environment. The modeling of environmental as well as genetic effects suggested no role for shared sibling environment but a significant effect for maternal genes (25%), fetal genes (5%), couple environment (18%) and unshared environmental effects (52%). The effect of maternal genes was stronger in spontaneous preterm birth while the effect of fetal genes increased in medically indicated births.
In Denmark,13 Boyd identified women with a singleton birth between 1978 and 2004 and
31
Cohorts for each type of family history (personal, family, partner and partner family history) were constructed to assess the risk of preterm birth for each type of family history. While a woman with a previous preterm birth had an increased risk of subsequent preterm birth (RR 5.9, 95% CI 5.7, 6.1), having a partner with a previous preterm birth (with a different woman) did not increase her risk (OR 1.1, 95% CI 1.0, 1.2). Family history of preterm birth was also associated with preterm birth. Women with a history of preterm birth among their mothers, full sisters or maternal half-sisters were 55% more likely to deliver preterm. There was no increased risk due to a preterm birth in a woman’s paternal half-sisters, female partners of the woman’s male relatives and any relation in the biological father’s family. In addition to documenting the high recurrence of preterm birth, this study suggests a strong heritable factor that is transmitted through female relatives. The paternal effect, which may also be considered an effect of fetal genes, was generally absent. The authors suggest that imprinting or mitochondrial genes may explain some of the distinctly female transmission seen. This study was unable to assess environmental risk factors.
The Norwegian study12 examined 2 generations of singleton births without preeclampsia for recurrence of preterm birth in a first birth among mothers and fathers born preterm themselves. While women born preterm had an increased risk of preterm birth in their first pregnancy (RR 1.5, 95% CI 1.4, 1.7), men born preterm had only a small increase in preterm birth for their first child (RR 1.1, 95% CI 1.0, 1.2). In women the association was stronger if she had been born in the early (<34 weeks) preterm period.
imprinted genes, mitochondrial genes and shared environmental factors has not been fully explored and may explain some of the patterns observed.
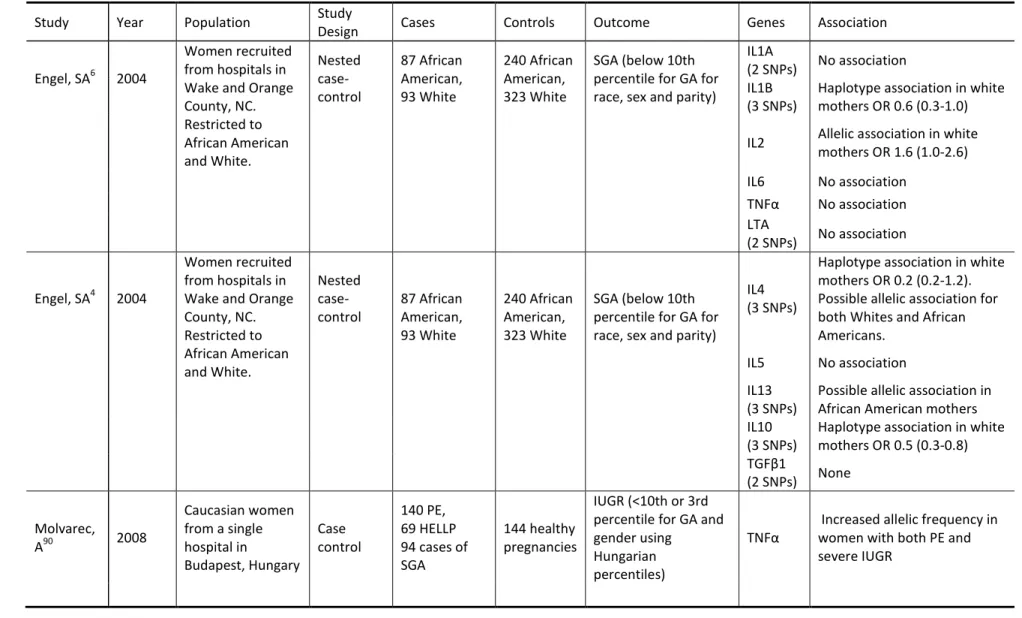
SGA
History of a previous SGA infant is a strong risk factor for SGA, and women who were born SGA themselves are more likely to have an SGA infant.15 Twin studies suggest a heritability of 34%. A population-based study in Sweden18 compared the risk of SGA between full and half siblings looking at sisters, brothers, sister-brother pairs and successive pregnancies within couples. The methods used allowed for the examination of maternal, fetal, couple environment, sibling environment and non-shared environment. Among full siblings there was a stronger effect among sisters (OR 1.8, 95% CI 1.7, 1.9) than among brothers or sister-brother pairs (OR 1.3, 95% CI 1.2-1.4). The association among brothers suggests a fetal genetic component, while the stronger association among sisters suggests an additional maternal genetic component. Among half-siblings there was only an association between sisters (OR 1.2, 95% 1.1, 1.4) although half-sisters were not classified by maternal or paternal sharing. An analysis of the discrete genetic and environmental components suggests that the fetal genetic effect explains 37% of the variance while the maternal genes explain an additional 9% (a total of 27.5%) while the couple environment (18%) and non-shared environment (36%) are also important.
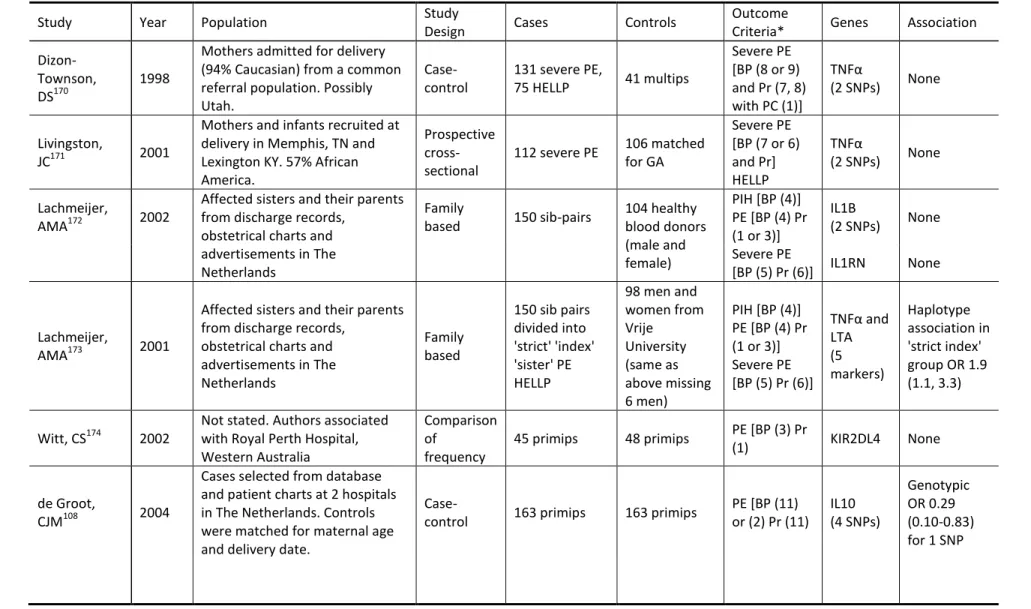
Preeclampsia
The genetic component of preeclampsia is complex due to the possible contributions of fetal, maternal and paternal genes.147 One twin study estimated the heritability of preeclampsia (54%) and gestational hypertension (24%), although the rarity of the outcome and the
33
A large population based study in Norway11 using two generations of birth certificate data showed that both a maternal and a fetal mode of transmission is implicated in preeclampsia. Women who had been born in a pregnancy complicated by preeclampsia had an increased risk of preeclampsia in their own pregnancies (OR 2.2, 95% CI 2.0, 2.4). Men who had been born in a pregnancy complicated by preeclampsia also had an increased risk of fathering a pregnancy complicated by preeclampsia (OR 1.5, 95% CI 1.3, 1.7). While the women could be expressing genes in a maternal or fetal pathway, fathers can only contribute to the fetal pathway. In addition, siblings from normal pregnancies in families with a history of preeclampsia were also examined. The sisters in this situation could possess maternal genes but not fetal genes, and the brothers could also possess the maternal gene but this would not contribute to the
preeclampsia risk in their partner. The findings supported the hypothesis of a dual genetic pathway, with the sisters having an increased (but attenuated) risk for PE (OR 2.0, 95% 1.7, 2.3) and the brothers having no increase in risk (OR 1.1, 95% CI 0.9, 1.4).
suggested that each outcome was a risk factor for the other. They estimated that the genetic component of preeclampsia is approximately 30%.
Both studies note the possible role of shared environmental risk factors, in particular obesity and smoking. The Swedish study was able to model shared environment under a strong assumption regarding family dynamics and found that shared environmental factors were not significant. However the possibility for shared environment playing a role in the apparent heritability of gestational hypertension is still possible.
These studies suggest that both preeclampsia and gestational hypertension have genetic causes. Although it is clear that there are both fetal and maternal components to the genetic risk, the maternal portion is substantial.
Summary
The studies of heritability in preterm birth, SGA and GHTN suggest that a genetic etiology is plausible. While preterm birth shows a predominately maternal genetic effect, both SGA and PE suggest the addition of a fetal genetic effect. Given the role of fetal genes in the development of the placenta, the presence of a fetal genetic effect in SGA and PE is not surprising. Reproductive outcomes must always consider the role of three distinct genetic contributions- maternal, fetal and paternal. While this study only has access to maternal DNA, the maternal genetic effect is substantial enough in all three outcomes to consider the maternal effect in isolation.
1.6 Review of Genetic Epidemiologic Studies
Compared with cancer or cardiovascular outcomes, genetic epidemiologic studies in
35
genetic evolution, large-scale reproductive cohorts similar to the genetic cohorts for chronic disease do not exist. Most of the reproductive epidemiology studies looking at PE or preterm birth have been small, with fewer than a few hundred cases. The genes used in these studies have often been limited to a few SNPs for a few genes, with only a couple of studies using a larger, candidate gene approach. One of the difficulties that the existing studies share with almost all diseases is the definition of the outcome of interest. For preeclampsia, although guidelines exist for diagnosis, many studies use different classification or exclusion criteria, resulting in phenotypes that vary from study to study. Given the differences in allelic
frequencies among groups of different genetic ancestry, existing studies from Europe or South America may not be generalizable to US populations. Given these difficulties, the current study will be able to add to what is currently known about genetic determinants of adverse pregnancy outcome. Given the size of the study population, the depth of the genetic panel, and the
inclusion of US Whites and African Americans, this study is well positioned to advance the knowledge of these important outcomes.
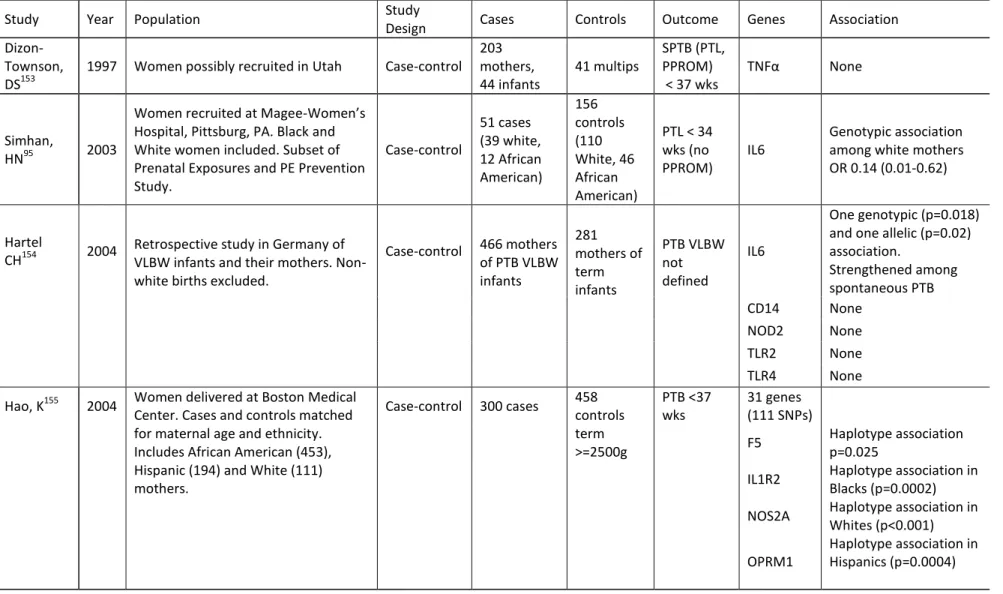
Preterm Birth
A search of the Genetics Association Database ( http://geneticassociationdb.nih.gov/cgi-bin/index.cgi) as well as a review of PubMed revealed 20 genetic epidemiology studies that considered preterm birth as an outcome. The review was limited to studies that considered maternal DNA and had included at least one gene in the inflammatory pathway. The studies revealed quite a bit of heterogeneity with the outcome of interest with respect to the timing of preterm birth, the subtypes of preterm birth (preterm labor, PPROM, indicated delivery) included and the genetic ancestry of the populations studied. Most studies were small (largest had 300 cases and most had fewer than 200 cases) and the findings of early studies did not always replicate in subsequent studies. Table 1.6 has an overview of all the studies.
Overall IL6, IL6R, TNFα (with or without LTA) and its receptors TNFR1 and TNFR2, IL1A, IL1B, IL1RN, IL5 and TGFβ1 showed the most consistent associations with preterm birth. Genetic associations often varied between White and African-American mothers, with each population showing different associations when stratified.
37
Table 1.6 Review of Genetic Epidemiology Studies of Preterm Birth
Study Year Population Study
Design Cases Controls Outcome Genes Association
Dizon-Townson, DS153
1997 Women possibly recruited in Utah Case-control 203 mothers, 44 infants 41 multips SPTB (PTL, PPROM) < 37 wks
TNFα None
Simhan,
HN95 2003
Women recruited at Magee-Women’s Hospital, Pittsburg, PA. Black and White women included. Subset of Prenatal Exposures and PE Prevention Study. Case-control 51 cases (39 white, 12 African American) 156 controls (110 White, 46 African American)
PTL < 34 wks (no PPROM)
IL6
Genotypic association among white mothers OR 0.14 (0.01-0.62)
Hartel
CH154 2004 Retrospective study in Germany of VLBW infants and their mothers. Non-white births excluded.
Case-control 466 mothers of PTB VLBW infants 281 mothers of term infants PTB VLBW not defined IL6
One genotypic (p=0.018) and one allelic (p=0.02) association.
Strengthened among spontaneous PTB CD14 None
NOD2 None TLR2 None TLR4 None
Hao, K155 2004 Women delivered at Boston Medical Center. Cases and controls matched for maternal age and ethnicity. Includes African American (453), Hispanic (194) and White (111) mothers.
Case-control 300 cases 458 controls term >=2500g PTB <37 wks 31 genes (111 SNPs)
F5 Haplotype association p=0.025
IL1R2 Haplotype association in Blacks (p=0.0002)
NOS2A Haplotype association in Whites (p<0.001)
OPRM1
38
Study Year Population Study
Design Cases Controls Outcome Genes Association
Annells,
MF105 2004 Women with a previous preterm birth from North Adelaide, Australia. All of European descent.
Case-control 202 cases 185 term, no history of PTB SPTB (PTL, PPROM) <35 wks TNFα (3 SNPs) Haplotype association with early PTB OR 2.4 (1.1-5.5)
IL1A None IL1B
(2 SNPs) None
IL4
Genotypic association with early PTB OR 3.4 (1.2-9.6)
IL10 (3 SNPs)
Haplotype association with early PTB OR 2.1 (1.0-4.1) with a strengthening seen for PPROM
TGFβ1
(2 SNPs) None MBL2
(5 SNPs)
Allelic association with early PTB 2.3 (1.1-5.0) IL6 None
IL1RN None IL1R1 None TNFRSF6
(2 SNPs) None
Engel, SA6 2004
Women recruited from hospitals in Wake and Orange County, NC. Restricted to African American and White. Nested case-control 67 African American, 69 White 238 African American, 336 White SPTB (PTL, PPROM) < 37wks IL1A (2 SNPs)
Association in white mothers OR 1.8 (0.9-3.7)
IL1B (3 SNPs)
Association in white mothers for 2
haplotypes OR 1.7 (0.9-3.2) and OR 2.1 (0.9-5.2)
39
Study Year Population Study
Design Cases Controls Outcome Genes Association
IL6
Association in both Whites and African Americans
TNFα Association in white mothers OR 2.9 (0.9-4.0)
LTA (2 SNPs)
One SNP showed an increased risk of PTB in white mothers OR 2.6 (1.3-5.5)
TNFα/LTA
Association in white mothers for two haplotypes OR 1.5 (0.8-2.6) and OR 1.6 (0.9-2.9)
Engel, SA4 2005
Women recruited from hospitals in Wake and Orange County, NC. Restricted to African American and White. Nested case-control 67 African American, 69 White 238 African American, 336 White SPTB (PTL, PPROM) < 37wks IL4 (3 SNPs)
Haplotype association in African American mothers OR 2.9 (1.2-7.4)
IL5
Possible association in white mothers
combined in haplotype with IL13 OR 0.5 (0.3-1.0)
IL13 (3 SNPs)
Haplotype association in African American mothers OR 2.7 (1.0-7.2) IL10
(3 SNPs) None
TGFβ1 (2 SNPs)