The Long Arm of the Larva:
Evolutionary Responses to Resource Availability
Justin S. McAlister
A dissertation submitted to the faculty of the University of North Carolina at Chapel Hill in partial fulfillment of the requirements for the degree of Doctor of Philosophy in the
Department of Biology
Chapel Hill 2007
Approved by:
Advisor: Joel G. Kingsolver, PhD.
Reader: Amy L. Moran, PhD. Reader: William M. Kier, PhD.
ABSTRACT
JUSTIN S. MCALISTER: The Long Arm of the Larva: Evolutionary Responses to Resource Availability
(Under the direction of Joel G. Kingsolver, Ph.D.)
How do organisms adapt to environmental heterogeneity? We know that organisms can respond to environmental heterogeneity by expressing phenotypes that are either phenotypically plastic or constant. However, which strategy of phenotypic expression (plasticity versus constancy) will evolve depends on many factors including: the fitness costs of a given strategy, the degree of environmental heterogeneity, and the degree of association among other life history traits that are also evolving to maximize organismal fitness. Food resource availability is an environmental parameter that is frequently heterogeneous. Echinoid echinoderm larvae are one group of organisms, among many, that have been demonstrated to modify the expression of food collection structures depending on food availability. In my dissertation I examined how the aforementioned factors are associated with the evolution of plastic or constant expression of food collection structures using larval echinoids as a model system.
that plasticity is inexpensive or that costs of plasticity are difficult to detect.
ACKNOWLEDGEMENTS
It is an uncommon situation for one to have had as many advisors as committee members; however I am fortunate to have had this situation. Despite the difficulties it has presented, I have benefited greatly as a scientist because of it: I have developed
independence, I have become self-reliant, I have overcome adversity, and I have learned how to push my research forward. In short, I have managed to turn crisis into opportunity. For allowing me to find my way I would like to thank my advisors: Joel Kingsolver, Amy Moran, and Bob Podolsky. Each of you has contributed your unique skills towards my academic development and I thank you sincerely for your time, patience, intellectual insight,
encouragement, and good cheer. I have also enjoyed interacting with the other members of my doctoral committee: Bill Kier, David Pfennig, and Todd Vision. Thank you for your critical comments, which helped to improve my work. Thanks as well to Ken Lohmann, Peter Marko, and Pat Pukkila, who all had a hand in shaping me as a researcher and as an academician. Thank you to Haris Lessios for welcoming me into your lab and your home and for providing me with a wonderful opportunity to conduct research in Panama.
(Fitzhenry) Holtz and Sarah Diamond for being enthusiastic and supportive lab sisters. They say we get by with a little help from our friends and I’m fortunate to have had many here in the Department. I would like to say a sincere “thank you” for all the things that each of the following people have done to help me personally and professionally over the years. Thank you to: Ted Uyeno, Larry Boles, Mike Baltzley, George Harper, Matt
Fuxjager, Lisa Mangiamele, Brian Eastwood, Joe Thompson, Jennifer Taylor, Amber Rice, Ryan Martin, Marty Ferriss, Jen Kniess, Tatiana Vasquez, Mike Loeb, and Allison Welch.
I would also like to thank the following individuals for the various ways they’ve aided me in my research endeavors at UNC, STRI, LIRS, IMS, and DML: Deepti Damle, Katy Flinn, Lisa Stevens, Rachel Katz, Qian Qin, Laura Ruble, Kristine Shaffer, Dave Keith, Chris Shields, Anna Wilson, Bryony Hazell, Johanna Madr, Kirsty Kemp, Liz Hawkins, Lucy Haycock, Rachel Collin, Juan Mate, Axel Calderon, Ligia Calderon, Laura Geyer, Edgardo Ochoa, Steve Vollmer, Lyle Vail, Anne Hoggett, Marianne Pearce, Lance Pearce, Glenn Safrit, Hsin-Drow Huang, and the Staff of the Department of Biology at UNC-CH.
To my family, the McAlisters, Ruberrys, and Truexes: Thank you for your love, support, and encouragement.
To Steve Stancyk: Thank you for being my mentor and for guiding me through the trials, tribulations, and triumphs of academia.
“We sat on a crate of oranges and thought what good men most biologists are, the tenors of the scientific world – temperamental, moody, lecherous, loud-laughing, and healthy. Once in a while one comes on the other kind – what used in the universities to be called a ‘dry-ball’ – but such men are not really biologists. They are the embalmers of the field, the picklers who see only the preserved form of life without any of its principle. Out of their own crusted minds they create a world wrinkled with formaldehyde. The true biologist deals with life, with teeming boisterous life, and learns something from it, learns that the first rule of life is living. The dry-balls cannot possibly learn a thing every starfish knows in the core of his soul and in the vesicles between his rays. He must, so know the starfish and the student biologist, who sits at the feet of living things, proliferate in all directions. Having certain tendencies, he must move along their lines to the limit of their potentialities. And I have known biologists who did proliferate in all directions: one or two have had a little trouble about it. Your true biologist will sing you a song as loud and off-key as will a blacksmith, for he knows that morals are too often diagnostic of prostatitis and stomach ulcers. Sometimes he may proliferate a little too much in all directions, but he is as easy to kill as any other organism, and meanwhile he is very good company, and at least he does not confuse a low hormone productivity with moral ethics.”
TABLE OF CONTENTS
LIST OF TABLES………...…xi
LIST OF FIGURES……….……xii
LIST OF ABBREVIATIONS………xiii
CHAPTER 1. INTRODUCTION………..….1
Background………....……2
Environmental heterogeneity………...2
Costs of phenotypic plasticity………..6
Food resource availability and the expression of phenotypic plasticity…..7
Food resource availability and the evolution of phenotypic plasticity…..10
Feeding structures in planktonic larvae………...….11
Summary of Experiments...……….13
Significance……….…15
2. COSTS OF PHENOTYPIC PLASTICITY DURING LARVAL DEVELOPMENT OF THE SEA URCHIN LYTECHINUS VARIEGATUS (LAMARCK) Summary……….……17
Introduction……….……18
Materials and Methods……….…...21
CONSTANT PHENOTYPES.
Summary……….………43
Introduction……….………44
Materials and Methods……….………...48
Results……….………58
Discussion……….………..73
4. EGG SIZE AND THE EVOLUTION OF PLASTICITY IN LARVAE OF THE ECHINOID GENUS STRONGYLOCENTROTUS. Summary……….………83
Introduction……….…………84
Materials and Methods……….……...88
Results……….……94
Discussion……….104
Table 2.1 ANOVA results for 29 full-sib half-sib families……….29
Table 3.1 Initial mean egg diameters of Central American echinoids………....…52
Table 3.2 ANOVA results for all Caribbean versus all Pacific larvae………...….59
Table 3.3 ANOVA results for separate geminate species pair comparisons………..…66
Table 3.4 Least square mean estimates of ln (relative arm length) by species………...68
Table 3.5 ANOVA results for Ec. viridis versus Ec. vanbrunti food limitation analysis...…72
Table 4.1 ANOVA results for full vs. whole vs. half-sized S. franciscanus larvae………....97
Table 4.2 ANOVA results for S. franciscanus versus S. purpuratus larvae…...………98
Figure 1.1 Fixed and phenotypically plastic reaction norms………5
Figure 2.1 Low and high fed Lytechinus variegatus larvae………24
Figure 2.2 Low and high fed Lytechinus variegatus arm lengths over time…………...……30
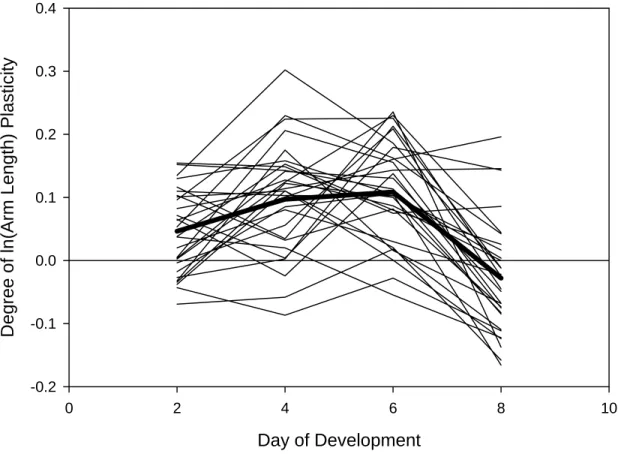
Figure 2.3 Degree of plasticity for 29 larval families over time……….……32
Figure 2.4A Total energy content as a function of arm length………...…35
Figure 2.4B Stomach length as a function of arm length………35
Figure 2.5A Energy content fitness residuals versus degree of plasticity………..…37
Figure 2.5B Stomach length fitness residuals versus degree of plasticity………..……37
Figure 3.1 Map of the Republic of Panama………50
Figure 3.2 Low fed D. antillarum, Ec. viridis, and Eu. thouarsi on Day ………..……54
Figure 3.3A Low and high fed Echinometra sp. arm lengths over time……….…61
Figure 3.3B Arm length versus body length for Echinometra sp.………..………61
Figure 3.4A Low and high fed Diadema sp. arm lengths over time………...……63
Figure 3.4B Arm length versus body length for Diadema sp.………63
Figure 3.5A Low and high fed Eucidaris sp. arm lengths over time………..……65
Figure 3.5B Arm length versus body length for Eucidaris sp.………...………65
Figure 3.6A Arm length versus body length for food limited E. viridis ………71
Figure 3.6B Arm length versus body length for food limited E. vanbrunti………71
Figure 4.1 Low fed S. franciscanus and S. purpuratus larvae from different size eggs….…92 Figure 4.2 Full and half size Strongylocentrotus sp. arm lengths over time……….100
AL anterolateral arm length
ANOVA analysis of variance
ASW artificial seawater
BL body length at midline
C Celsius
CaMg-FSW calcium and magnesium free seawater
d day
FE fertilization envelope
Fig Figure
FSW filtered seawater
h hours
l liters
min minutes
ml milliliters
mm millimeters
PO postoral arm length
SL stomach length
µl microliters
µm micrometers (microns)
CHAPTER ONE INTRODUCTION
Organisms do not live in a vacuum; they have an intricate relationship with the environment(s) in which they reside. Organisms produce phenotypes that facilitate
interaction with their environments. The expression of a given phenotype hinges in part on the genetic programming for that particular phenotype, but also on the organism’s ability to incorporate specific information about the quality of the environment. To ensure the
model system.
Background
Environmental heterogeneity
Environments routinely change and organisms often experience these changes in spatial and/or temporal patches. Although the magnitude of patch size is usually unknown, the degree of patch heterogeneity, i.e. the amount of environmental change, experienced by an organism can often be predicted. This predictability in patch heterogeneity is referred to as the grain of the environment (Levins, 1968). Environmental grain is organism specific; the same environment may be differently grained to different organisms. Environmental grain is also variable specific: a single organism may experience different environmental variables at different grains. An organism that experiences no heterogeneity exists in an environment that is coarse-grained. Alternatively, organisms that experience differing degrees of environmental heterogeneity do so at fine grain. The grain at which an organism experiences environmental heterogeneity influences the ecological strategy that organism assumes to cope with change.
probabilistically, whereas phenotypically plastic strategists produce alternative phenotypes depending on the environment. The benefits of adopting one strategy over another are variable and there has been considerable theoretical work on these strategies (Levins, 1968; Lively, 1986; van Tienderen, 1991, 1997; DeWitt & Langerhans, 2004; see reviews by Wilson & Yoshimura, 1994, and Kassen, 2002). Sensu DeWitt & Langerhans (2002), bet-hedging is not necessarily a unique strategy because it can be thought of simply as adding variance to any of the other three strategies. For this reason, only specialization,
generalization, and phenotypic plasticity are distinct ecological strategies for coping with environmental heterogeneity.
Of these three strategies, phenotypic plasticity may seem unbeatable in heterogeneous environments. An organism possessing the ability to consistently develop environment-specific phenotypes should be favored by natural selection (Schmalhausen, 1949; Bradshaw, 1965). However, this statement fails to incorporate the fact that with differing environmental grain, different strategies may have varying effects on organismal fitness (Pigliucci, 2001). For example, if an organism experiences primarily coarse-grained environmental
environment interaction variance for fitness among ecologically similar individuals (Kassen, 2002).
Assuming these variances exist, researchers have developed models for the evolution of ecological strategies using the reaction norm concept (Via and Lande, 1985; van
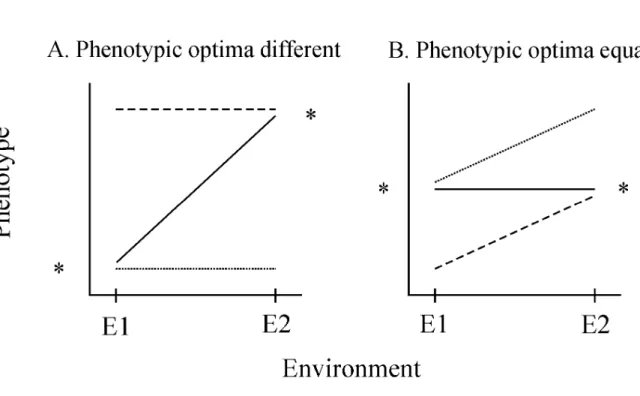
Tienderen, 1991; Gomulkiewicz & Kirkpatrick, 1992; Kisdi et al., 1998; Pigliucci & Murren, 2003). Simple, two environment reaction norms are graphical representations that depict the range of phenotypic values produced by genotypes across environments. Reaction norms can have either no slope or some degree of positive or negative slope. When the optimal
phenotypic values in the two environments differ, a specialist genotype is one that produces an optimal phenotype in one environment, and the same, albeit sub-optimal phenotype in the second environment. In this scenario a specialist will exhibit a reaction norm with no slope. However, a genotype that produces near-optimum phenotypic values in both environments is a generalist and will exhibit a sloped reaction norm (Figure 1.1A). Alternatively, when the optimal phenotypic values in the two environments are equal, a generalist genotype is one that produces near-optimum phenotypes across environments. In this second scenario, a generalist will exhibit a reaction norm with no slope. However, a genotype with a sloped reaction norm is a specialist because it produces an optimum phenotype in only one of the environments (Figure 1.1B).
the evolution of phenotypic plasticity were based on a two environment scenario with different optima (Via and Lande, 1985; Moran, 1992), whereas the production of constant phenotypes has often been ascribed to specialization. In both situations however, there exist genotypes that produce the same phenotype across environments, and genotypes that produce different phenotypes across environments. I consider therefore, that organisms can evolve one of two unique strategies for the expression of a phenotype: plasticity and constancy.
Costs of phenotypic plasticity
In most biological systems, individuals rarely produce phenotypes that optimally match the degree of environmental heterogeneity (Levins, 1968). One reason for incomplete phenotype-environment matching is that possessing the ability to change one’s phenotype, i.e. being phenotypically plastic, may be inherently costly (Bradshaw, 1965; van Tienderen, 1991; DeWitt, 1998; DeWitt et al., 1998; Scheiner & Berrigan, 1998; Tucić et al., 1998; Dorn et al., 2000; van Kleunen et al., 2000; Tucić & Stojković, 2001; Agrawal et al., 2002; Poulton & Winn, 2002; Relyea, 2002; Steinger et al., 2003). By definition, a cost of phenotypic plasticity is incurred when more-plastic genotypes are comparably less fit than less-plastic or constant genotypes when producing the same phenotype in a given
evolution of phenotypic plasticity (Via and Lande, 1985; Lively, 1986; Via, 1987; van Tienderen, 1991, 1997; Gomulkiewicz & Kirkpatrick, 1992; Moran, 1992; Leon, 1993; Padilla & Adolph, 1996). Generally these models predict that adaptive phenotypic plasticity will evolve under four conditions (as outlined by Relyea, 2002): (1) the fitness of alternative phenotypes is affected by the degree of environmental heterogeneity a population
experiences, i.e. the environmental grain as discuss above; (2) the cues that an organism uses to detect environmental quality or state are reliable; (3) there are no optimal phenotypes that confer superior fitness in all environments; and (4) the costs of phenotypic plasticity are relatively low. Despite the prominent position of costs of phenotypic plasticity in these models and careful research to test for costs using a variety of biological systems, the detection of overwhelming evidence for ubiquitous costs of phenotypic plasticity has been elusive. In general, empirical results have demonstrated that plasticity costs are either absent (Scheiner & Berrigan, 1998; Tucić & Stojković, 2001; Relyea, 2002), infrequent (Dorn et al., 2000), or are negligible in scale and/or limited to specific traits in particular environments (DeWitt, 1998; Tucić et al., 1998; Dorn et al., 2000; van Kleunen et al., 2000; Agrawal et al., 2002; Poulton & Winn, 2002; Relyea, 2002; Steinger et al., 2003). None of these studies however, have focused on measures of phenotypic plasticity that result from changes in food resource levels.
Food resource availability and the expression of phenotypic plasticity
The level of food resources available to an organism is an environmental
other genotypes may express less-plastic or constant phenotypes. The availability of food resources can be defined in terms of the magnitude (the mean) and the variability (the variance) of the resource. The expression of phenotypic plasticity has been demonstrated across a wide range of taxa in response to across-environment differences in both of these parameters.
An association between resource level magnitudes with the expression of phenotypic plasticity has been demonstrated for life history traits. These traits include the age and size at metamorphosis of larval anurans (Wilbur and Collins, 1973; Smith-Gill and Berven, 1979; Alford and Harris, 1988; Hensley, 1993; Leips and Travis, 1994; Beck, 1997; Newman, 1998; Nicieza, 2000; Doughty, 2002), pitcher plant mosquitoes (Bradshaw and Johnson, 1995), copepods (Twombly, 1996), gastropod molluscs (Pechenik et al., 1996), barnacles (Hentschel and Emlet, 2000), polychaete annelids (McEdward and Qian, 2001), mud crabs (Suprayudi et al., 2002), and damselflies (Johansson et al., 2001), and similarly for the age and size to maturity of Daphnid crustaceans (Reinikainen and Repka, 2003).
(e.g. protein content) of the food resource.
In invertebrate systems, empirical research has demonstrated that diet induces changes in the shape of snail radular teeth (Padilla, 2001), in insect jaw morphology (Bernays, 1986; Greene, 1989; Thompson, 1992), and in the shape of crustacean chelae (Smith and Palmer, 1994). Research in filter-feeding bivalves has shown that the ratio of gill-to-labial palp mass changes with the degree of sediment coarseness (Drent et al., 2004). Drent et al.’s (2004) study represents an area of research that has demonstrated
morphological (Pfennig, 1990, 1992; Piersma and Lindstrom, 1997; Stark, 1999; Dekinga et al., 2001; McWilliams and Karasov, 2001; Piersma and Drent, 2003; Relyea and Auld, 2004) and enzymatic (Bock and Mayer, 1999) changes in the alimentary canal of both vertebrates and invertebrates in response to changes in food conditions.
The association of variability of resource levels with the expression of phenotypic plasticity has not been examined as broadly. However, theoretical results suggest that longer-term predictable variations in resource level (e.g. seasonal fluctuations) can have effects on life history (Cohen, 1967; Levins, 1968; Fretwell, 1972; Colwell, 1974).
Empirical work indicates that resource level variability can influence behavior in zebrafish (Grant and Kramer, 1992) and convict cichlids (Grand and Grant, 1994), gut length plasticity and the differential allocation of resources to growth or reproduction in fathead minnows (Siems and Sikes, 1998), age and size at metamorphosis in spadefoot toad tadpoles
demonstrated in planktotrophic pluteus larvae from several species in the echinoderms (echinoids: Boidron-Metairon, 1988; Fenaux et al., 1988; Hart and Scheibling, 1988;
Strathmann et al., 1992; Hart and Strathmann, 1994; Eckert, 1995; Bertram and Strathmann, 1998; Heyland and Hodin, 2004; Miner and Vonesh, 2004; Reitzel and Heyland, 2007; asteroids: George, 1994, 1999; and ophiuroids: Podolsky and McAlister, 2005), molluscs (bivalves: Strathmann et al., 1993; and gastropods: Estrella Klinzing and Pechenik, 2000), and freshwater Daphnid crustaceans (Lampert, 1994; Reinikanen and Repka, 2003). These larvae depend on exogenous phytoplankton food, and in response to low food availability, can increase the length of the ciliated band used for collecting food. Echinoid and ophiuroid echinoderms accomplish this by growing longer larval arms; plasticity of ciliated band length is correlated with lengthening of skeletal arm rods in echino- and ophio-plutei. Increased ciliated band length enhances larval ability to capture phytoplankton, and increases in ciliated band length under low food conditions have been demonstrated to be adaptive because larvae with longer ciliated bands have greater maximum clearance rates (Hart and Strathmann, 1994). In addition, by increasing ciliated band length, the larval surface-to-volume ratio increases, which could increase intake of dissolved organic matter (Manahan et al., 1983). Plasticity in arm length has also been used as a measure of larval feeding history in the field (Strathmann et al., 1992).
However, increases in energetic investment to lengthen feeding structures in low food conditions result in a decreased energetic investment in the development of juvenile
(Thorson, 1950; Rumrill, 1990; Morgan, 1995). Selection will be strong for traits that ameliorate the effects of adverse feeding conditions (Doughty, 2002) by decreasing the duration of time larvae spend in the plankton. These traits are those associated with the utilization of energetic resources available to the larva from: 1) the exogenous food resources acquired from the larval feeding environment or 2) the endogenous energetic reserves
obtained from the parent.
Previous work indicates that arm length plasticity is expressed during early larval development (Boidron-Metairon, 1988; Hart & Scheibling, 1988; Eckert, 1995; Sewell et al., 2004), suggesting that larvae may utilize endogenous resources for the initial production of food collecting structures, then move to exogenous resources for the development of other, later-appearing structures. Endogenous resources are provided to individual offspring within the egg and egg size is positively correlated with the level of investment (Jaeckle, 1995). Herrera et al. (1996) have demonstrated variation in feeding period with egg size;
development time to metamorphosis is inversely related to egg size among various echinoid species. The capacity for plasticity of arm length early in development may therefore depend on the amount of maternally provisioned energetic reserves, and thus on egg size (Herrera et al., 1996).
benefits, I have used this system in my dissertation research to examine how organisms adapt to environmental variation. More specifically, my empirical research investigate the fitness costs for one resource acquisition strategy, phenotypic plasticity; examines whether historical changes in resource levels are associated with the repeated evolution of plastic or constant phenotypes; and investigates whether the evolution of a trait is correlated with the evolution of other life history traits, i.e. is the evolution of feeding structure (larval arm length)
plasticity correlated with evolved differences in the amount of endogenous energetic materials available to a developing larva. I summarize these efforts briefly below.
Summary of Experiments
The dissertation research is divided into three sections, contained in Chapters II, III, and IV. Chapter II is an investigation of the fitness costs of phenotypic plasticity. Twenty-nine full-sib half-sib families of larvae of the echinoid Lytechinus variegatus were reared under replicated high food or low food conditions for two weeks. Morphological
associated with the repeated evolution of plastic or constant phenotypes. Larval development of three echinoid “geminate species pairs,” formed when previously continuous species were separated before or during the raising of the Isthmus of Panama 2.8-3.1 million years ago, were examined in this study. Three of the echinoid species, Diadema mexicanum,
Echinometra vanbrunti, and Eucidaris thouarsi, were collected from the heterogeneous (with respect to phytoplankton food for larvae) waters of the eastern Pacific Ocean. Their
geminate counterparts, Diadema antillarum, Echinometra lucunter, Echinometra viridis, and Eucidaris tribuloides, were collected from the constantly low, oligotrophic waters of the western Caribbean Sea. Multiple full-sib families of larvae from all seven species were reared under replicated high food or low food conditions for approximately 10 days. Morphological measurements of arm length and body length were collected on days 2, 3, 4, 5, 6, 8, and 10 post-fertilization. The degree of phenotypic plasticity of arm length relative to body length was calculated for larvae from each family for each day.
Chapter IV examines whether the degree of expression of feeding structure (larval arm length) plasticity is correlated with differences in the size of the egg. Larvae from the congeneric sea urchins Strongylocentrotus franciscanus and Strongylocentrotus purpuratus, which differ in egg volume by 5-fold, were used in this study. In addition, the egg size of S. franciscanus (the larger-egged species) was experimentally manipulated by separating
blastomeres, a simple embryological protocol, at the 2-cell stage to produce half-sized larvae. Normal-sized and half-sized larvae were reared under replicated high food or low food
each species and treatment for each day.
Significance
My dissertation research has produced significant additions to our understanding of the evolution of the strategies used to express feeding structures in larval echinoderms. First, using the echinoid Lytechinus variegatus I demonstrate marginally significant genetic
variation of larval arm length plasticity in response to food limitation for this species. Genetic variation of plasticity is an underlying requirement for adaptation, and facilitates the evolution of varied responses to food limitation among close relatives that occupy habitats which differ in food availability. Indeed, the number of known, genetically distinct families reared in this experiment represents an approximately 10-fold increase in the number of known sib-ships used in any previous study of larval development in marine invertebrates. Arm length and plasticity of arm length did not correlate with either of the two fitness
measures (total energy content and stomach length) I collected however; thus, I did not detect a cost of plasticity. The results of this study contribute to a growing body of evidence that costs of plasticity are absent or are difficult to detect.
of an adverse feeding environment, e.g. egg size, that may supersede selection on feeding structures? Caribbean species in my studies did grow longer larval arms relative to body size than Pacific species, regardless of food level treatment, however. These results are the first to demonstrate that differences in the evolution of constant phenotypes can occur repeatedly across taxa.
Third, the results of the egg size manipulation and comparative larval growth experiments with species of Strongylocentrotus indicate that egg size affects larval arm length plasticity; larger eggs produce more-plastic larvae both in an experimental and a comparative context. However, evolved differences in the pattern of plasticity expressed by each species over time can not be accounted for by changes in egg size alone. These results provide insight into the related question of whether changes solely in egg size are sufficient to induce an evolutionary transition from feeding (planktotrophic) to non-feeding
CHAPTER TWO
COSTS OF PHENOTYPIC PLASTICITY DURING LARVAL DEVELOPMENT OF THE SEA URCHIN LYTECHINUS VARIEGATUS (LAMARCK)
Summary
Introduction
In order to increase fitness, many organisms change the expression of a phenotype in response to environmental cues, a process known as adaptive phenotypic plasticity.
However, organisms rarely express phenotypes that are optimal for all environments (Levins, 1968). One potential reason for the expression of sub-optimal phenotypes is that adaptive phenotypic plasticity may be inherently costly (Bradshaw, 1965; van Tienderen, 1991; DeWitt et al., 1998). Costs of plasticity can be associated with the maintenance and production of a phenotype, with acquiring information about the environment, with developmental instability in producing a phenotype, or with genetic correlations between plasticity and genes conferring low fitness (DeWitt et al., 1998). Such costs of phenotypic plasticity would be demonstrated if more-plastic genotypes were less fit than less-plastic genotypes when they produced the same phenotype in a given environment (DeWitt et al., 1998).
empirical studies have tested for costs of phenotypic plasticity in marine invertebrates or for morphological changes of feeding structures in response to changes in food availability.
Morphological phenotypic plasticity in response to food availability has been demonstrated in planktonic pluteus larvae from several species in the echinoderm classes Echinoidea (Boidron-Metairon, 1988; Fenaux et al., 1988; Hart & Scheibling, 1988; Strathmann et al., 1992; Hart & Strathmann, 1994; Eckert, 1995; Sewell et al., 2004) and Ophiuroidea (Podolsky & McAlister, 2005). These larvae consume phytoplankton, and in response to low food availability they grow longer arms, thereby increasing the length of the ciliated band used for food collection. An increase in larval arm and ciliated band length enhances the ability of larvae to capture phytoplankton, a response that is adaptive under limiting food conditions because larvae with longer arms and ciliated bands clear food from suspension at greater maximum rates (Hart & Strathmann, 1994). In addition, an increase in surface area generated by longer arms could increase the uptake of dissolved organic matter (Manahan et al., 1983). For these reasons, arm length has been used as an indicator of larval nutritional history in the field, and plasticity of feeding structures may be important in the recurrent evolution of non-feeding larvae (Strathmann et al., 1992).
Plasticity of larval feeding structures hinges on a trade-off in investment between larval and juvenile structures: increased investment in arms can result in decreased investment in other structures, such as the juvenile rudiment. As noted, this response can enhance feeding under low food conditions (Hart, 1994) and reduce time to metamorphosis (Boidron-Metairon, 1988). Reducing development time can be an important survival
larvae of retaining the ability to be phenotypically plastic, for example the additional costs of producing longer arms beyond what a non-plastic genotype would have to invest (i.e. excess production costs sensu DeWitt et al., 1998), could counter the theoretical benefits and thereby constrain the evolution of plasticity.
The planktotrophic pluteus larvae of many echinoids provide an ideal system for testing for costs of plasticity. Gametes can be fertilized externally to produce multiple
genetic families, and large numbers of larvae can be reared easily in a small laboratory space. Previous work indicates that larval arm length plasticity is expressed in some species during early larval development (Boidron-Metairon, 1988; Hart & Scheibling, 1988; Hart &
Strathmann, 1994; Eckert, 1995; Sewell et al., 2004; Podolsky & McAlister, 2005). Thus data on larval arm length and plasticity can be collected in a short period of time (1-2 weeks post-fertilization for most species), allowing for the rearing of a large number of genetic families using successive experimental blocks.
In this study, I investigated whether costs are associated with the expression of phenotypic plasticity of feeding structures in larvae of the sea urchin Lytechinus variegatus. I predicted that families with a greater capacity for expression of plasticity (across
Materials and Methods
Adults of the sea urchin Lytechinus variegatus were collected in May 2004 by dredging from a sub-tidal population located off the coast of Morehead City, NC. The urchins were placed in disposable plastic containers (3-4 urchins per container) filled with a small amount of seawater. The containers holding urchins were stacked in a cooler and transported to Chapel Hill, NC where the urchins were maintained in recirculating aquaria filled with artificial sea water (ASW: Instant Ocean, Aquarium Systems). Adult urchins were fed carrots ad libitum for the duration of the experiment, which was approximately 6 weeks.
Larval Culture
Gametes were obtained from adult urchins by peristomial injection into the body cavity of approximately 1 ml of 0.5 M KCl. Eggs were collected and washed once in ASW, and sperm were collected by mouth pipette and kept on ice until use. Gametes were used for controlled fertilizations in a 6 male by 2 female full-sib, half-sib breeding design that was replicated in 3 temporally separated blocks (similar to Newman, 1988) using each time different males and females to produce a total of 36 full-sib, half-sib families. This breeding design maximized the number of males, and thus the amount of additive genetic variation among families, given the space and time constraints associated with rearing multiple larval cultures. Due to larval mortality in one block, I obtained data from approximately 2½ of the blocks for a total of 29 full-sib, half-sib families. For each family, fertilized embryos and larvae were reared in one of two food environments (1 or 5 algal cells µl-1), with two
food-limiting and high, satiating conditions for echinoid larvae (Boidron-Metairon, 1988; Fenaux et al., 1988). Each larval culture was fed the unicellular alga Dunaliella tertiolecta (UTEX Algal Supply, Austin, TX) daily, starting at 24 h (all ages reported are post–fertilization). All cultures were reared in ASW in 1l plastic tri-pour beakers at densities of 1 larva ml-1 and water was changed every other day. The cultures were maintained in an environmental chamber at 25°C and were continually stirred with acrylic paddles at a rate of approximately 10 strokes min-1 to keep larvae and food in suspension (Strathmann, 1987). The alga was cultured at room temperature in autoclaved ASW enriched with a modified Guillard’s f/2 medium (Florida Aqua Farms, Inc.), and was re-suspended in fresh ASW before use.
Measures of Phenotype
Echinoid pluteus larvae are bilaterally symmetrical and possess a calcitic
endoskeleton, which includes two short body rods and four pairs of arm rods. As larvae mature, they initiate in succession and lengthen simultaneously pairs of arm rods. Depending on conditions, larvae can mature at different rates to reach different developmental stages (based on the number of arm pairs initiated) at a given age, creating the potential for confounding size and stage. However, all comparisons to detect a cost of plasticity were made among genotypes within a single environment, not between environments.
rod, the posterior tip of the larva, the tip of the oral hood (i.e. the mid-point of the soft-tissue that stretches between the pair of anterolateral arms), and points at the anterior and posterior ends of the stomach. To collect data from each larva, I used a digitizing tablet (Hyperpen 12000U, Aiptek Inc.) to capture x and y coordinates of morphological landmarks, while simultaneously obtaining z coordinates from a rotary encoder (U.S. Digital) coupled to the fine focus knob of a compound microscope (McEdward, 1985). Using these 3-D Cartesian coordinates, I reconstructed individual arm, body, and stomach lengths for each larva. Because the postorals and anterolaterals were the most prominent arms at the stages when I collected measurements, our analysis focuses on plasticity in the summed length of these arms (“total arm length”).
To assess the effects of arm length plasticity on fitness, I measured a proxy of fitness, energy content, on day 14. At this time high-fed larvae had initiated formation of the
Figure 2.1: Low- and high-fed Lytechinus variegatus larvae from the same family on day 4 showing morphological characters that I measured on days 2, 4, 6, and 8: AL = Anterolateral arm, PO = Postoral arm, BL = Body length at midline, SL = Stomach length. Both larvae are displayed at the same magnification; scale bar represents approximately 100 microns.
I examined a second performance measure involving a trade-off in energy allocation between larval arms and the size of the larval stomach. Miner (2005) detected this trade-off in 5-day old larvae of Strongylocentrotus franciscanus and S. purpuratus: high-fed larvae had shorter arms relative to their stomach length, a result of growth rather than distension by food. Miner (2005) suggested that larger stomachs with larger surface areas could increase assimilation rates in high-fed larvae, whereas longer arms could increase particle capture rates in low-fed larvae. In addition, the wall of the larval stomach can store lipids (Burke, 1981), which are used by juveniles during and after metamorphosis. For these reasons, I used measures of stomach length on day 8 as a second measure of investment related to fitness.
Statistical Analyses
I tested the effect of variation among genotypes (family), food level (food), culture replicate (culture), and day of development (day) on total arm length (sum of the postoral and anterolateral arms) using analysis of variance (PROC MIXED: SAS Institute, Cary, NC). The statistical model also included terms to account for variation due to the interactions of family with food, day with food, family with day, and the three-way interaction of family by food by day. Day was coded as a repeated measure with culture as the subject; the
culture was nested within family and food. I defined “plasticity” as a difference between food levels (low minus high) in total arm length (postoral plus anterolateral), and “adaptive plasticity” as a positive difference in this measure between low and high food levels, on any given day. Arm and body length values for individual larvae were natural log transformed prior to analysis to meet the assumptions of normality.
Previous studies have demonstrated that larval arm length plasticity is most apparent early in development (Boidron-Metairon, 1988; Hart & Scheibling, 1988; Hart &
Strathmann, 1994; Eckert, 1995; Sewell et al., 2004; Podolsky & McAlister, 2005). In a prior study on a different population of Lytechinus variegatus, adaptive plasticity was significant on day 4, but not when next measured on day 7 (Boidron-Metairon, 1988). To determine on what days of development low-fed larvae had longer arms than high-fed larvae (i.e., when adaptive plasticity was apparent), I calculated the mean across all 29 families of both the absolute difference in total arm length and the percentage difference (relative to their mean) between food treatments on each measurement day. Using these mean values, I determined the range of plasticity expressed across all families on days 2, 4, 6, and 8 and calculated an overall mean percent difference in arm length for each day.
plasticity would support the hypothesis of a cost of plasticity. Alternatively, a positive relationship, i.e. lower fitness for less-plastic genotypes, would be consistent with a cost of canalization or homeostasis for those traits (Dorn et al., 2000; Poulton & Winn, 2002). For each food level environment, I tested the regression coefficient from this analysis using a two-tailed significance test (SPSS, Inc. Chicago).
In addition to using fitness residuals, I also tested the hypothesis that fitness
(uncorrected for arm length) is correlated with arm length plasticity. I regressed family mean fitness (total energy content on day 14 or stomach length on day 8) against each family’s degree of plasticity, as calculated above. For each food level environment, I tested the regression coefficient from this analysis using a two-tailed test. Finally, in order to control for body size, I repeated each of the analyses described above using the arm to body length ratio, i.e. relative arm length (to correct arm length for body size), instead of absolute arm length.
Results
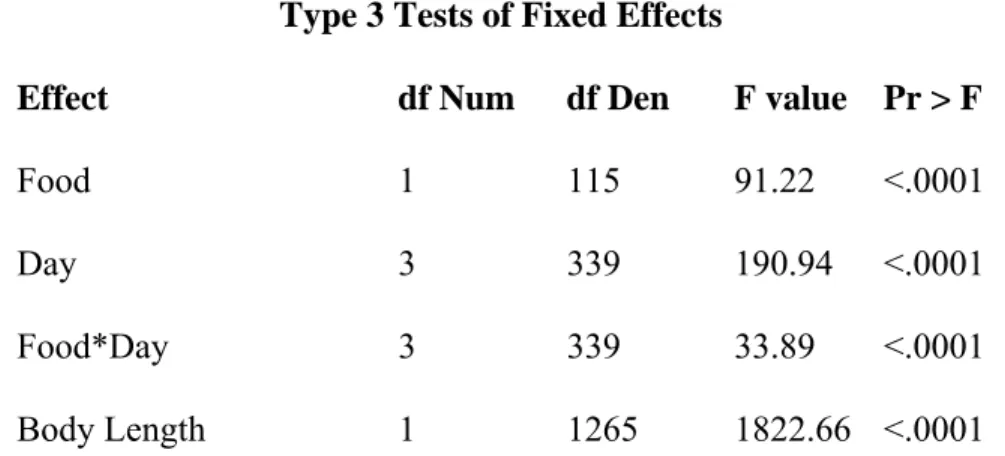
Table 2.1: Analysis of Variance (ANOVA) results among 29 full-sib half-sib families. Dependent variable is total arm length with body length as a quantitative covariate.
Type 3 Tests of Fixed Effects
Effect df Num df Den F value Pr > F
Food 1 115 91.22 <.0001
Day 3 339 190.94 <.0001
Food*Day 3 339 33.89 <.0001
Body Length 1 1265 1822.66 <.0001
Covariance Parameter Estimates of Random Effects Covariance Parameter Estimate Std. Err. Z value Pr Z
Family .000595 .000402 1.48 0.0694
Family*Food .000285 .000210 1.36 0.0870
Family*Day .001854 .000331 5.60 <.0001
Day of Development
0 2 4 6 8 10
ln (Arm Length)
0.0 0.2 0.4 0.6 0.8 1.0 1.2
High Food Low Food
Averaged across families, the degree of plasticity of larval arm length was greatest on day 6. Figure 2.3 depicts differences among families over time between low-fed and high-fed larval arm length. Positive values indicate adaptive phenotypic plasticity, i.e. low-high-fed larvae have longer arms than high-fed larvae at a given age; the largest positive deviation from zero occurs on day 6.
Costs of Plasticity
Energy content and arm length were marginally negatively associated in the low food environment (F1, 27 = 3.158, p = 0.087, R2 = 0.1047) and unassociated in the high food environment, (F1, 28 = 0.015, p = 0.995, R2 = 0.0005) (Fig. 2.4A). Similarly, stomach length was significantly negatively associated with arm length in the low food environment (F1, 27 = 4.836, p = 0.037, R2 = 0.1519) and unassociated in the high food environment (F1, 28 = 2.227, p = 0.147, R2 = 0.0737) (Fig. 2.4B).
Separate analyses of the association between fitness and degree of plasticity revealed that energy content (not residuals) was not associated with the degree of larval arm length plasticity in either low food (F1, 27 = 0.277, p = 0.603, R2 = 0.0102) or high food (F1, 27 = 0.111, p = 0.742, R2 = 0.0041) environments. Similarly, stomach length was not associated with the degree of larval arm length plasticity in either low food (F1, 27 = 3.261, p = 0.082, R2 = 0.1078) or high food (F1, 27 = 1.975, p = 0.171, R2 = 0.0682) environments. Furthermore, I obtained results that were qualitatively the same as those described above when I conducted each of the cost of plasticity analyses using energy content or stomach length as measures of fitness with arm length corrected for body size (relative arm length) as the phenotype. Finally, our test of the assumption that genotypes are distributed homogeneously across phenotypic space revealed no association between mean trait value (arm length on day 6) across environments and degree of plasticity (F1, 27 = 2.489, p = 0.126, R2 = 0.0844).
Discussion
Plasticity of Arm Length
My results demonstrate phenotypic plasticity of larval arm length in response to food level, as found in previous studies of echinoid (Boidron-Metairon, 1988; Fenaux et al., 1988; Hart & Scheibling, 1988; Strathmann et al., 1992; Hart & Strathmann, 1994; Sewell et al., 2004) and ophiuroid (Podolsky & McAlister, 2005) pluteus larvae. As in other species, the expression of this plastic response appears to be restricted to early development in Lytechinus variegatus: low-fed larvae had longer arms through day 6 but not on day 8. Although
Day of Development
0 2 4 6 8 10
Degree of
ln(A
rm
Lengt
h
) P
last
ici
ty
-0.2 -0.1 0.0 0.1 0.2 0.3 0.4
Figure 2.4A
Mean ln(Arm Length) on Day 6
0.5 0.6 0.7 0.8 0.9 1.0 1.1
ln (To ta l E ner ge tic Co nte n t) on Da y 14 -2.0 -1.5 -1.0 -0.5 0.0 0.5 1.0 High Food Low Food Figure 2.4B
0.5 0.6 0.7 0.8 0.9 1.0 1.1
ln(St
o
mach Lengt
h)
on Day 8
Figure 2.5: A: Fitness residual (from regression in Fig. 4A) versus degree of plasticity. B: Fitness residual (from regression in Fig. 4B) versus degree of plasticity. Each point
represents one of 29 families used in this analysis. Values of arm length for individual larvae were natural log-transformed before degree of plasticity was calculated. Each symbol
Figure 2.5A
Degree of Plasticity of Mean ln(Arm Length) on Day 6
-0.10 -0.05 0.00 0.05 0.10 0.15 0.20 0.25 0.30
Fi tne s s Re si du al [Re s id l n (E ne rge tic Co nte n t on Da y 14 )] -1.4 -1.2 -1.0 -0.8 -0.6 -0.4 -0.2 0.0 0.2 0.4 0.6 0.8 High Food Low Food Figure 2.5B
-0.10 -0.05 0.00 0.05 0.10 0.15 0.20 0.25 0.30
Fit
ness Residual [
R
esid
ln(Stoma
ch Length on Day 8)]
These results are similar to those of Boidron-Metairon (1988), who found plasticity through day 4 but not on day 7, when next measured, for the same species in a population from Puerto Rico. In addition, the mean values of percent difference in absolute arm length on days 2, 4, and 6, which show a percent increase in arm length for low fed larvae, are comparable to values reported or calculated for pluteus larvae from other echinoid and ophiuroid species (see Podolsky & McAlister, 2005).
Previous studies documenting the expression of larval arm length plasticity have used single (Sewell et al., 2005) or few (Boidron-Metairon, 1988; Hart & Scheibling, 1988;
Strathmann et al., 1992; Hart, 1994; Eckert, 1995; Podolsky & McAlister, 2005) male-female crosses (families) and have not focused on genetic variation among male-female pairs (see Podolsky & McAlister, 2005 as an exception). In our study, I obtained measures of larval arm length over time from 29 families from a single population. The results from the
ANOVA (PROC GLM) found a marginally significant genotype-by-environment (family by food) interaction for arm length, i.e. genetic variation for plasticity of arm length. Although this result was not significant at an alpha=0.05 level, the result suggests that genetic variation for phenotypic plasticity of feeding structures exists for these organisms.
Arm Length & Fitness
expected that a fitness benefit of possessing longer arms early in development would manifest itself in a greater total energy content later in development. Second, because I planned to rear a large number of larvae in successive blocks, I decided to halt data collection from each block on a day that roughly corresponded to an easily identifiable developmental landmark. Day 14 provided a good end-point for each block because most high-fed larvae had initiated juvenile rudiment formation at this time. Furthermore, stopping the experiment on this day ensured that larvae in both treatments had not exceeded this developmental landmark. Despite the fact that high and low-fed larvae had reached different developmental stages by day 14, the important comparison in this study was among genotypes within a single environment.
between larval arm length and stomach length, as high-fed larvae had both larger stomachs and shorter arms than low-fed larvae, consistent with Miner’s observation (Fig. 2.4B).
Larval arm length may therefore be more closely related to fitness measures other than total energy content. I addressed this possibility by using stomach length on day 8 as a measure of fitness in our analyses. The larval stomach can serve as a site of lipid storage, which is carried through metamorphosis to the juvenile stage (Burke, 1981). I used stomach length measurements from day 8 because this was the last day from which I obtained
morphological data and because stomach length was greatest at this time. Investment in stomach length early in development, although negatively correlated with and occurring at the expense of investment in arm length (Miner, 2005), may translate into higher fitness for an individual later in development or upon metamorphosis.
The trade-off between arm length and stomach length described by Miner (2005) is a between-environment pattern; larvae invest preferentially in one structure or another
depending on the environment. Interestingly, I detected a significantly negative within-environment association between stomach length and arm length in low-fed larvae (Fig. 2.4B). This result for low-fed larvae, coupled with the negative, albeit non-significant, association between these two parameters in high-fed larvae, suggests that there may be a negative genetic correlation between these traits.
Analysis of Costs of Plasticity
plasticity in the high food environment (Fig. 2.5B). However, in the low food environment I detected a significantly positive association between stomach length and arm length plasticity (Fig. 2.5B). Although my results show that longer-armed larvae reared in a low food
environment have smaller stomachs (Fig. 2.4B), more-plastic families reared in a low food environment have stomachs that are relatively large for their arm lengths (Fig. 2.5B). This result may indicate a possible benefit of plasticity, or a cost of developmental canalization or homeostasis (Dorn et al., 2000; Poulton & Winn, 2002). For example, larvae from more-plastic families may be better able to modulate the distribution of energy reserves towards the production of food gathering (arms) or food processing (stomach) structures in order to more optimally match and benefit from environmental conditions than can less-plastic families.
The lack of a detectable cost of plasticity suggests that plasticity of larval arm length could be more closely associated with a temporal fitness measure, such as development time to metamorphosis or development time to juvenile rudiment formation, than with total energy content or stomach length. Alternatively, plasticity of larval arm length could entail fitness costs or “latent effects” (Pechenik, 2006) that are not realized until after metamorphosis, such as effects on juvenile size, quality, or growth rate. Although previous researchers have demonstrated that food limitation is associated with developmental time to metamorphosis (Strathmann et al., 1992; Fenaux et al., 1994), and that plasticity of arm length is functionally adaptive (Hart & Strathmann, 1994) what remains unknown is whether arm length plasticity affects development time, and is thus evolutionarily adaptive because it has fitness
A test of the adaptive nature of the plastic response of arm length to food level would require an uncoupling of the plastic response from the effects of food (Hart & Strathmann, 1994). This could be accomplished by generating larvae that express short arms when reared in low food and the reverse. Results of a study by Heyland & Hodin (2004) investigating the role of thyroid hormones in larval development and metamorphosis suggest that larvae reared with low levels of both food and thyroid hormone develop to metamorphosis via a short-armed phenotype. Their protocol may prove useful for testing the fitness consequences, and for better understanding the costs, of larval arm length plasticity.
Other recent studies that tested for costs of plasticity similarly did not detect costs or have detected costs that do not fully support theoretical predictions regarding their
importance (DeWitt, 1998; Scheiner & Berrigan, 1998; Tucić et al., 1998; Dorn et al., 2000; van Kleunen et al., 2000; Tucić & Stojković, 2001; Agrawal et al., 2002; Poulton & Winn, 2002; Relyea, 2002; Steinger et al., 2003; Merila et al., 2004). My study contributes to this growing body of evidence that costs of plasticity are absent or are difficult to detect. An important limitation of most empirical studies is that they only consider the range of
CHAPTER THREE
EVOLUTIONARY RESPONSES TO ENVIRONMENTAL HETEROGENEITY IN CENTRAL AMERICAN ECHINOID LARVAE: PLASTIC VERSUS CONSTANT
PHENOTYPES.
Summary
plastic differences between Pacific and Caribbean echinoids. The evolution of plasticity may be limited by the timing of reproduction or by egg size in this system.
Introduction
The expression of a phenotype is intricately associated with the environment in which an organism resides. In some cases, the phenotype expressed by a given genotype can be influenced by environmental conditions, a phenomenon known as phenotypic plasticity (Bradshaw 1965; Stearns 1989). Alternatively, a genotype can produce the same phenotype across environments, indicating that the expression of the phenotype is constant. In
heterogeneous environments, phenotypic plasticity may allow an organism to maximize fitness (Gotthard and Nylin 1995); given appropriate genetic variability for plasticity and predictable environmental cues in a population, adaptive phenotypic plasticity is expected to evolve (Via et al. 1995). Conversely, expression of a constant phenotype is expected to confer high fitness and to evolve in environments with low heterogeneity and constant environmental characteristics.
al. 2000; Langerhans et al. 2003; Reinikainen and Repka 2003; Morey and Reznick 2004; Stauffer and Van Snik Gray 2004). However, few studies explore whether historical changes in environments are associated with the evolution of phenotypic plasticity or of different constant phenotypes (see Morey and Reznick 2004 for one example). What remains unknown in many systems are the relationships and times of divergence among different species, and how they have adapted to unique habitats since separation. These unknown variables make this level of evolutionary inquiry of greatest interest because no research has demonstrated an association between historical environmental changes and the repeated evolution of plastic or constant phenotypes. A comparison of phenotypic expression between close relatives that occupy habitats with different patterns of resource availability would therefore provide a crucial empirical test of the environmental factors underlying the evolution of alternative mechanisms for the expression of a phenotype.
upwelling, has low primary production, and is thus constantly nutrient poor and low in phytoplankton food (Glynn 1982; Keigwin 1982). Transisthmian geminate species offer a unique, replicated natural research system (Moran 2004) that can be used to address the evolution of adaptive phenotypic plasticity in response to the heterogeneity of food resource levels.
Morphological phenotypic plasticity in response to food level has been demonstrated in planktotrophic pluteus larvae from several species in the echinoderm class Echinoidea (Boidron-Metairon 1988; Strathmann et al. 1992; Hart and Strathmann 1994). These larvae depend on exogenous phytoplankton food, and, in response to low food availability, larvae increase the length of the ciliated band used for collecting food by growing longer larval arms; plasticity of ciliated band length is correlated with lengthening of skeletal arm rods in echinoplutei. Increased ciliated band length enhances larval ability to capture phytoplankton, and increases in ciliated band length under low food conditions have been demonstrated to be adaptive because larvae with longer ciliated bands have greater maximum clearance rates (Hart and Strathmann 1994). In addition, by increasing ciliated band length, the larval surface-to-volume ratio increases, which could increase intake of dissolved organic matter (Manahan et al. 1983). For this reason, plasticity in arm length has been used as a measure of larval feeding history in the field (Strathmann et al. 1992). A recent study demonstrates genetic variation of larval arm length plasticity in response to food limitation in the echinoid Lytechinus variegatus (McAlister unpub. data).
species lives in the highly productive but variable eastern Pacific, while the other inhabits the minimally productive and constant western Caribbean. Three sets of hypotheses can be made regarding the effect of food level heterogeneity on plasticity of larval arm length. First, the “Plasticity” Hypothesis posits that all species will exhibit some degree of phenotypic
plasticity of larval arm length. This expectation can be justified by the fact that plasticity of larval arm length has been demonstrated in a large number of echinoid species in which it has been examined (Boidron-Metairon 1988; Hart and Scheibling, 1988; Strathmann et al. 1992; Hart and Strathmann 1994; Sewell et al. 2004; Reitzel and Heyland 2007).
Second, the “Differential Plasticity” Hypothesis posits that larvae evolving in the western Caribbean, which has constant low phytoplankton food levels, will exhibit low to no degrees of phenotypic plasticity of arm length. Conversely, larvae evolving in the eastern Pacific, characterized by variable phytoplankton food levels, will exhibit greater degrees of phenotypic plasticity of arm length. In support of this hypothesis, larval echinoid species from tropical or subtropical waters with low food levels show minimal plasticity (Boidron-Metairon 1988; Eckert 1995; Reitzel and Heyland 2007), whereas species from cold
temperate waters with more variable food levels show greater degrees of plasticity (Boidron-Metairon 1988; Hart and Scheibling 1988). None of these studies are comparative or
examined many taxa however.
Caribbean. A better evolutionary strategy for resource acquisition may be to evolve longer arms under all conditions, especially if there is a cost of phenotypic plasticity (DeWitt et al. 1998). The number of examples in the literature is too small to thoroughly test the patterns described by these hypotheses, nor have these ideas been tested in a rigorous phylogenetic context. My results indicate that historical changes in food availability can lead to the repeated evolution of differences in the expression of constant phenotypes between species, and suggest that the evolution of phenotypic plasticity may hinge in part on selection for other life history characteristics associated with resource acquisition, e.g. egg size.
Materials and Methods
lucunter and Ec. viridis is thought to be the geminate partner of Ec. vanbrunti, diverging approximately 3.1 million years ago; Ec. lucunter and Ec. viridis diverged approximately 1.27-1.62 million years ago (McCartney et al. 2000). Although these three pairings are not the only echinoid geminates, they represent the genera with planktotrophic larvae that are most easily collected and spawned, and were therefore most amenable to this analysis. A second set of experiments examined the effects of food limitation on growth of Ec. vanbrunti and Ec. viridis larvae reared in one of five different food levels, including satiating and starvation conditions.
Adults of the sea urchins D. mexicanum, Ec. vanbrunti, and Eu. thouarsi were
collected from the Pacific Ocean in June and July 2005 by SCUBA from populations located in waters off Isla Taboguilla near Panama City, Panama (see Figure 3.1). Pacific species were placed in coolers filled with seawater and transported by boat to the Smithsonian Tropical Research Institute’s (STRI) Naos Island Laboratories (Naos) near Panama City. Adults of their geminate species counterparts, D. antillarum, Ec. lucunter, Ec. viridis, and Eu. tribuloides were collected from the Caribbean Sea by snorkel in the vicinity of STRI’s Galeta Marine Laboratory near Colon, Panama (see Figure 3.1). Caribbean species were placed in disposable plastic containers (3-4 urchins per container) filled with a small amount of seawater. The containers holding Caribbean urchins were stacked in a cooler and
Larval culture
Gametes were obtained from adult urchins by injecting approximately 1ml of 0.5M KCl through the peristomium into the body cavity. Eggs were collected and washed once in 0.45µm filtered seawater and sperm were collected by mouth pipette and kept on ice until use. Full-sib larval families of all species were established by separately fertilizing eggs from 1 female with sperm from 1 male. Four separate full-sib families were established for Ec. lucunter. Three separate full-sib families were established for D. mexicanum, Ec. vanbrunti, Ec. viridis, and Eu. tribuloides. Due to the difficulty in finding reproductively mature adult females, one full-sib family was established for both D. antillarum and Eu. thouarsi. Initial mean (+ 1 S.E.) egg diameters (means of 25 eggs each) and egg volumes (assuming a sphere) for females from each species are given in Table 3.1.
Fertilized embryos and larvae of each species were reared in one of two replicated food environments (5 and 1 algal cells/µl). Each food level was then replicated among three cultures. Each larval culture was fed the unicellular alga Dunaliella tertiolecta (UTEX Algal Supply, Austin, TX) daily, starting at 48h (all ages reported are post-fertilization). All cultures were reared in 0.45µm filtered seawater in 1-l plastic tri-pour beakers at densities of 1 larva ml-1 and water was changed every day. The cultures were maintained in a
Table 3.1: Initial mean (+1SE) egg diameters (bold text; units = micrometers) and volumes (normal text; units = nanoliters) for females of each species used to produce different larval families. Values were calculated using 25 eggs from each female.
Female used for each Full-Sib Family Species Ocean
1 2 3 4 Average
D. antillarum C 74.56 (.45) 0.22 (.00)
N/A N/A N/A 74.56 (.45)
0.22 (.00)
D. mexicanum P 64.96 (.34) 0.14 (.00)
64.8 (.45) 0.14 (.00)
68.16 (.19) 0.17 (.00)
N/A 65.97 (.27) 0.15 (.00) E. lucunter C 83.2 (.47)
0.30 (.00) 82.08 (.40) 0.29 (.00) 79.84 (.66) 0.27 (.00) 87.28 (.56) 0.35 (.00) 83.1 (.38) 0.30 (.00) E. viridis C 90.8 (.41)
0.39 (.00)
90.08 (.38) 0.38 (.00)
89.44 (.45) 0.38 (.00)
N/A 90.11 (.25) 0.38 (.00) E. vanbrunti P 67.84 (.19)
0.16 (.00)
67.76 (.29) 0.16 (.00)
69.76 (.43) 0.18 (.00)
N/A 68.46 (.21) 0.17 (.00) E. tribuloides C 92.64 (.58)
0.42 (.00)
92.16 (.70) 0.41 (.00)
93.44 (.40) 0.43 (.00)
N/A 92.74 (.34) 0.42 (.00) E. thouarsi P 86.08 (.40)
0.33 (.00)
N/A N/A N/A 86.08 (.40)
Measures of Phenotype
On days 2, 3, 4, 5, 6, 8, and 10 approximately 10 larvae were removed from each culture. Larvae were placed on a glass slide, immobilized with a dilute (<10%) solution of buffered formalin in seawater, and covered with a glass cover slip raised on clay feet. Three-dimensional Cartesian coordinates were recorded of multiple morphological features for 5 larvae from each culture (Figure 3.2). These landmarks included the tip and base of each anterolateral, postoral, posterolateral, and posterodorsal arm rod, the posterior tip of the larva, and the tip of the oral hood (i.e. the mid-point of the soft-tissue that stretches between the pair of anterolateral arms). To collect data from each larva, I used a camera lucida (drawing tube) and a digitizing tablet (Hyperpen 12000U, Aiptek Inc.) to capture x and y coordinates of morphological landmarks. Simultaneously, I obtained z coordinates from a rotary encoder (U.S. Digital) coupled to the fine focus knob of a Wild M-20 compound microscope (McEdward 1985). Using these 3-D Cartesian coordinates, I geometrically reconstructed individual arm and body lengths (measured in millimeters) for each larva. Because the postoral arms were the first arm pair to develop in all species used in this study, and were the most prominent arms at all developmental stages when I collected
PO
PO
BL
100 m
µ
Diadema antillarum
Eucidaris tribuloides
Echinometra viridis
PO
PO
BL
PO
PO
BL
Figure 3.2: Low-fed Diadema antillarum, Echinometra viridis, and Eucidaris thouarsi larvae at 10 days of development post-fertilization. Morphological characters that I
Statistical Analysis
Analysis of variance (PROC MIXED: SAS Institute, Cary, NC) tests were conducted 1) across all species and geminate pairs (“ocean analysis”) and 2) for each geminate species pairing (“paired species analyses”), using the natural log corrected sum of the postoral arm lengths (arm length) as the response variable in all statistical models. For the ocean analysis, I tested for the effect of variation among ocean, genus, family, day of development (day), food level (food), and culture replicate (culture) on arm length. The statistical model included the following interaction terms: ocean with food, ocean with day, day with food, ocean with genus, genus with food, and the three-way interactions of ocean by day by food and ocean by genus by food. Ocean, genus, day, food, and the interaction terms were coded as fixed effects and family and culture as random effects. The factor culture was nested within ocean, family, and food.
For the paired species analyses, I tested for the effect of variation among species, family, day, food, and culture on arm length. The model included terms to account for variation due to the interaction of species with food, day with food, species with day, and the three-way interaction of species by day by food. Species, day, food, and the interaction terms were coded as fixed effects and family and culture as random effects. The factor culture was nested within species, family, and food. The following paired species analyses were conducted: D. antillarum – D. mexicanum; Ec. vanbrunti – Ec. lucunter; Ec. vanbrunti – Ec. viridis; and Eu. thouarsi – Eu. tribuloides.
In both the ocean analysis and the paired species analyses, day was coded as a
DDFM=BW (Between-Within) option in PROC MIXED. Natural log corrected midline body length (body length) was included in all models as a quantitative covariate. I compared models both with and without the body length interaction terms and used the models (no interaction terms) that provided the better fit to the data using Akaike’s information criteria (AIC) (Littell et al., 1996).
Test of food limitation
I conducted a second experiment to test the effects on larval development of food levels lower than 1 algal cell/µl. Adult Ec. vanbrunti and Ec. viridis sea urchins were collected in August 2006 from the same respective Pacific and Caribbean field sites as described for the 2005 study (see above). Transportation of adult urchins to Naos and their maintenance in flow-through seawater aquaria were similar for this experiment. Gametes were obtained from adult urchins by peristomial injection of 0.5M KCl. Fertilizations were conducted by combining eggs from 7 female with sperm from 4 male Ec. viridis, and in a separate container, eggs from 2 female with sperm from 4 male Ec. vanbrunti. Initial mean (+ 1 S.E.) egg diameters (means of 10 eggs each) for Ec. vanbrunti females were 70.17 (+ 0.45) and for Ec. viridis females were 86.53 (+ 0.35). Assuming a sphere, mean egg volumes (+ 1 S.E.) were 0.18 (+ 0.00) and 0.34 (+ 0.00) nl, respectively.