NATIONAL STUDY OF TEEN DRIVER LICENSING SYSTEMS
AND GRADUATED DRIVER LICENSING PROGRAM CORE COMPONENTS
Scott Vincent Masten
A dissertation submitted to the faculty of the University of North Carolina at Chapel Hill in partial fulfillment of the requirements for the degree of Doctor of Philosophy in the
Department of Epidemiology.
Chapel Hill 2011
Approved by:
Stephen Marshall, PhD Andres Villaveces, MD, PhD Robert Foss, PhD
ABSTRACT
SCOTT MASTEN: National Study of Teen Driver Licensing Systems and Graduated Driver Licensing Program Core Components
(Under the direction of Stephen Marshall)
Sixteen- and seventeen-year-old drivers have higher crash rates than any other age group. Graduated driver licensing (GDL) programs, which are specialized driver licensing systems for beginner drivers, have been implemented in most U.S. states to reduce young teen drivers’ exposures to high-risk driving situations while they gain driving experience. Driver fatal crash involvements for all U.S. states from 1986-2007 were analyzed using Poisson regression models to estimate the associations of GDL programs with 16-, 17-, 18-, and 19-year-old crash incidences. GDL programs were reliably associated with 16–26% lower driver fatal crash incidence for 16 year olds, but 10–12% higher incidence for 18 year olds, dependent upon the number of license restrictions included during the intermediate licensing stage. GDL programs with two license restrictions during the intermediate licensing stage were marginally associated with 9% lower 17-year-old driver fatal crash incidence. The benefits of GDL programs in terms of reducing 16- and 17-year-old driver fatal crash
programs. At least one calibration for each GDL program core component, except supervised driving hours, was associated with a net decrease in 16–19-year-old driver fatal crash
DEDICATION
TABLE OF CONTENTS
LIST OF TABLES... viii
LIST OF FIGURES ... xii
ABBREVIATIONS ... xiii
I. INTRODUCTION AND REVIEW OF LITERATURE ...1
A. Overview of Crash Rates by Driver Age ...1
B. Reasons Why 16 and 17 Year Olds Have High Crash Rates...5
1. Inexperience at Driving...5
2. Age-Related Surrogate Factors...7
3. High-Risk Driving Circumstances (Nighttime Driving and Teen Passengers)...12
C. Description and Rationale of Graduated Driver Licensing (GDL) Programs ...14
D. Studies of GDL Programs...18
1. Single-State Studies of GDL...18
2. Multiple-State Studies of GDL ...21
a. Dee, Grabowski, and Morrisey (2005) U.S. GDL Study...23
b. Chen, Baker, and Li (2006) U.S. GDL Study...28
c. Vanlaar, Mayhew, Marcoux, Wets, Brijs, and Shope (2009) North American GDL Study ...36
d. McCartt, Teoh, Fields, Braitman, and Hellinga (2010) U.S. GDL Study...47
e. Summary of Problems with Prior Multi-State GDL Studies...56
II. RATIONALE AND SPECIFIC AIMS...59
A. Study Rationale...59
B. Specific Aims...63
III. METHODS ...66
A. Data Sources ...66
B. Coding of Teen Driver Licensing Systems and Other Highway-Related Laws...68
1. Coding of GDL Program Core Components ...68
2. Coding of Teen Driver Licensing Systems...71
2. Parameterization of Variables and Adjustments for
Confounding ...81 3. Calculation of Net Associations across all Teen Drivers...88 IV. RESULTS ...93
A. National Study of Teen Driver Licensing Systems (Aims 1, 2,
5) ...93 1. 16 Year Olds Teen Driver Licensing Systems Findings
(Aim 1)...94 2. 17 Year Olds Teen Driver Licensing Systems Findings
(Aim 1)...99 3. 18 Year Olds Teen Driver Licensing Systems Findings
(Aim 1)...104 4. 19 Year Olds Teen Driver Licensing Systems Findings
(Aim 1)...108 5. Summary of Individual Age Group Teen Driver Licensing
Systems Findings (Aim 1) and How Effects Varied as a
Function of Methodological Choices (Aim 5) ...113 6. Teen Driver Licensing Systems Findings across All Teen
Drivers 16–19 (Aim 2)...116 B. National Study of GDL Program Core Components (Aims 3, 4,
5) ...123 1. 16 Year Olds GDL Program Core Components Findings
(Aim 3)...125 2. 17 Year Olds GDL Program Core Components Findings
(Aim 3)...132 3. 18 Year Olds GDL Program Core Components Findings
(Aim 3)...137 4. 19 Year Olds GDL Program Core Components Findings
(Aim 3)...143 5. Summary of Individual Age Group GDL Program Core
Components Findings (Aim 3) and How Effects Varied as a
Function of Methodological Choices (Aim 5) ...150 6. GDL Program Core Components Findings across All Teen
Drivers 16–19 (Aim 4)...169 V. DISCUSSION ...175
A. Implications of the National Study of Teen Driver Licensing
Systems (Aims 1, 2)...176 B. Implications of the National Study of GDL Program Core
Components (Aims 3 & 4)...183 C. Methodologic Investigation of the Variation in Results due to
APPENDIX A: SUPPLEMENTARY STATISTICAL TABLES ...205
APPENDIX B: FIRST JOURNAL ARTICLE ...214
APPENDIX C: SECOND JOURNAL ARTICLE...239
LIST OF TABLES
Table
Table 1. GDL Program Core Component Categories, Number of Quarters for each Age Group in each Category, and Number of Unique States Contributing
to each Category ...69 Table 2. Teen Driver Licensing System Categories, Number of Quarters for each
Age Group in each Category, and Number of Unique States Contributing
to each Category ...73 Table 3. Other Highway-Related Law Categories, Number of Quarters for each
Age Group in each Category, and Number of Unique States Contributing
to each Category ...76 Table 4. Comparison of Teen Driver Licensing Systems Adjusted Rate Ratios and
Confidence Limit Ratios across Six Variations in Model Specification ...80 Table 5. Unadjusted 16-Year-Old Driver Fatal Crash Involvement Rates for Teen
Driver Licensing Systems and Other Highway-Related Laws, United
States 1986–2007...96 Table 6. Adjusted 16-Year-Old Driver Fatal Crash Involvement Rate Ratios for
Teen Driver Licensing Systems and Other Highway-Related Laws,
United States 1986–2007 ...97 Table 7. Unadjusted 17-Year-Old Driver Fatal Crash Involvement Rates for Teen
Driver Licensing Systems and Other Highway-Related Laws, United
States 1986–2007...100 Table 8. Adjusted 17-Year-Old Driver Fatal Crash Involvement Rate Ratios for
Teen Driver Licensing Systems and Other Highway-Related Laws,
United States 1986–2007 ...101 Table 9. Unadjusted 18-Year-Old Driver Fatal Crash Involvement Rates for Teen
Driver Licensing Systems and Other Highway-Related Laws, United
States 1986–2007...105 Table 10. Adjusted 18-Year-Old Driver Fatal Crash Involvement Rate Ratios for
Teen Driver Licensing Systems and Other Highway-Related Laws,
Table 11. Unadjusted 19-Year-Old Driver Fatal Crash Involvement Rates for Teen Driver Licensing Systems and Other Highway-Related Laws,
United States 1986–2007 ...110 Table 12. Adjusted 19-Year-Old Driver Fatal Crash Involvement Rate Ratios for
Teen Driver Licensing Systems and Other Highway-Related Laws,
United States 1986–2007 ...111 Table 13. Summary of 16–19-Year-Old Adjusted Driver Fatal Crash Involvement
Rate Ratios for Teen Driver Licensing Systems by Age, United States
1986–2007...115 Table 14. 16–19-year-old Driver Fatal Crash Involvements Attributable to each
Teen Driver Licensing System by Age and Time Span, United States ...118 Table 15. No-Age-Interaction Model Net 16–19-year-old Driver Fatal Crash
Involvements Attributable to each Teen Driver Licensing System by
Time Span, United States...122 Table 16. Unadjusted 16-Year-Old Driver Fatal Crash Involvement Rates by GDL
Program Core Component, United States 1986–2007...126 Table 17. Adjusted 16-Year-Old Driver Fatal Crash Involvement Rate Ratios by
GDL Program Core Component, United States 1986–2007...127 Table 18. Unadjusted 17-Year-Old Driver Fatal Crash Involvement Rates by GDL
Program Core Component, United States 1986–2007...133 Table 19. Adjusted 17-Year-Old Driver Fatal Crash Involvement Rate Ratios by
GDL Program Core Component, United States 1986–2007...134 Table 20. Unadjusted 18-Year-Old Driver Fatal Crash Involvement Rates by GDL
Program Core Component, United States 1986–2007...139 Table 21. Adjusted 18-Year-Old Driver Fatal Crash Involvement Rate Ratios by
GDL Program Core Component, United States 1986–2007...140 Table 22. Unadjusted 19-Year-Old Driver Fatal Crash Involvement Rates by GDL
Program Core Component, United States 1986–2007...145 Table 23. Adjusted 19-Year-Old Driver Fatal Crash Involvement Rate Ratios by
GDL Program Core Component, United States 1986–2007...146 Table 24. Summary of 16–19-Year-Old Adjusted Driver Fatal Crash Involvement
Rate Ratios and Age-Specific Driver Fatal Crash Involvements
Attributable to each Learner Permit Minimum Age Calibration, United
Table 25. Summary of 16–19-Year-Old Adjusted Driver Fatal Crash Involvement Rate Ratios and Age-Specific Driver Fatal Crash Involvements
Attributable to each Learner Permit Holding Period Length Calibration,
United States ...155 Table 26. Summary of 16–19-Year-Old Adjusted Driver Fatal Crash Involvement
Rate Ratios and Age-Specific Driver Fatal Crash Involvements
Attributable to each Supervised Driving Hours Calibration, United States ...157 Table 27. Summary of 16–19-Year-Old Adjusted Driver Fatal Crash Involvement
Rate Ratios and Age-Specific Driver Fatal Crash Involvements
Attributable to each Intermediate Stage License Age Calibration, United
States...159 Table 28. Summary of 16–19-Year-Old Adjusted Driver Fatal Crash Involvement
Rate Ratios and Age-Specific Driver Fatal Crash Involvements
Attributable to each Nighttime Driving Restriction Calibration, United
States...161 Table 29. Summary of 16–19-Year-Old Adjusted Driver Fatal Crash Involvement
Rate Ratios and Age-Specific Driver Fatal Crash Involvements
Attributable to each Passenger Driving Restriction Calibration, United
States...163 Table 30. Summary of 16–19-Year-Old Adjusted Driver Fatal Crash Involvement
Rate Ratios and Age-Specific Driver Fatal Crash Involvements
Attributable to each Unrestricted License Age Calibration, United States ...165 Table 31. Net 16–19-year-old Driver Fatal Crash Involvements Attributable to
each GDL Program Core Component Calibration by Age and Time Span,
United States ...171 Table 32. No-Age-Interaction Model Net 16–19-year-old Adjusted Rate Ratios
and Fatal Crash Involvements Attributable to each GDL Program Core
Component Calibration by Time Span, United States ...174 Table 33. Teen Driver Licensing Systems Analysis Likelihood Ratio Tests ...206 Table 34. GDL Program Core Components Analysis Likelihood Ratio Tests...207 Table 35. Comparison of GDL Program Core Components Adjusted Rate Ratios
With and Without Selected Combinations of the Three Age-Based
Components ...209 Table 36. Adjusted 40–59-Year-Old Driver Fatal Crash Involvement Rate Ratios
LIST OF FIGURES
Figure
Figure 1. Crash involvement rates per million miles traveled by driver age, 1995
(data source: Williams, 2003, Table 1)...2 Figure 2. Percentage of California 16–17-year-old drivers crashing for the first
time each month after they are licensed to drive unsupervised. ...6 Figure 3. Crash rates per 10,000 novice drivers during each month after initial
licensure by age group (data source: Mayhew et al., 2003, Figure 2). ...7 Figure 4. Linear driver fatal crash involvement trends for 16 year olds (upper) and
17 year olds (lower) in each U.S. state (light gray lines), along with nationwide trends for selected groups of adults, 16 year olds, 17 year olds, and all ages combined, 1986–2007 (lines represent the long-term
linear trends in fatal crash involvement rates for each state)...33 Figure 5. Annual California driver fatal crash involvement rates for 16, 17, 18,
and 19 year olds, along with those for selected combinations of adults,
1986–1997 (pre-GDL). ...44 Figure 6. Annual percentages of 16, 17, 18, and 19 year olds licensed to drive
unsupervised in California, 1986–2007. ...61 Figure 7. Age-Specific Poisson Regression Model for Overall Teen Licensing
ABBREVIATIONS
95% CI 95% confidence interval
AAAFTS American Automobile Association Foundation for Traffic Safety CLR Confidence Limit Ratio
FARS Fatality Analysis Reporting System FHWA Federal Highway Administration GDL Graduated driver licensing GEE Generalized estimation equations HSRC Highway Safety Research Center IIHS Insurance Institute for Highway Safety
RR Rate ratio
NHTSA National Highway Traffic Safety Administration TIRF Traffic Injury Research Foundation
CHAPTER 1
I. INTRODUCTION AND REVIEW OF LITERATURE
A. Overview of Crash Rates by Driver Age
Though motor vehicle crashes are one of the top 10 causes of mortality for all age groups, they are the leading cause of death in the United States for persons 16–19 years of age (National Center for Injury Prevention and Control, 2006). Since 2000 over 23 thousand 16–19-year-old drivers and 14 thousand passengers have been killed in motor vehicle
crashes, with an average of almost five thousand 16–19-year-old driver and passenger deaths per year from 2000–2008 (National Highway Traffic Safety Administration [NHTSA], 2010). In California during this time period, 1,750 drivers and 1,553 passengers were killed. When crash involvement rates are plotted by driver age, those for younger drivers (less than 25 years) tend to be higher than those for most other age groups (Williams, 2003). However, the actual shapes of these distributions vary considerably as a function of how the ages are grouped into categories (e.g., single years vs. 5-year groups), type of crashes used for the rate numerator (e.g., all crashes vs. fatal/injury crashes), and the rate denominator used to
0 5 10 15 20 25 30 35 40
16 17 18 19 20-24 25-29 30-34 35-39 40-44 45-49 50-54 55-59 60-64 65-69 70-74 75-79 80-84 85+ Driver Age (not to scale)
Cr as h I n vo lv e m e n ts pe r Mi lli o n M ile s T ra vel ed .
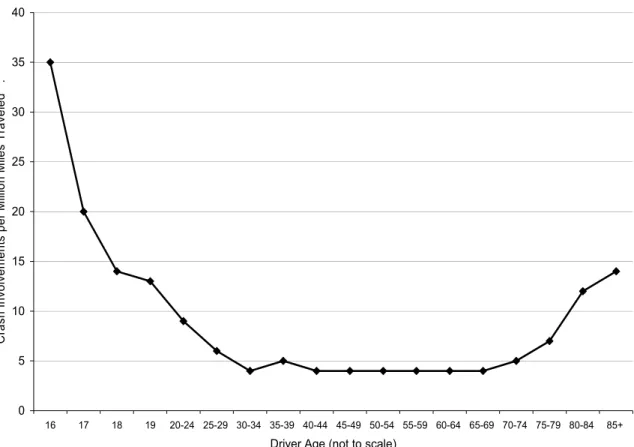
Figure 1. Crash involvement rates per million miles traveled by driver age, 1995 (data
source: Williams, 2003, Table 1).
Mileage-adjusted driver crash rates are highest for 16 and 17 year olds, plateau to some degree at an elevated rate for 18 and 19 year olds, continue to decline until around age 30, and are relatively flat until around age 70 when they start to creep back up.
There is nothing inherently meaningful about “teen” drivers, though we
conventionally talk about teen drivers as a single group. The teen driver age groups in Figure 1 are intentionally not aggregated to emphasize the fact that 16 and 17 year olds have
age groups. This conceals the large differences between 16 and 17 year olds and older teens. Six states still licensed persons ages 14 or 15 years to drive unsupervised as of 2007, though none allowed completely unrestricted driving until age 16. For purposes of this study, drivers younger than age 16 are excluded and “teen drivers” refers to drivers from 16 to 19 years of age. Crash rates differ among the individual ages in this grouping, the causes behind their crash rates probably differ, and hence the interventions that aim to reduce their crashes likely do not have a homogenous effect across all teen drivers. For these reasons the age groups are analyzed separately in almost all cases, and the results from these stratified analyses are combined to characterize teen drivers as a group.
The denominator choices commonly used to create crash rates by driver age are total population (per capita), number of licensed drivers, and miles traveled. Because age groups differ in population size, percentage of the population licensed to drive unsupervised, and annual mileage, the denominator choice also results in different crash rate distribution shapes across driver ages (Williams, 2003). On all three commonly used crash indices, the youngest teens (16 and 17 year olds) have total crash rates that are higher than any other group of drivers aged 25 years or older (Janke, Masten, McKenzie, Gebers, & Kelsey, 2003; Williams, 2003). As such, 16–17-year-olds’ crashes are a major source of morbidity and mortality worthy of intervention (Martinez, 2005). The crash statistics for California approximately follow the same patterns as these national statistics (Janke et al., 2003).
drivers. GDL programs aim to provide 16–17-year-old drivers with more on-road experience under conditions of reduced risk, because teens with more on-road experience tend to have lower crash rates (Cooper, Pinili, & Chen, 1995; Ferguson, 1996; Gregersen, Berg,
Engstrom, Nolen, Nyberg, & Rimmo, 2000; Mayhew & Simpson, 1990; Simpson & Mayhew, 1992; Waller, 1975). Although 16 and 17 year olds are the main focus of most GDL programs, these programs might also be associated with effects on older teens. For example, there is some evidence that GDL programs may be associated with higher crash rates among some older teens (e.g., Males, 2007; Vanlaar, Mayhew, Marcoux, Wets, Brijs, & Shope, 2009), possibly due to younger teens delaying licensure until they are no longer subject to the GDL requirements (McKnight, Peck, & Foss, 2002; Williams & Mayhew, 2008). Hence this study also included 18 and 19 year olds so that any changes in their crash rates associated with GDL programs could be estimated, along with the overall net
association for all “teen drivers” associated with GDL programs. The next section
(intermediate license) or not (unrestricted license)—and the term “learner permit” refers to being licensed to drive only under the supervision of a licensed adult.
B. Reasons Why 16 and 17 Year Olds Have High Crash Rates
1. Inexperience at Driving
It should not be surprising that 16–17-year-old drivers have high crash rates. Driving is a cognitively complex task that requires more than trivial skill to master (McKnight, 1996; Waller, 2003). Most 16 year olds and many 17 year olds are just learning basic driving skills and have not yet accumulated much driving experience. The scientific evidence regarding the power law of learning predicts that the number of errors made by learners of a procedural skill – such as driving – would decrease rapidly over initial exposures followed by smaller improvements with further practice (Anderson & Fincham, 1994). Consistent with the
learning curve predicted by this law, the most dangerous period of driving for 16 and 17 year olds is immediately after they have been licensed to drive unsupervised, particularly in the first several months (Harrington, 1972; Mayhew, Simpson, & Pak, 2003; McCartt,
Shabanova, & Leaf, 2003). This can be seen in Figure 2, which shows the percentage of California 16–17-year-old drivers who had their first police-reported crash each month after licensure to drive unsupervised.
within the first months of unsupervised licensure, after which the decline continues for years at a less steep rate (Masten & Foss, 2010; Mayhew et al., 2003). If “time licensed” can be taken to be a crude surrogate for driving experience, this suggests that more driving
experience is associated with reduced 16–17-year-old crash rates. Supervised driving while on a learner permit is a relatively safe type of driving exposure (Mayhew et al., 2003;
Williams, 2003; Williams, Preusser, Ferguson, & Ulmer,1997) that allows novice 16 and 17 year olds to gain driving experience while driving under conditions of reduced risk (Evans, 1987; Mayhew, 2003; Waller, 2003; Warren & Simpson, 1976; Williams, 1994).
0.0% 0.2% 0.4% 0.6% 0.8% 1.0% 1.2% 1.4% 1.6%
0 6 12 18 24 30 36 42 48 54
Months of Licensure
P
e
rc
ent
age Ex
p
e
rienc
ing Fi
rs
t Cr
as
h .
Figure 2. Percentage of California 16–17-year-old drivers crashing for the first time each
2. Age-Related Surrogate Factors
While new learners, regardless of age, are over-involved in crashes, 16–19-year-old novices have the highest initial crash involvement rate of any age group, which suggests there are other age-related reasons for their high crash rates beyond mere inexperience (Cooper et al., 1995; Levy, 1990; Mayhew et al., 2003; McCartt, Mayhew, Braitman, Ferguson, & Simpson, 2009). For example, Figure 3 shows crash rates for novice drivers ages 16–19 compared to those 20 or older (Mayhew et al., 2003).
0 20 40 60 80 100 120
1 2 3 4 5 6 7 8 9 10 11 12 13 14 15 16 17 18 19 20 21 22 23 24 Months of Licensure
C
ras
hes
per
10
,000
N
o
vi
ce D
riv
ers
Novices age 16-19 Novices age 20+
Figure 3. Crash rates per 10,000 novice drivers during each month after initial licensure by
age group (data source: Mayhew et al., 2003, Figure 2).
2 years. That is, given the same level of inexperience and driving exposure, younger novices tend to have higher crash rates than do older novices, and even a 1-year increase in age at licensure is associated with lower crash rates among young teen drivers (Cooper et al. 1995; LaBerge-Nadeau, Maag, & Bourbeau, 1992; Levy, 1990; Maycock, Lockwood, & Lester, 1991; Mayhew et al., 2003; Waller, Elliott, Shope, Raghunathan, & Little, 2001). The vague term “age-related” is used here because age per se does not cause higher crash risk. Age is
simply a surrogate measure for other constructs for which there is sometimes little agreement or supporting evidence in the literature regarding 16 and 17 year olds. The age-related
variability in young teen crash rates has been attributed to, or called, many different things in the literature such as: risk-taking; risky behavior; hazard perception/recognition;
over-confidence; youth; adolescence, developmental issues, and immaturity; just to name a few.
There is surprisingly little empirical evidence specific to 16–17-year-old drivers to help to explain their “age-related” higher crash risk. The numerous studies that are
Beyond the topic of crashes, there are dramatic, relevant differences in cognitive functioning and skill acquisition between 16–17 year olds and older teens, and between teens and persons in their early 20s. Adolescence is an important period for coordinating a wide range of cognitive and brain systems into a self-aware, guided, and monitoring system of conscious control (Keating, 2004; Steinberg, 2007). There is a steep learning curve for the acquisition of skill expertise, especially when such acquisition requires deliberate,
consciously-guided effort (Ericsson, 2002; Keating, 2004). While there is little doubt that 16 and 17 year olds have the physical ability to be able to drive safely, what they may lack are well-developed cognitive functions such as processing efficiency and working memory, which allow the automation of complex tasks (like driving) and enable much more complex performance (Keating, 2004; McKnight, 1996). Because cognitive functions have growth patterns that are robust earlier in age but become asymptotic as the older ages of adolescence are reached, these functions are probably less well developed in 16 and 17 year olds than they are in older teens and adults (Keating, 2004).
Therefore, it is not certain whether the findings from studies based on broader age groups (e.g., all teens 16–19 or young drivers 16–24) apply to 16 and 17 year olds, although it is routinely assumed to be so in the traffic safety literature. For example, in a widely-cited compendium of proceedings from the First Annual International Symposium of the Youth Enhancement Service called New to the Road: Reducing the Risks of Young Motorists
(Irwin, 1996). Of the eight research articles used to justify these conclusions, not one
presented results separately for 16 and 17 year olds. Teens were combined into a single group and in three instances persons 20 years of age or older were considered “adolescents.”
Another example of generalizing findings for a broader age group to 16 and 17 year olds is the frequent assertion based on findings that alcohol is a primary cause of serious crashes for adults of legal drinking age, that alcohol use is also a major reason for the high crash rates of teenage drivers (e.g., Ballesteros & Dischinger, 2002; McCartt et al., 2003; McGwin & Brown, 1999; Neyens & Boyle, 2007). In reality, alcohol is less commonly involved in fatal crashes for 16 and 17 year olds than for any other age group younger than 55 (NHTSA, 2005). The attribution of alcohol use as a major reason for 16–17-year-old crashes comes from surveys that lump all drivers from 16–20 years of age into a single category (Voas, Wells, Lestina, Williams, & Green, 1998; Zador, Krawchuck, & Voas, 2000) and a 2-decades-old literature review showing that the relative risk of a fatal crash increases as a function of blood alcohol content more so for 16–19 year olds combined than for other age groups (Mayhew, Donelson, Beirness, & Simpson, 1986).
Several studies have characterized the person-, vehicle-, environmental-, and driving-related factors associated with 16–17-year-old crashes, with the goal of identifying
16–17-year-old crashes are more likely than crashes for 16–17-year-older teens or adult drivers to involve single-vehicles, driving too fast, lack of attentiveness, leaving the roadway, and curved roads. Furthermore, their crashes occur less often during inclement weather and are less likely to involve alcohol. The 16–17-year-old drivers are also more likely to be found at-fault for the crash and be cited for a moving violation by the reporting officer. As described in the next section, two of the most replicated findings across characterizations of 16–17-year-old driver crash risk factors are the presence of teen passengers and nighttime driving. While the various characteristics of 16–17-year-old crashes have been described, the larger goal of determining the specific age-related factors that cause these crashes is difficult. Many of the factors likely relate to inexperience rather than driver age (McKnight & McKnight, 2003).
While it is clear that younger age at licensure is associated with higher crash rates, the etiology of this effect is not understood. The types of driver errors made by 16 and 17 year olds in crashes do not seem to reflect deliberate risk-taking or over-confidence as is
The existing literature does not appear to provide clear evidence that identifies the specific age-related factors causing the higher crash involvement rates for 16 and 17 year olds. It seems to be the case, however, that interventions that directly or indirectly raise the age at which young teens drive unsupervised, particularly if they do not reduce the amount of time allowed for supervised driving, can decrease the crash rate for this age group. The most obvious intervention would be simply to raise the minimum unrestricted licensing age without changing the age at which a learner permit could be obtained. The related strategy of keeping the licensing age the same, but lowering the age at which supervised instruction can begin may also reduce 16–17-year-old crash rates (Gregersen et al., 2000).
3. High-Risk Driving Circumstances (Nighttime Driving and Teen Passengers)
Numerous studies have documented that the crash rates of 16–17-year-old drivers are higher when they transport other teen passengers and when they drive during the nighttime hours (Chen, Baker, Braver, & Li, 2000; Preusser, Ferguson, & Williams, 1998; Rice, Peek-Asa, & Kraus, 2003; Williams, 1985, 2003). Nighttime crash rates are higher for all ages, but the day-night differential is much greater for 16–17-year-old drivers (Williams, 2003). Whereas only 15% of 16–17-year-old driving occurs at night (9:00 pm–6:00 am), almost 40% of their fatal crashes occur during this time (Lin & Fearn, 2003; Williams & Preusser, 1997). That is, although they do not drive much at night, their per-mile fatal crash rate is still high.
passengers than when they are not, and that the relative risk of a driver fatality is higher as the number of teen passengers increases. When 16–17-year-old drivers transport three or more teen passengers, their crash risk is about four times greater than without passengers (Williams, 2003). Direct observation of high-school age drivers with and without teen passengers provides some evidence that may help explain why 16 and 17 year olds’ crash rates are higher when they transport other teens. Specifically, young teen drivers transporting teen passengers have been found to drive faster and have shorter following distances,
particularly if the passenger is male (Simons-Morton, Lerner, & Singer, 2005).
Teen passengers and nighttime driving may have even more detrimental synergistic effects. For example, the highest overall crash risk for 16–17-year-old drivers is when they transport teen passengers at night (Chen et al., 2000). However, some of the higher nighttime crash risk of 16 and 17 year olds may be spurious. According to sociological theory,
“nighttime” is a social construct that is more than just darkness; it is characterized by the types of people and activities that occur during the nighttime (Melbin, 1978). Hence, 16 and 17 year olds who drive at night, especially late at night, probably differ in important ways from those of the same age who drive only during daylight. Recent empirical evidence suggests that darkness per se is associated with only a moderate increase in crash risk; hence
the high crash risk associated with nighttime driving is likely due to other factors rather than low light conditions alone (Johansson, Wanvik, & Elvik, 2009). Alternatively, 16 and 17 year olds who may be safe drivers during the daytime may just drive differently during the
The reasons why 16–17-year-old crash risk is so much higher at night and when transporting teen passengers are not well understood. Although nighttime driving is
associated with greater fatal crash involvement risk for drivers of all ages (though not to the same extent as for 16–17 year olds), the higher crash risk associated with transporting passengers is more unique to teen drivers (Williams, 2003). While there is a lack of
understanding about why carrying passengers is more risky for teens, it is fairly certain that interventions that reduce the exposure of 16 and 17 year olds to these high-risk situations have a good chance of reducing their crash rates.
C. Description and Rationale of Graduated Driver Licensing (GDL) Programs
GDL programs are strongly predicated upon the nature of human learning.
Specifically, that it takes a long time to learn complex tasks, that learners make more errors early in the learning process, that it takes longer to accomplish tasks early in the learning process, and that improvement occurs (i.e., errors decrease) in a manner approximating a power function (Anderson & Fincham, 1994). GDL programs are designed to provide the practical experience needed to move novice learner drivers along their learning curves, while keeping conditions as safe as possible. Hence, the main idea behind GDL programs is to allow novice drivers to gain on-road experience under conditions that minimize their overall crash risk (Foss& Goodwin, 2003; Mayhew, Simpson, & Singhal, 2005). This approach is supported by research showing that teen drivers with more real-world driving experience tend to have lower crash risk (Cooper et al., 1995; Ferguson, 1996; Gregersen et al., 2000; Mayhew & Simpson, 1990; Simpson & Mayhew, 1992; Waller, 1975).
experience, improve their skill, and are somewhat older, GDL programs address all three major reasons discussed earlier for high 16–17-year-old crash rates (i.e., inexperience, age-related surrogate factors, and high-risk driving circumstances; Ferguson, 2003). However, the most salient effect associated with GDL is likely exposure reduction from the longer learner permit periods, which raise the licensing age and reduce the numbers of young teens seeking licensure (Karaca-Mandic & Ridgeway, 2010; Margolis, Masten, & Foss, 2007; McCartt, 2001; McKnight & Peck, 2003; McKnight et al., 2002; Preusser & Tison, 2007). That is, there is little evidence that GDL actually makes teens safer drivers per se,though findings
from one recent cohort study suggest that 16 year olds licensed to drive under a GDL program with a long (12 month) learner permit holding period experience lower crash incidence during the first 5 years of unsupervised driving than those licensed before GDL (Masten & Foss, 2010).
The seven core components of teen driver licensing systems in general, and GDL programs specifically, are: (a) learner stage minimum entry age, (b) required learner permit minimum holding time period, (c) number of required supervised driving hours,
(d) minimum intermediate licensing age, (e) intermediate licensing stage nighttime driving restriction, (f) intermediate licensing stage passenger driving restriction, and (g) minimum unrestricted licensing age. Various combinations of these licensing components and quantitative/qualitative differences in how they are applied (i.e., calibrated) form the teen driver licensing systems in every U.S. state. Though Maryland and California adopted some elements of GDL in the 1980s (they were called provisional driver licensing programs at the time), the first genuine GDL program was enacted in New Zealand in 1987 (Mayhew et al., 2005). During the 1990s U.S. states began to implement true multi-stage GDL programs as well.
specialized teen driver licensing systems (Federal Highway Administration [FHWA], 1986). Even today there are states that have adopted only a few of the program components, while others have implemented them all (IIHS, 2009a). Over the past 20 years a teen driver
licensing system in a particular state may have been a one-stage system (i.e., teens are given completely unrestricted licenses upon completing their application), some form of two-stage system (i.e., with a minimum learner permit holding period or some type of unsupervised, but restricted intermediate license stage), or a true three-stage GDL program with one or two restrictions during the intermediate licensing stage.
D. Studies of GDL Programs
1. Single-State Studies of GDL
analyses), and statistical methods used to estimate effects (ranging from simple differences in crash counts to complex statistical modeling). Furthermore, the baseline crash rates to which GDL effects are compared differ across studies because some states went from having only a one-stage teen driver licensing system to a three-stage GDL-based program, whereas others had two-stage teen driver licensing systems (e.g., mandatory learner permit periods or nighttime driving restrictions) prior to implementing GDL. Finally, the components and calibrations of each state’s GDL program also differ, which makes it unclear how appropriate it is to generalize results showing a program to be effective in one state to a differently-configured GDL program in another state.
One other relevant issue is that not much is known about which specific components of GDL programs are the most effective, or what calibrations of the components are
by analyzing proportional incidence rates of these crashes, which attempt to remove overall GDL program effects prior to estimating the effects specifically associated with the
restrictions (i.e., percentage of total crashes occurring at night or percentage of total crashes with teen passengers; e.g., Masten & Hagge, 2004). In a few instances researchers have been able to identify states that made single-component changes to their teen driver licensing systems (e.g., Agent, Steenbergen, Pigman, Kidd, McCoy, & Pollack, 1998; Ulmer, Preusser, Williams, Ferguson, & Farmer, 2000), which allowed them to estimate the effect size for an individual GDL component without the inherent confounding resulting from making multiple program changes contemporaneously.
However, because single-component changes to GDL programs are rare, such an analysis would require that a large number of states be included to help insure that the effects associated with other components implemented at the same time could be estimated and statistically controlled.
2. Multiple-State Studies of GDL
Given the differences across states’ GDL program components and calibrations, and the methodological differences across the studies, it does not seem appropriate to estimate an average effect associated with GDL combined across single-state studies as might be done in a meta-analysis. Possibly because of these limitations, several different attempts to
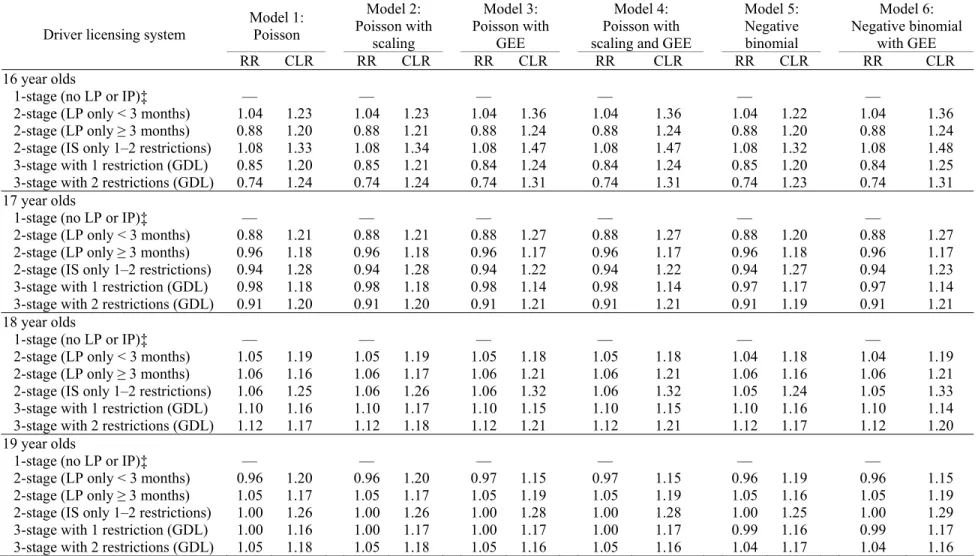
summarize effects associated with GDL programs across the U.S. have recently been published (Chen, Baker, & Li, 2006; Dee, Grabowski, & Morrisey, 2005; McCartt, Teoh, Fields, Braitman, & Hellinga, 2010). These studies attempted to derive a combined measure of average GDL program effect across multiple U.S. states by using a single national data source of fatal crash involvements, the Fatality Analysis Reporting System (FARS). Across all U.S. GDL programs Dee, Grabowski, and Morrisey (2005) estimated that there was a 6– 10% reduction in 15–17-year-old crash fatalities, and Chen, Baker, and Li (2006) estimated that there was an 11% reduction in the incidence of 16-year-old driver involvements in fatal crashes, associated with GDL. However, neither study successfully disentangled the specific GDL components associated with crash reductions.
GDL components. While they did not present a single estimate of all GDL programs combined, they did find that teen driver licensing systems rated as “Good” according to the IIHS’ teen licensing system quality rating scheme were associated with a 44% reduction in the incidence of 15-year-old driver fatal crash involvements, a 41% reduction among 16 year olds, a 19% reduction among 17 year olds, and directional, but not statistically reliable, reductions of 4% and 3% among 18 and 19 year olds, respectively. Licensing systems with lower IIHS licensing program quality ratings were generally associated with smaller
reductions or in some cases increases in fatal crash incidence. In terms of GDL program core components, they found that only nighttime driving restrictions and passenger restrictions were associated with reductions in driver fatal crash incidence for each age group from 15– 17 years. Learner stage entry ages and unsupervised licensing ages were associated with lower incidence for 15 and 16 year olds, but not for 17 year olds. Learner permit holding periods and required hours of supervised driving practice were not associated with lower driver fatal crash incidence for any of the age groups.
restrictions) were most strongly associated with the observed changes in teen driver fatal crash incidence, which will be discussed in more detail later.
It is noteworthy that the effect estimates from multi-state studies of GDL programs, with the exception of those from McCartt et al. (2010), are smaller than those typically reported from single-state studies of GDL programs. One possible explanation for this discrepancy is that it reflects a “file drawer” problem, meaning that single-state studies with smaller effect sizes tend to not be published in the peer-reviewed literature. Alternatively, the smaller estimates for multi-state studies might be due to their cross-sectional nature (Hauer, 2010). There are certainly other reasons that might explain the discrepant effect sizes from the two types of studies; the point here is to highlight this observation. Towards the goal of better understanding the methods and problems of existing multi-state GDL studies, each of the peer-reviewed multi-state studies discussed briefly earlier is presented in detail and critiqued in the following sections.
a. Dee, Grabowski, and Morrisey (2005) U.S. GDL Study
Dee et al. (2005) statistically adjusted for several factors to account for confounding effects associated with changes in other highway-related laws in each state (e.g., speed limit changes, seatbelt laws, and alcohol-related laws), along with the effects associated with macroeconomic forces by using state-specific annual unemployment. The actual statistical model used was conditional maximum likelihood negative binomial regression. Indicator variables representing the states were used in the analyses to account for average differences in fatalities across the states, and fixed-effects year variables were used to account for trends in fatalities. The yearly trend and state indicator variables were allowed to differ by
aggregated age group, and in some models the trend was also allowed to vary by state.
Across all U.S. states, Dee et al. (2005) estimated that implementing GDL programs was associated with a 10% average reduction in 15–17-year-old crash fatalities based on differences-in-differences Model 4 results that allowed for state-specific trends and used changes in 15–17-year-old crash fatalities in non-GDL states as the counterfactual
expectation. No reliable changes in crash fatalities associated with GDL were found for any of the adult age groups. The estimated reduction in 15–17-year-old crash fatalities associated with GDL was 6% based on the differences-in-differences-in-differences approach in which adult fatal crash fatalities from the same GDL states were used as the counterfactual
expectation (based on Model 5 in which all adult age groups are included).
Dee et al. (2005) did not conduct analyses estimating the effects associated with specific program components (e.g., effects associated with longer versus shorter learner permit holding periods or early versus late nighttime driving restriction start times). Instead the issue of heterogeneity in GDL programs across states was approached at a macro level by using IIHS’ teen licensing program quality rating taxonomy (IIHS, 2009b). Using this rating system, each state’s GDL program in a particular year was classified as “Good,” “Fair,” “Marginal,” or “Poor” based on the configuration and calibration of its teen licensing
calibrations associated with these reductions because IIHS quality ratings were used as a surrogate rather than coding and analyzing the specific types of program components included in each GDL program. In a related paper (Morrisey, Grabowski, Dee, & Campbell, 2006) the authors attempted to demonstrate that nighttime and passenger restrictions were effective GDL components by presenting how variations in IIHS teen licensing program quality ratings were associated with daytime and nighttime 15–17-year-old driver fatalities, 15–17-year-old driver fatalities when transporting other teens, and fatalities among teen passengers. The methodology used in that study was essentially the same as that used by Dee et al. (2005).
would be a reasonable expectation for what the changes in teen crash fatality rates would have been in the absence of the GDL programs. This is a problematic assumption given that crash rates vary widely by age and those for adult drivers are different from those for teens (e.g., Figure 1). Although the adult and teen rates are different overall, time-period-to-time-period variability in the adult rates may coincide with variability in the teen rates due to shared historical influences. This suggests that modeling adult rates as time-varying covariates rather than as counterfactuals may be a more effective strategy for controlling unmeasured historical confounding factors (e.g., changes in roadway environments, traffic enforcement, and fuel prices).
Dee et al. (2005) did not account for time-dependent correlation (autocorrelation) resulting from the geodemographic clustering of the crash fatality rates (i.e., repeated measurements of age × state crash fatality rates over time). Instead it was argued that the relatively short study time period (11 years) would reduce the likelihood that autocorrelation would bias the estimates. If the repeated measurements of age-group fatalities within each state are serially (time) dependent, failing to adjust the variances for this clustering would result in confidence intervals that imply greater precision than is actually warranted. The larger implication of not adjusting for autocorrelation would be to bias the analyses towards finding reliable effects associated with GDL programs.
counts. In states where 15 year olds are not allowed to drive legally, the crashes among such drivers also tend to be atypical. For example, alcohol use among 15-year-old drivers involved in crashes in North Carolina—where 15 year olds are not allowed to drive legally—is
consistently higher than among 16-year-old crash-involved drivers. Furthermore, the age grouping presupposes that any GDL program effects are homogenous across all teen age groups, and there is evidence that the effects associated with GDL vary for 16 and 17 year olds (e.g., Ulmer et al., 2000; Rice et al., 2004).
Finally, Dee et al.’s (2005) overall GDL program effect estimates were based on lumping all GDL-like teen driver licensing systems into a single group, whether or not they were true three-stage GDL programs with meaningful learner permit holding periods and non-trivial license restrictions during the intermediate licensing stages. While the analyses using IIHS licensing program quality ratings attempt to remedy this problem, even those estimates of GDL program effects are likely biased downward by the inclusion of pseudo-GDL programs (e.g., Arkansas, which did not have a true three-stage pseudo-GDL program until 2009 yet is coded as having a GDL program effective in July 2002).
b. Chen, Baker, and Li (2006) U.S. GDL Study
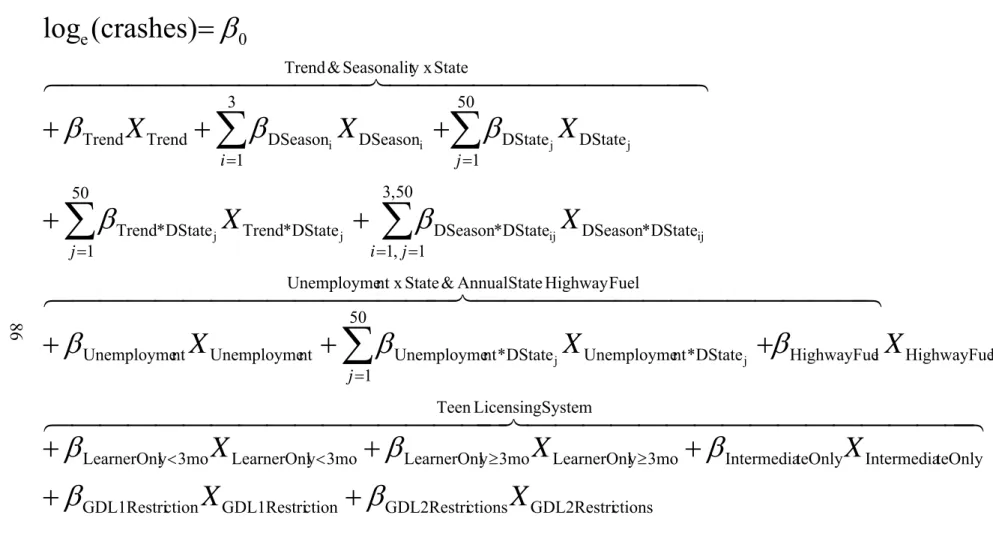
Excluded from the analyses were 17–19 year olds. The adult crash rates were not used as time-varying covariates or as counterfactuals to model the expected changes in 16-year-old driver fatal crash involvements in the absence of GDL. Rather, the purpose of modeling the crash rates of adult drivers was to indirectly support the argument that any changes seen in the 16-year-old’s crash rates were more likely due to GDL, given that no comparable changes in the crash rates for these older age groups were found. The models included parameters for trend (continuous year variable), seasonality (quarter indicator variables), and average differences between the driver fatal crash incidences of the states (state indicator variables). However, these variables were not parameterized as interaction terms in the models, so trends and seasonality were assumed to be the same across all included states. Generalized estimating equations (GEEs) were used to account for autocorrelation among the repeated measurements of fatal crash rates over time for each age group in each state
(geodemographic clustering).
Chen et al. (2006) excluded from the analyses a full year of data immediately before and after each state’s GDL program was implemented or substantially changed (i.e., 4 quarters before and 4 quarters after implementation). The reason for doing so was to remove temporary effects associated with transitioning teen drivers into the GDL program in each state. For example, before implementing a GDL program, some states experienced an influx of teen licensees who applied earlier for licensure to avoid being subject to the GDL program (e.g., Foss et al., 2001; Masten & Hagge, 2004). The periods immediately before and
exposure. The latter quarters were also excluded because due to grandfathering during implementation it could have taken a year or longer before all 16 year olds in a state were subject to the GDL program following its implementation.
Combined across all included states, Chen et al. (2006) estimated that there was about an 11% reduction in the incidence of 16-year-old drivers involved in fatal crashes associated with implementing GDL programs. No reliable reductions associated with GDL programs were found in the crash rates for the older age groups (20–24 and 25–29).
for 16 year olds and both adult groups, the estimated reductions for 16 year olds were
reliably estimated only for programs with five or more components in effect. However, some reliable decreases in driver fatal crash involvements were also found for 20–24 year olds, suggesting that some of the associations were likely spurious.
The second approach Chen et al. (2006) used to characterize how the effect sizes varied across GDL programs was to present the variation in effect sizes as a function of selected combinations of dichotomously-coded GDL components. However, for some unexplained reason specific combinations of only four of the seven GDL core components (learner permit minimum holding periods, required hours of supervised driving practice, nighttime driving restrictions, and passenger restrictions) were included, and only an overall combined estimate for each of the remaining components (minimum ages for obtaining a learner permit, obtaining an intermediate license, and obtaining a full license) were provided. Based on this approach, it was concluded that only GDL programs having at least a minimum learner permit holding period and a nighttime driving restriction, along with a passenger restriction and/or a supervised driving hours requirement, were reliably associated with lower 16-year-old driver fatal crash incidence (ranging from a 16-21% reduction).
terms with state, which assumes that trends and seasonal cycles are the same across all states. This is a serious error because trends and seasonality in driver fatal crash involvements actually do vary considerably across states, yet the adjustment method only provided a single average nationwide adjustment for each of these potentially confounding factors. For
illustration purposes, Figure 4 shows annual driver fatal crash involvement linear regression lines for 16 and 17 year olds for each U.S. state from 1986–2007 (light gray lines), along with nationwide trends for selected groups of adults, 16 year olds, 17 year olds, and all ages combined, for purposes of illustrating the wide-ranging differences among states in driver fatal crash involvement trends.
0 1 2 3 4 5 6 7
1986 1987 1988 1989 1990 1991 1992 1993 1994 1995 1996 1997 1998 1999 2000 2001 2002 2003 2004 2005 2006 2007 Year S tat e D riv er Fat al C ra sh I nv ol ve m ent Li ne ar Tr end s am on
g 16 y
ear
ol
ds
.
Age 16 Nationwide Age 20+ Nationwide
Age 40-59 Nationwide All Ages Nationwide
0 1 2 3 4 5 6 7
1986 1987 1988 1989 1990 1991 1992 1993 1994 1995 1996 1997 1998 1999 2000 2001 2002 2003 2004 2005 2006 2007 Year S tat e D riv er Fat al C ra sh I nv ol ve m ent Li ne ar Tr end s am on
g 17 y
ear
ol
ds
.
Age 17 Nationwide Age 20+ Nationwide
Age 40-59 Nationwide All Ages Nationwide
Figure 4. Linear driver fatal crash involvement trends for 16 year olds (upper) and 17 year
Another problematic method in Chen et al.’s (2006) study was excluding a year of data both before and after each GDL program was implemented. This exclusion could have further compromised the parameter estimates for seasonality and trend because it reduced the numbers of data points available to estimate these effects and created temporal breaks in the series. That is, data points were dropped in the middle of temporally-ordered series, yet estimates were made for long-term trends and seasonality (though these parameters are even more problematic because they were not allowed to vary by state). In addition, the effects associated with mandatory learner permit holding periods and some other GDL components would have occurred immediately following the implementation of the GDL programs, and the method could result in inaccurate estimates of the effects associated with these
components. The exclusion of data in this manner may seem logically appealing as a means to reduce certain potential biases associated with transition effects, but it also introduces an analytical flaw that may have reduced the ability to accurately model nuisance variables and program effects.
drivers. Many of these other highway-related law changes are known to be associated with fatal crash involvement, all states made changes to at least three of these laws, and the
majority of states made changes to almost all of them, yet these confounding effects were not modeled by Chen et al. (2006). Neither were proxies used in an attempt to model the effects associated with these factors, such as by using the state-specific crash rates for the adult age groups as covariates or as counterfactual expectations for the 16-year-old crash rates in the absence of GDL (though is potentially problematic for other reasons). Instead, the two adult age groups were analyzed in separate models to support the hypothesis that GDL is the cause for any observed changes in 16-year-old crash rates, given the absence of such changes in the rates of the adult drivers. Failing to control for changes in other highway-related laws and state-specific historical variability is a serious analytical shortcoming, particularly in light of the fact that trends and seasonality were also not adjusted conditional on state.
18, and 19 year olds were excluded from the study, so it provided no evidence regarding how GDL programs might affect older teens.
While Chen et al. (2006) attempted to disentangle the specific GDL components associated with 16-year-old fatal crash reductions, the method did not provide estimates for each specific GDL core component adjusted for all other GDL components, nor did it
provide separate estimates for the three age-related GDL core components. In addition, GDL program components were dichotomized as present/absent, without taking in account the total range of specific calibrations. In reality the program component calibrations vary along a continuum (e.g., learner permit holding periods range from 7 days to 12 months across U.S. states), which is not distinguished using this crude strategy, so it is not possible to determine from the analyses whether particular calibrations are better than others. While the approach is interesting for possibly determining how certain combinations of components work together contextually, it did not result in learning the specific components associated with crash reductions, nor how each might be optimally calibrated.
c. Vanlaar, Mayhew, Marcoux, Wets, Brijs, and Shope (2009) North American GDL Study
Information Database to calculate pre-post GDL rate ratios separately for 16, 17, 18, 19, and 25–54 year olds in each state or province. States/provinces were excluded if they did not have a GDL program, or did not have 2 years of post-implementation data available by the end of 2006. The pre-implementation period was defined as the 12-month interval ending 1 year prior to each GDL program’s implementation, and the post-implementation period was defined as the 12-month period starting 1-year after implementation. The exclusion of data from the year immediately before and after each GDL program was intended, similar to Chen et al. (2006), to avoid any effects associated with transitioning teens into the GDL programs.
account for the fact that those with smaller variances (i.e., estimates for states or provinces with larger populations of teen drivers) are more stable, and therefore should contribute more to the overall combined estimates of GDL program effects.
Combined across the U.S. states and Canadian provinces, Vanlaar et al. (2009) estimated that GDL programs were reliably associated with a 19% reduction in 16-year-old driver fatality rates, but no reliable change (0%) in 17-year-old driver fatality rates. The results were also consistent, though not reliably so, with increases of 8% and 6% in 18-year-old and 19-year-18-year-old driver fatality rates, respectively. For reasons that will soon be obvious, it is important to emphasize that these estimates are based on straightforward calculations of weighted averages of the adjusted driver fatality rate ratios, rather than being based on complex statistical modeling.
nighttime driving restriction during the intermediate licensing stage (from 0–10 hours); and (f) passenger driving restriction during the intermediate licensing stage (yes vs. no). The only GDL core component not included in the analyses was the minimum age at which the teens could get an unrestricted license. In addition to these six GDL core components, the analyses included 14 variables representing other program restrictions, requirements, and exceptions. Several variables were related to the GDL program core components, such as whether there was an exception to the nighttime driving restriction for work purposes or to the passenger restriction if the passengers were family members. The analyses of GDL program
components/calibrations were based on only 48 effect sizes (for each age group) rather than the full 78 because of missing data for the coded variables. This loss of almost 40% of the data points is problematic because it limits the extent to which the findings from the component analyses inform those of overall GDL program effects because the analyses are not based on the same samples of states/provinces. Furthermore, it is not stated which states or provinces were excluded from the component analyses because of missing information or whether the excluded states/provinces might have differed in some meaningful way from those retained for the analyses.
compared to states/provinces without such a restriction. While the size of this estimated reduction is difficult to believe, it pales in comparison to the size of the estimated effect reported for allowing intermediate licensing stage passenger restrictions to be waived if the passengers are family members (coded as yes/no). Specifically, GDL programs with a family-member exception to the intermediate licensing stage passenger restriction were found to be associated with 728% higher 16-year-old adjusted driver fatality rates relative to states/provinces that do not have such an exception or that do not have a passenger restriction at all. None of the other coded components, calibrations, ratings of program quality, or other factors were found to be reliably associated with variations in the adjusted driver fatality rate ratios for 16 year olds.
Vanlaar et al. (2009) did not conduct analyses of GDL components/calibrations for 17 year olds because the overall GDL program weighted driver fatality rate ratio for this age group was essentially 1.00 (no effect). The GDL component/calibration analyses for 18 year olds indicated that the adjusted rate ratios for this age group varied as a function of only one of the coded factors, which was whether the GDL program included mandatory driver
education in the learner stage (coded as yes/no). Specifically, GDL programs requiring driver education in the learner stage were found to be associated with 34% lower 18-year-old adjusted driver fatality rates relative to states/provinces without driver education requirements in the learner stage.
function of five of the coded factors. One of these factors was the length (in hours) of any nighttime driving restriction in the learner stage of the GDL program (not the intermediate
licensing stage, which is a GDL core component). States and provinces with longer nighttime driving restrictions in the learner stage of the GDL programs were found to have higher
19-year-old driver fatality rates relative to states/provinces with no nighttime driving restriction in the learner stage. Specifically, each additional hour of restricted driving time was found to be associated with about an 11% increase in 19-year-old adjusted driver fatality rates
compared to having no learner stage nighttime driving restriction. The other results from the 19-year-old GDL component/calibration analysis are also questionable. For example, the adjusted driver fatality rate of Canadian 19 year olds was found to be 1,229% (over 12 times) higher than that for 19 year olds in U.S. states. In addition, states and provinces with
exceptions to intermediate licensing stage nighttime driving restrictions for employment purposes were found to have 5,109% higher 19-year-old driver fatality rates. States and provinces with GDL programs requiring mandatory driver education during the intermediate
licensing stage were found to have 111% higher 19-year-old driver fatality rates, and those requiring an exit test to graduate from the intermediate licensing stage were found to have 98% higher 19-year-old driver fatality rates.
One of the positives of Vanlaar et al.’s (2009) study is that the effect sizes were weighted by the inverse of their variances, which would help achieve unbiased combined effect estimates. Another strength is that the method used in the study rigorously controlled for average differences in crash rates across states/provinces by creating
attempted to control for average differences among states’ crash rates through modeling (i.e., state indicator variables), the method used by Vanlaar et al. (2009) likely provided even better control for these differences. Another positive is the fact that all teens from ages 16–19 were included in the study and each individual age group was analyzed separately (i.e., teens were not combined into larger age groups), which allowed for the possibility that GDL program effects vary for teens of different ages (which is exactly what was found).
One of the most serious problems with the methods used by Vanlaar et al. (2009) is that the validity of the resulting effect estimates depends to a large extent on the degree to which using changes in adult driver fatality rates as the counterfactual expectation actually removed the confounding effects associated with trends, seasonality, changes in other
highway-related laws, and other unmeasured historical factors (e.g., fuel prices). Specifically, recall that adjusted driver fatality rate ratios were created by dividing the pre-post GDL rate ratios for teens by the contemporaneous pre-post rate ratios for 25–54 year olds in each state/province. The assumption of this method is that adults in this age group would not be affected by the GDL programs and so changes in adult crash rates represent a good
The adults-as-counterfactual method used by Vanlaar et al. (2009) assumes that pre-post GDL changes in adult driver fatality rates in each state/province embody all the
combined effects associated with trends, seasonality, changes in other highway-related laws, and numerous other unmeasured historical factors that would have affected teen driver fatality rates in those states/provinces in the absence of GDL. Furthermore, it assumes that the magnitude of the effects of these confounding factors would have been the same for adults and teens. Among other things for this method to work, the pre-GDL trends in fatal crashes for the adults in each state/province must be the same as those for each teen age group. This can easily be shown to not be true for all U.S. states. For example, the California GDL program was implemented in July 1998, so Figure 5 shows the California 1986–1997 (pre-GDL) annual per capita driver fatality rates for 16, 17, 18, and 19 year olds, along with those for selected combinations of adult age groups that might be used as counterfactuals for the teens per the adults-as-counterfactual method.
0 1 2 3 4 5 6
1986 1987 1988 1989 1990 1991 1992 1993 1994 1995 1996 1997 Year Ca lif or nia Dr iver Fat a l Cra sh In volve m en t Rat e pe r 10 ,0 00 Po pu lat io n .
Age 16 Age 17 Age 18 Age 19 Ages 20-24 Ages 25-39 Ages 40-59
Figure 5. Annual California driver fatal crash involvement rates for 16, 17, 18, and 19 year
olds, along with those for selected combinations of adults, 1986–1997 (pre-GDL).
meta-analysis techniques, as has been recently done in a series of comprehensive studies of U.S. alcohol laws (Wagenaar & Maldonado-Molina, 2007; Wagenaar, Maldonado-Molina, Erickson, Ma, Tobler, & Komro, 2007; Wagenaar, Maldonado-Molina, Ma, Tobler, & Komro, 2007). Because of the reasons above, it seems likely that the overall GDL program effect estimates are confounded by residual trends in teen driver fatality rates.
Vanlaar et al.’s (2009) method of using adults as a counterfactuals also assumes that any effects associated with changes in other highway-related laws (e.g., seat belt laws, speed limits, and alcohol-related driving laws) and unmeasured historical factors (e.g., fuel prices and macroeconomic forces) would be the same for teens as for adult drivers. This is a strong assumption and there is empirical evidence of age-specific differences in effect sizes
suggesting that it is not correct for at least some of these confounders (e.g., admin per se
In the interest of providing a complete critique of Vanlaar et al.’s (2009) study, two additional issues that have already been discussed in more detail for prior multi-state GDL studies should be briefly mentioned. All the GDL programs were combined into a single overall estimate of GDL program effect for each age group, regardless of the actual components and calibrations of the programs. Finally, multiple data points from the same states/provinces were included without attempting to adjust for this geodemographic
clustering. If the effect estimates from the same state/province are indeed correlated as would be expected, failing to account for this clustering would bias the results towards finding reductions in driver fatalities associated with GDL programs and components.
Vanlaar et al.’s (2009) study was the most thorough effort up to that point in time to determine which GDL components and calibrations were associated with the largest changes in teen crash fatalities. However, the extremely large sizes of most of the effect estimates makes their validity dubious, because effect sizes this large are almost never seen in well-designed traffic safety research studies. It is also interesting that the only GDL core component found to be uniquely associated with the driver fatality ratios was that for
misspecifications, small cell sizes (e.g., several of the coded categories have sample sizes less than five), or most likely some combination of these problems. Until the causes of the dubious effect sizes are resolved, these findings should be viewed cautiously.
d. McCartt, Teoh, Fields, Braitman, and Hellinga (2010) U.S. GDL Study
The most recent attempt to characterize the overall effects associated with GDL programs and to determine which GDL program components were associated with differences in teen fatal crash involvements was completed by McCartt, Teoh, Fields,
states, and in cases when involvement rates were aggregated across age groups, across all teen age groups as well.
McCartt et al. (2010) also conducted analyses of which specific GDL core
components and calibrations of those components were associated with changes in 15, 16, 17, and 15–17 year old (combined) fatal crash incidence. To do this each quarter was coded for the following GDL core components: (a) learner stage minimum entry age (continuous month of age); (b) required learner permit minimum holding period (continuous number of months); (c) number of required supervised driving hours (continuous number of hours); (d) intermediate licensing stage nighttime driving restriction (continuous number of hours restricted between 8:00 pm and 5:00 am); and (e) intermediate licensing stage passenger driving restriction (categorically coded as 0, 1, or 2+ teen passengers allowed). The GDL core components that were not coded separately were minimum intermediate licensing ages and minimum unrestricted licensing ages; instead these components were combined into minimum (unsupervised) driving age (continuous months of age). One implication of the coding strategy used for every variable except passenger restrictions is that all effects are constrained to be linear, so only monotonic increases or decreases (or no change) can be represented by the model parameters. The continuous variables were not centered, so the rate ratio estimates represent the change in incidence for a one-unit increase in the value of the variable (e.g., in months of age), starting from zero.
age was associated with 46% lower 15-year-old incidence and 21% lower 16-year-old incidence.
McCartt et al. (2010) did not find required learner permit holding periods to be reliably associated with fatal crash rates of 15 or 16 year olds, but longer learner permit holding periods were reliably associated with higher incidence for 17 year olds. The point estimates suggested that 6-month learner permit holding periods were directionally consistent with 2% higher and 3% lower incidence for 15 and 16 year olds (respectively), and reliably 4% higher incidence for 17 year olds. The estimates for 12-month learner permit holding periods were 4% higher, 6% lower, and reliably 9% higher, respectively for each age group.
Required hours of supervised driving practice were not found by McCartt et al. (2010) to be reliably associated with changes in fatal crash incidence for any of the teen age groups. The point estimates for 40 hours of required supervised driving practice, which is the number of hours most commonly required by U.S. states, were directionally consistent with 4% lower incidence for 15 year olds, no change at all for 16 year olds, and 4% lower incidence for 17 year olds.