Investigating the Influences of Biological Variation on
Neural Progenitor Cell Proliferation
Ellie Hadden-Ford
Senior Honors Thesis
Department of Psychology and Neuroscience
Abstract
The human cerebral cortex is uniquely expanded in surface area, cortical thickness, and overall
volume, and this expansion is thought to underlie the unique cognitive abilities of humans (Rakic
2006). In fact, patients with neuropsychiatric illnesses such as depression, obsessive-compulsive
disorder, schizophrenia, or autism have been shown to have cortical surface area differences as
compared to neurotypical controls (Schmall, Hibar, S ä mann et al. 2017, Boedhoe, Schmaal, Abe
et al. 2017; Piven, Elison, & Zylka 2017; van Erp, Walton, Hibar et al. 2018). Therefore,
understanding what factors influence the surface area of the brain can lead to a better
understanding of neuropsychiatric illnesses. The radial unit hypothesis proposes that increased
proliferation of neural progenitor cells causes increased cortical surface area through an increase
in radial columns (Rakic 1995). This study aims to elucidate biological factors that influence the
proliferation of neural progenitor cells. Cell lines generated from 71 unique donated fetal cortical
tissue sections were grown, stained for the proliferative marker Ki67, and percentage of
proliferative cells was quantified with automated image analysis. After controlling for technical
factors, neither gestation week nor sex of the donor was significantly related to the proportion of
proliferative cells (p=0.473, p=0.237). Data from this study can be used in many future analyses,
including genome-wide association studies to find common genetic variation that is significantly
associated with proliferation rate, and whether these genetic variants are related to genetic
variation that has been found to influence cortical surface area or risk for neuropsychiatric
Investigating the Influences of Biological Variation on Neural Progenitor Cell Proliferation The cerebral cortex is the outer layer of the brain and is greatly expanded in total volume,
thickness, and surface area along our human lineage (Rakic 2009). This cortical expansion may
underlie humans’ unique cognitive abilities and implies that the architecture of the human cortex
has functional implications. Indeed, the surface area of the visual cortex is related to visual
perception of illusions ( Schwarzkopf, Song, & Rees 2011) as well as acuity of visual perception
( Song, Schwarzkopf, Kanai, & Rees 2015). Cortical surface area differences are observed in
individuals with neuropsychiatric diseases relative to neurotypical controls. In adolescents with
major depressive disorder, for instance, cortical surface area was reduced relative to neurotypical
control groups (Schmall, Hibar, S ä mann et al. 2017). Other diseases, such as schizophrenia,
obsessive-compulsive disorder, and autism have also shown cortical surface area differences
between cases and controls (Boedhoe, Schmaal, Abe et al. 2017; Piven, Elison, & Zylka 2017;
van Erp, Walton, Hibar et al. 2018). These examples show that the surface area of the cerebral
cortex is related to functionality of the brain and altered brain structure is present in individuals
with neuropsychiatric diseases, some of which have profound effects on the daily life of people
affected by these diseases, as well as their caretakers. Understanding the origin of cortical
surface area inter-individual variability is an important step on the road toward more effective
treatment for neuropsychiatric illnesses.
The increased surface area of the human cortex may begin during development,
particularly when neurogenesis, the process of generating neurons from progenitor cells, takes
place in unique transient structures of the developing primate brain (Rakic 2009). Neurogenesis
produce two identical daughter cells, and asymmetric divisions that produce one neuron and one
progenitor cell. Each progenitor cell that is produced in a division can subsequently undergo
symmetric or asymmetric divisions, but the neurons never proliferate. Once cells divide and
differentiate into immature neurons, they migrate up radial glia towards the surface of the cortex.
The proliferative pool of neural progenitor cells is expanded in primates and humans in particular
(Lui, Hansen, & Kriegstein 2011). The radial unit hypothesis states that as the number of
progenitor cells increases, the number of radial columns increases (Rakic 1995). This hypothesis
then states that the increased number of radial columns causes an increase in the cortical surface
area (Rakic 1995). In humans, a unique cell type called outer radial glia (oRG) undergoes many
rounds of division to proliferate within the outer subventricular zone (oSVZ) (Pollen et al.,
2015). These rounds of division produce an exponential expansion in the number of cells present
in the oSVZ, which is hypothesized to lead to the increased cortical surface area in humans.
The processes of proliferation and neurogenesis is complex and dynamic, and is
influenced by changes in cell micro-environment, cell-types, signaling, and programs of gene
expression in the areas of the developing brain (Rakic 2009). Substantial work has already been
done in a variety of model systems which has led to discovery of pathways that regulate the
proliferation of neural progenitor cells. Some of these pathways include Hedgehog (HH) (Wang
2016), and the canonical Wnt signaling pathway (Woodhead 2006, Zhou 2006). Elucidating the
cellular mechanisms controlling neural progenitor proliferation and differentiation can lead to
greater understanding of developmental processes and may identify new targets for new
therapeutics.
Common genetic variation associated with proliferation can identify cellular pathways
that have an influence on brain structure, including cortical surface area (Grasby et. al, 2020). In
order to identify common genetic variation related to proliferation, a genome wide association
study (GWAS) can be performed. GWAS studies correlate a phenotype such as proliferation,
with common genotypes at single-nucleotide polymorphisms (SNPs) throughout the genome.
GWAS studies have successfully identified many loci associated with many phenotypes
including brain structure and disease risk, but have not yet been associated with cellular traits
like proliferation ( Visscher, Wray, Zhang et al. 2017 ). Loci that influence proliferation may help
explain part of the causal mechanism by which genetic variation leads to changes in brain
structure or risk for neuropsychiatric disorders. These loci can then be functionally validated
through experimental manipulation to provide further evidence for their role in neural progenitor
proliferation. Through further study, these causal pathways can be targeted for therapeutic
discovery and treatment of neuropsychiatric diseases. Before a GWAS can be performed, it is
essential to confirm that the phenotype to be used in the association can be measured reliably,
and that technical variables that influence the phenotype can be determined. If the phenotype
cannot be reliably measured and technical effects are not accounted for, the GWAS will not
produce sound results.
Currently, the effects of common genetic variation and other biological variation on
proliferation are not well understood. In order to study these effects on proliferation, we
generated human neural progenitors from donated fetal brain tissue of 71 unique and ancestrally
diverse donors, and cultured them for 3 weeks. Following fixation, we quantified total numbers
and proliferative percentage of cells were automatically quantified through the deep learning
segmentation program CellPose in conjunction with a CellProfiler pipeline. Using this
information, we were able to determine the reproducibility of cell counts across donors and the
association between cell counts and technical variables which influence these measures. This is
the first stage toward conducting a GWAS of proliferation phenotypes in human neural
progenitors.
Methods Tissue Acquisition
Following IRB regulations, human fetal brain tissue was obtained from the UCLA Gene
and Cell Therapy Core. Thin pieces of tissue that had the morphology of the developing cortex
were selected in Daniel Geschwind’s lab, and the presumed cortical tissue was dissociated into a
single cell suspension. The cells were then cultured as neurospheres for a low number of
passages (average 2.5) on laminin/fibronectin and polyornithine coated plates and cryopreserved
as human neural progenitors (HNPs). The preserved HNPs were shipped to UNC-Chapel Hill
after a material transfer agreement signed by both institutions. All proliferation and analysis was
performed at UNC Chapel Hill.
Cell Culture and Fixation
HNPs were thawed in rounds of 8-10 randomly selected donors into 10 cm plates on a
Monday, and fed with half feeds using 2x proliferation media (see media formulations in table
below) on Wednesdays and Fridays. 10 cm and 96 well plates for the following week were
coated in a two-day process on Thursdays and Fridays. HNPs were passaged on Mondays and
per well with proliferation media on a Monday, and fixed on Thursday, three days after the last
passage. In total, 98 donors were cultured with 64 of 98 donors replicated once, and 22 of 98
donors replicated two or more times. HNPs were fixed at room temperature in 4% PFA solution.
After 15 minutes, the PFA was removed and cells were washed with 1x PBS three times, then
stored at 4 °C in PBS and 0.02% sodium azide.
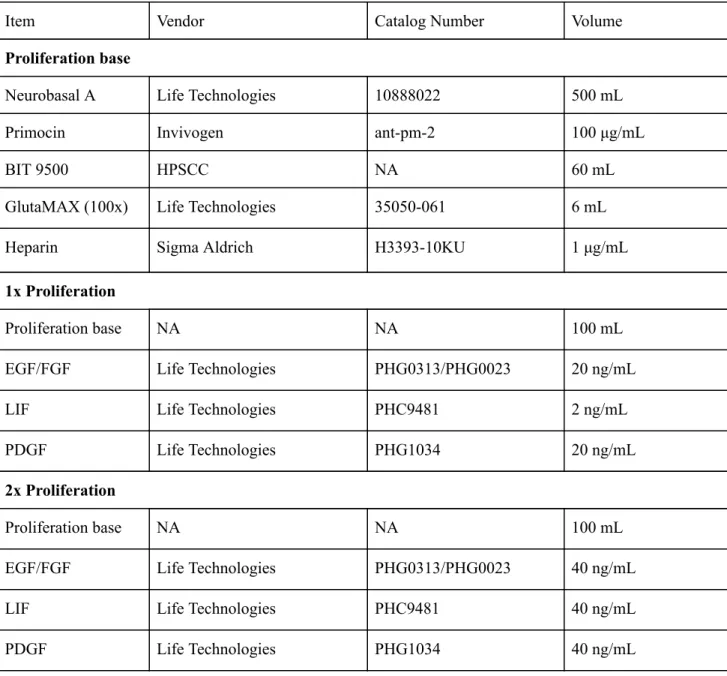
Table 1 . Cell Culture Media Reagents
Item Vendor Catalog Number Volume
Proliferation base
Neurobasal A Life Technologies 10888022 500 mL
Primocin Invivogen ant-pm-2 100 μg/mL
BIT 9500 HPSCC NA 60 mL
GlutaMAX (100x) Life Technologies 35050-061 6 mL
Heparin Sigma Aldrich H3393-10KU 1 μg/mL
1x Proliferation
Proliferation base NA NA 100 mL
EGF/FGF Life Technologies PHG0313/PHG0023 20 ng/mL
LIF Life Technologies PHC9481 2 ng/mL
PDGF Life Technologies PHG1034 20 ng/mL
2x Proliferation
Proliferation base NA NA 100 mL
EGF/FGF Life Technologies PHG0313/PHG0023 40 ng/mL
LIF Life Technologies PHC9481 40 ng/mL
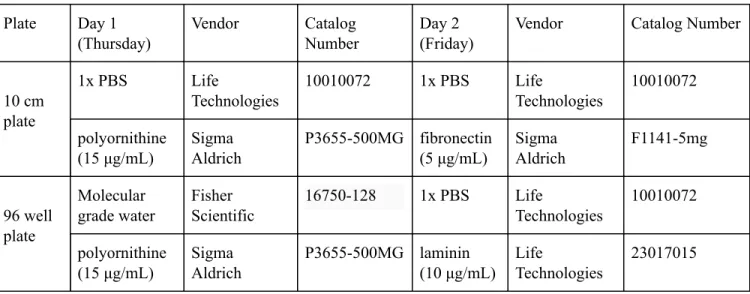
Table 2 . Plate Coating Reagents
Plate Day 1 (Thursday)
Vendor Catalog
Number
Day 2 (Friday)
Vendor Catalog Number
10 cm plate
1x PBS Life
Technologies
10010072 1x PBS Life
Technologies
10010072
polyornithine (15 μg/mL)
Sigma Aldrich
P3655-500MG fibronectin (5 μg/mL)
Sigma Aldrich
F1141-5mg
96 well plate
Molecular grade water
Fisher Scientific
16750-128 1x PBS Life
Technologies
10010072
polyornithine (15 μg/mL)
Sigma Aldrich
P3655-500MG laminin (10 μg/mL)
Life
Technologies
23017015
Immunocytochemistry
Plates were removed from cold storage and allowed to warm to room temperature. First, a
PBST solution was created with 0.02% Tween in 1xPBS. Cells were permeabilized with PBST
and 0.4% Triton solution for 10 minutes. Next, cells incubated at room temperature for at least 1
hour in a 10% goat serum solution diluted in PBST. After blocking, a goat serum/PBST primary
antibody solution was added to the cells, which sat overnight in 4 °C storage. The next day, the 3
washes were performed with PBST, and the cells were incubated in fluorophore-conjugated
secondary antibody solution for 50 minutes. After 50 minutes, DAPI was added at a final
concentration of 2.5ug/mL and cells were incubated for an additional 10 minutes. The cells were
washed 3 times with PBST, stored in PBS and sodium azide solution at 4 °C in a dark, enclosed
box. Two sets of antibodies were used to examine different cell types of the neural progenitors,
designated experiment 1 and experiment 2. The antibodies for experiment 1 were as follows:
Table 3 . Primary Antibodies
Antibody Species Dilution Vendor Catalog #
Sox2 Rabbit 1:500 EMD AB5603
Hopx Mouse 1:200 Santa Cruz sc-398703
Ki67 Rat 1:1000 eBio 14-5698-82
Pax6 Rabbit 1:300 BioLegend 901302
Nkx2.1 Mouse 1:500 EMD MAB5460
TTF-1 (Nkx2.1) Mouse 1:500 Santa Cruz SC53136X
Sox2 Mouse 1:500 Abcam ab79351
Hopx Rabbit 1:500 Sigma HPA030180
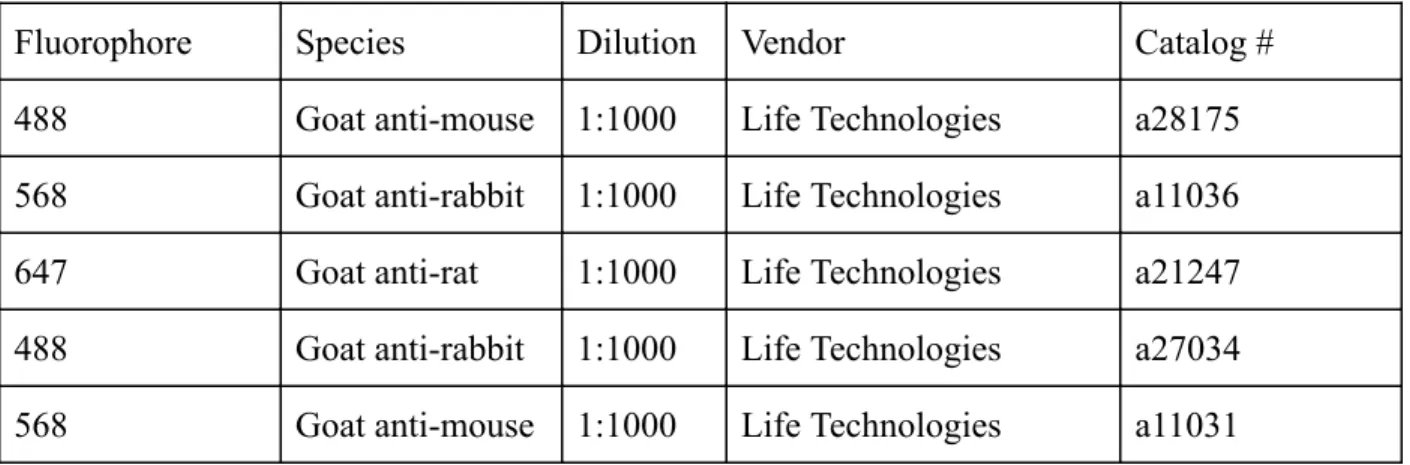
Table 4. Secondary Antibodies
Fluorophore Species Dilution Vendor Catalog #
488 Goat anti-mouse 1:1000 Life Technologies a28175 568 Goat anti-rabbit 1:1000 Life Technologies a11036 647 Goat anti-rat 1:1000 Life Technologies a21247 488 Goat anti-rabbit 1:1000 Life Technologies a27034 568 Goat anti-mouse 1:1000 Life Technologies a11031
Following fixation and before staining, 11 out of 27 total plates were exposed to air and
light for less than 18 hours. 2 of 27 plates were exposed after staining, but before imaging. By
eye, there was no discernable difference in image quality between plates that were exposed to air
culture, a linear model found no significant relationship between exposure status and percentage
of cells positive for Ki67 (p=1).
Imaging
Plates were imaged on a Nikon Eclipse Ti2 system using the NIS Elements automated
microscopy software and a pco.edge 4.2Q High QE sCMOS camera at the UNC Neuroscience
Center Microscopy Core. Images of each well were acquired at 10x magnification using 4 filters
to capture fluorescence in the DAPI, GFP, TxRed, and Cy5 channels.
Automated Image Analysis Cellpose Segmentation
Nuclei stained with DAPI were identified in images using the deep learning algorithm Cellpose
(Stringer, Michaelos, & Pachitariu, 2020; github: https://github.com/MouseLand/cellpose ).
Full-size images were cropped into quarters to speed up processing time. Final nuclei masks
within each quarter image were created by subtracting the ‘outlines’ output from the ‘mask’
output to assist in separation of clumped cells in the CellProfiler analysis.
CellProfiler Analysis
First, nuclei were identified based on the output mask of Cellpose, with allowed sizes of
nuclei of 5-35 pixels, corresponding to 3.5-24.5 micrometers. Next, objects in the DAPI channel
were identified with size boundaries of 1 to 100 pixels to create a set of masking objects used to
ensure bright debris does not influence calculations of thresholds. Each channel was masked, and
the background intensity was measured. Based on this background intensity value, a threshold
was calculated to determine the number of nuclei positive for each immunolabel. The intensity at
with the determined value to determine the number of cells positive or negative for each
immunolabel in each channel. For the Cy5 channel (Ki67), the threshold is
of the image background intensity. median 3 tandard deviation))
2 * ( + ( * s
Technical Reproducibility
To evaluate CellPose and CellProfiler identification of cells, the number of cells in the
DAPI, TxRed, and Cy5 channels were manually counted in 4 cropped images. These cell counts
were used to calculate precision and recall of the number of cells automatically identified (Figure
2) with the following formulas:
Recall = T rue positives + F alse negativesT rue positives Precision = T rue positives + F alse positivesT rue positives
Pre-Analysis Processing in R
After the number of cells positive for Ki67 in each cropped image was calculated through image
processing described above, this data was read into R, where cell counts from the 4 cropped
images from one well were summed so that each well had 1 data point. Because each donor had
multiple wells, all the wells for one donor were averaged so that each donor had 1 data point.
Before further analysis, these data points were rank normalized.
Technical Variation
Linear models were used to examine the effects of technical variables on the percentage
of cells expressing Ki67 across donors. ANOVA tests were used to iteratively test if adding a
technical variable improves the linear model, and these results were used to build the final linear
Biological Variation
Linear models were used to evaluate the relationship between round-corrected proportion
of proliferative cells and biological variation, including sex and gestation week of the donor.
Results
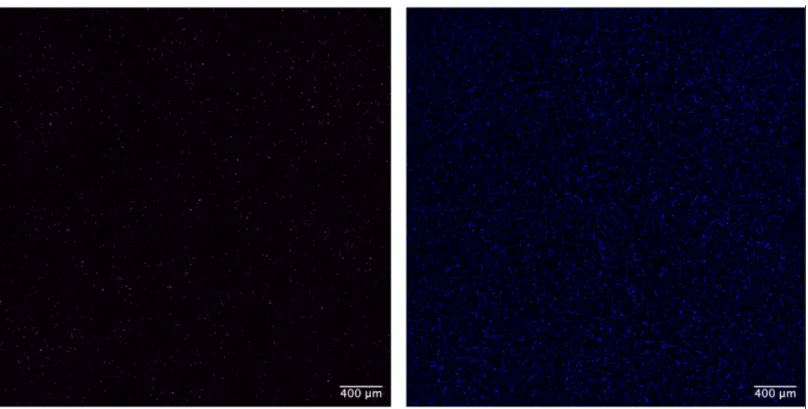
Following three weeks of proliferation, cell lines from 71 donors were fixed, stained with
Ki67 antibody and DAPI, and imaged (Figure 1, Figure 2). Each multi-channel image was
cropped into 4 images to speed up processing time, and each DAPI channel was run through the
deep-learning segmentation program Cellpose on the Longleaf Computing Cluster and the UNC
Neuroscience Center Microscopy Core Server in order to parallelize computing. To quantify the
accuracy of Cellpose segmentation, 6 images were manually counted and compared to
automatically generated results. Cellpose had high precision and recall (average 0.9977 and
0.9923 respectively), indicating a low rate of false positives and negatives (Figure 3c). While
Cellpose had split and merge errors, where detected cells are incorrectly identified (Figure 3A,
3B), they affected relatively few cells in each image. On average, 0.786% of cells identified had
split errors, and 2.51% of cells identified had merge errors. Following automated identification
of cells, the results from each of the 4 cropped images were added together to represent results
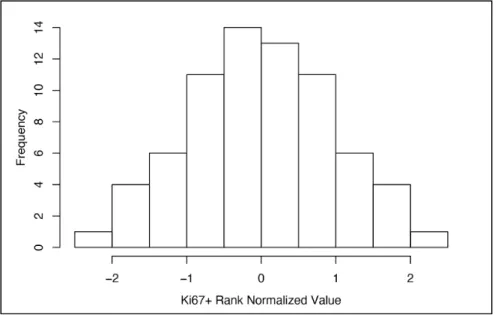
from 1 well. These results were subsetted to include only Ki67+ percentages, averaged by donor
so that the final dataset included 1 data point per donor, and rank normalized prior to analysis
(Figure 4). On average, each well contained 15336.84 (standard deviation 5914.104) nuclei and
Technical Variable Correction
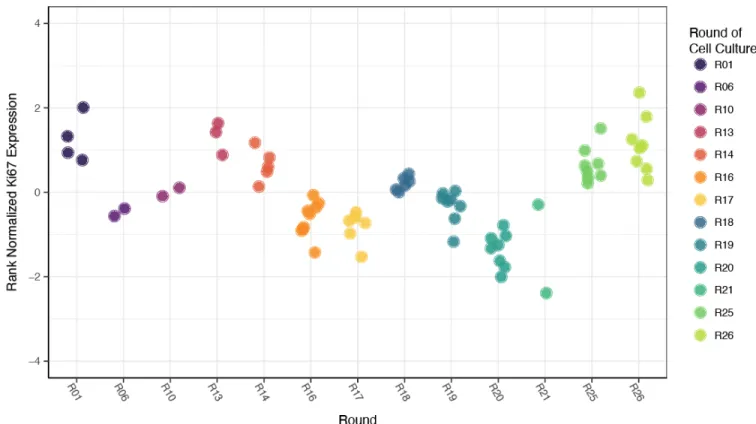
Using linear models, the data was examined for effects of technical variables. Round of
cell culture had a significant relationship with Ki67 expression (Figure 5, multiple R 2 =0.809,
p<2.2x10 -16 ). To correct for this effect, the residuals from a linear model including only round of
cell culture were used to examine effects of other technical variables, including cell culture
conditions, exposure to light and air for an extended period of time, time between fixing and
staining, and time between staining and imaging. None of these technical variables displayed a
significant relationship with Ki67 expression (Figure 6).
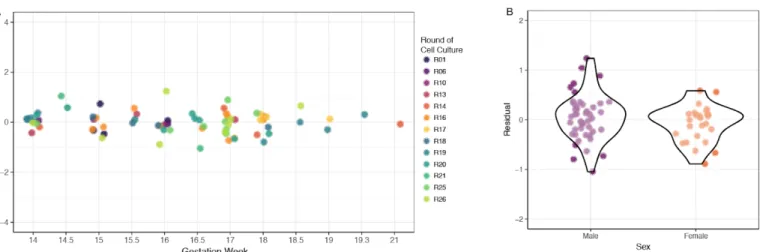
Relationship of Ki67 Expression to Biological Variables
The residuals from the linear model controlling Ki67 percentages for round to round
variability were used to examine the relationship between gestation week of the donor tissue and
Ki67 percentages. A linear model revealed no statistically significant relationship between
gestation week and Ki67 percentages in cell culture (Figure 7a, p=0.473). Sex of the donor was
examined in relation to Ki67 expression, also revealing no statistically signficiant relationship
(Figure 7b, p=0.237).
Although my original hypothesis was that donors with earlier gestation weeks would
display higher rates of proliferation as measured by Ki67 expression, this result could be
explained by the culturing conditions the cells were grown in. Because each cell line was
exposed to the same growth factors, their stage of development could have been “reset” to the
Future Directions
The data set generated from this project can be the basis for many more analyses,
including genetic association analyses. With significant technical variables detected, the rate of
proliferation for each donor can be used to run a genome-wide association study to search for
genetic variation that is significantly associated with neural progenitor cell proliferation rate.
Percentage of cells positive for neural progenitor cell type markers Pax6 and Sox2 was also
measured, and although not analyzed in this study, these markers can also be used to run
genome-wide association studies. Once significant locations in the genome are found, they can
be compared to significant genetic factors found by mRNA or chromatin accessibility studies. If
a particular genetic locus is found to be significantly associated with both proliferation and
cortical surface area, this would be evidence to support the radial unit hypothesis and a role for
proliferation in determination of cortical surface area. Functional experiments using CRISPR or
other genetic tools in animal models such as mice to test different alleles for a particular genetic
locus could allow measurement of both surface area and behavioral effects of a genetic variant,
providing an experimental link to phenotypes that could model neuropsychiatric illness and
contribute to our understanding of the origins of these diseases.
Acknowledgements: I would like to thank the Stein Lab for being an exciting and challenging
place to work; in particular I would like to thank Dr. Stein, Oleh Krupa, and Nil Aygun for their
help with my thesis and Jessica Mory for her collaboration and moral support. This study was
supported by the National Institute of Mental Health (R00MH102357 to Dr. Stein). Microscopy
funding from the NIH-NINDS Neuroscience Center Support Grant P30 NS045892 and the
NIH-NICHD Intellectual and Developmental Disabilities Research Center Support Grant U54
Figure 1 . Schematic Cartoon of Experimental Design
Figure 2. Representative Images of Ki67 and DAPI staining
Figure 3. Evaluation of Image Analysis Accuracy
Figure 3 . A). Quantification of merge and split errors in DAPI segmentation. On average, 2.5%
of identified cells had merge errors and 0.78% of identified cells had split errors. B)
Representative examples of split and merge errors. C). Precision and recall for DAPI
segmentation. D). Precision and recall for identification of Ki67+ cells in the Cy5 channel.
Figure 5. Relationship of Round of Cell Culture and Ki67 Expression
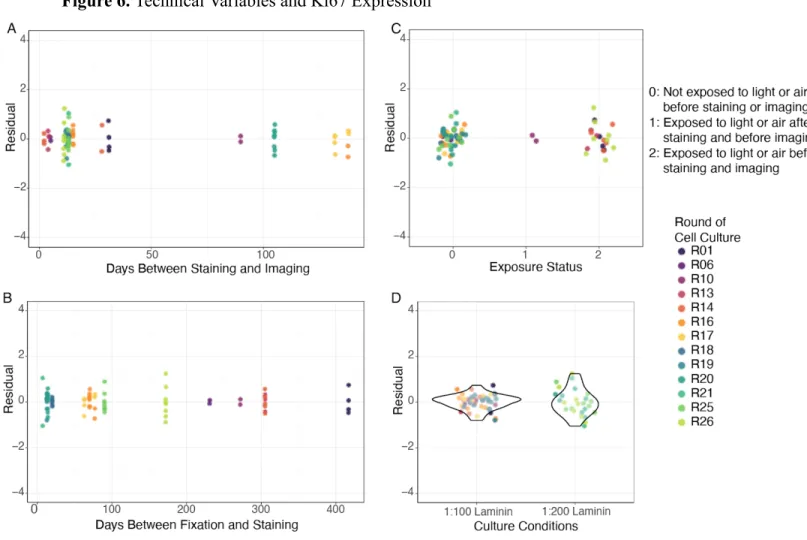
Figure 6. Technical Variables and Ki67 Expression
Figure 6. A) Time between staining and imaging is not significantly related to Ki67 expression
(p=0.478). B) Time between fixation and staining is not significantly related to Ki67 expression
(p=0.999). C) Light exposure status is not significantly related to Ki67 expression (p=1). D) Cell
Figure 7. Biological Variation and Ki67 Expression
Figure 7. There was not a significant relationship between gestation week of the donor (A,
References
Boedhoe, P. S. W., Schmaal, L., Abe, Y., Alonso, P., Ameis, S. H., Anticevic, A., … van den
Heuvel, O. A. (2017). Cortical abnormalities associated with pediatric and adult
obsessive-compulsive disorder: Findings from the enigma obsessive-compulsive disorder
working group. American Journal of Psychiatry, 175(5), 453–462.
https://doi.org/10.1176/appi.ajp.2017.17050485
Durak, O., Gao, F., Kaeser-Woo, Y. J., Rueda, R., Martorell, A. J., Nott, A., … Tsai, L.-H.
(2016). Chd8 mediates cortical neurogenesis via transcriptional regulation of cell cycle and Wnt
signaling. Nature Neuroscience, 19(11), 1477–1488. https://doi.org/10.1038/nn.4400
Erp, T. G. M. van, Walton, E., Hibar, D. P., Schmaal, L., Jiang, W., Glahn, D. C., … Turner, J. A.
(2018). Cortical brain abnormalities in 4474 individuals with schizophrenia and 5098 control
subjects via the enhancing neuro imaging genetics through meta analysis (Enigma) consortium.
Biological Psychiatry, 84(9), 644–654. https://doi.org/10.1016/j.biopsych.2018.04.023
Grasby, K. L., Jahanshad, N., Painter, J. N., Colodro-Conde, L., Bralten, J., Hibar, D. P., …
Medland, S. E. (2020). The genetic architecture of the human cerebral cortex. Science ,
367 (6484). https://doi.org/10.1126/science.aay6690
Hibar, D. P., Westlye, L. T., Doan, N. T., Jahanshad, N., Cheung, J. W., Ching, C. R. K., …
Andreassen, O. A. (2018). Cortical abnormalities in bipolar disorder: An MRI analysis of 6503
individuals from the ENIGMA Bipolar Disorder Working Group. Molecular Psychiatry, 23(4),
932–942. https://doi.org/10.1038/mp.2017.73
Hirschhorn, J. N. (2009). Genomewide association studies—Illuminating biologic pathways.
Le, B. D., & Stein, J. L. (2019). Mapping causal pathways from genetics to neuropsychiatric
disorders using genome-wide imaging genetics: Current status and future directions. Psychiatry
and Clinical Neurosciences, 73(7), 357–369. https://doi.org/10.1111/pcn.12839
Llinares-Benadero, C., & Borrell, V. (2019). Deconstructing cortical folding: Genetic, cellular
and mechanical determinants. Nature Reviews Neuroscience, 20(3), 161–176.
https://doi.org/10.1038/s41583-018-0112-2
Lui, J. H., Hansen, D. V., & Kriegstein, A. R. (2011). Development and Evolution of the Human
Neocortex. Cell , 146 (1), 18–36. https://doi.org/10.1016/J.CELL.2011.06.030
Piven, J., Elison, J. T., & Zylka, M. J. (2017). Toward a conceptual framework for early brain
and behavior development in autism. Molecular Psychiatry , 22 (10), 1385–1394.
https://doi.org/10.1038/mp.2017.131
Pollen, A. A., Nowakowski, T. J., Chen, J., Retallack, H., Sandoval-Espinosa, C., Nicholas, C.
R., … Kriegstein, A. R. (2015). Molecular Identity of Human Outer Radial Glia during Cortical
Development. Cell , 163 (1), 55–67. https://doi.org/10.1016/j.cell.2015.09.004
Rakic, P. (2009). Evolution of the neocortex: A perspective from developmental biology. Nature
Reviews Neuroscience, 10(10), 724–735. https://doi.org/10.1038/nrn2719
Ronneberger, O., Fischer, P., & Brox, T. (2015). U-net: Convolutional networks for biomedical
image segmentation. Retrieved from https://arxiv.org/abs/1505.04597v1
Schmaal, L., Hibar, D. P., Sämann, P. G., Hall, G. B., Baune, B. T., Jahanshad, N., … Veltman,
D. J. (2017). Cortical abnormalities in adults and adolescents with major depression based on
brain scans from 20 cohorts worldwide in the ENIGMA Major Depressive Disorder Working
Schwarzkopf, D. S., Song, C., & Rees, G. (2011). The surface area of human V1 predicts the
subjective experience of object size. Nature Neuroscience, 14(1), 28–30.
https://doi.org/10.1038/nn.2706
Song, C., Schwarzkopf, D. S., Kanai, R., & Rees, G. (2015). Neural population tuning links
visual cortical anatomy to human visual perception. Neuron , 85 (3), 641–656.
https://doi.org/10.1016/j.neuron.2014.12.041
Visscher, P. M., Wray, N. R., Zhang, Q., Sklar, P., McCarthy, M. I., Brown, M. A., & Yang, J.
(2017). 10 years of gwas discovery: Biology, function, and translation. The American Journal of
Human Genetics, 101(1), 5–22. https://doi.org/10.1016/j.ajhg.2017.06.005
Wang, L., Hou, S., & Han, Y.-G. (2016). Hedgehog signaling promotes basal progenitor
expansion and the growth and folding of the neocortex. Nature Neuroscience, 19(7), 888–896.
https://doi.org/10.1038/nn.4307
Woodhead, G. J., Mutch, C. A., Olson, E. C., & Chenn, A. (2006). Cell-autonomous beta-catenin
signaling regulates cortical precursor proliferation. Journal of Neuroscience, 26(48),
12620–12630. https://doi.org/10.1523/JNEUROSCI.3180-06.2006
Zhou, C.-J., Borello, U., Rubenstein, J. L. R., & Pleasure, S. J. (2006). Neuronal production and
precursor proliferation defects in the neocortex of mice with loss of function in the canonical
Wnt signaling pathway. Neuroscience, 142(4), 1119–1131.