David C. Wyld et al. (Eds) : CCSIT, SIPP, AISC, NLP - 2015
pp. 73–83, 2015. © CS & IT-CSCP 2015 DOI : 10.5121/csit.2015.50407
A
D
ECISION
T
REE
B
ASED
P
EDOMETER
AND ITS
I
MPLEMENTATION ON
T
HE
A
NDROID
P
LATFORM
Juanying Lin, Leanne Chan and Hong Yan
Department of Electronic Engineering, City University of Hong Kong, Hong Kong, China
[email protected],[email protected]
A
BSTRACTThis paper describes a decision tree (DT) based pedometer algorithm and its implementation on Android. The DT- based pedometer can classify 3 gait patterns, including walking on level ground (WLG), up stairs (WUS) and down stairs (WDS). It can discard irrelevant motion and count user’s steps accurately. The overall classification accuracy is 89.4%. Accelerometer, gyroscope and magnetic field sensors are used in the device. When user puts his/her smart phone into the pocket, the pedometer can automatically count steps of different gait patterns. Two methods are tested to map the acceleration from mobile phone’s reference frame to the direction of gravity. Two significant features are employed to classify different gait patterns.
K
EYWORDSPedometer, Decision Tree, Sensor, Gait analysis &Classification, Mobile Phone Applications.
1.
I
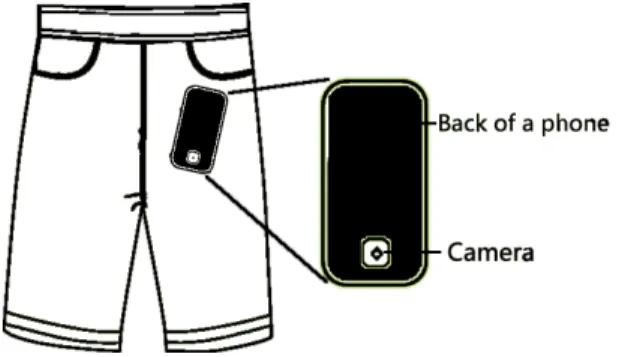
NTRODUCTIONCommonly used pedometers are often built as separate products and their accuracy is often affected by random motions. In this paper, we present a new method to count steps of walking using a mobile phone. We use several sensors to extract signal features and a decision tree to perform data classification. Gyroscopes and accelerometers are wildly used to detect human motions. Gyroscope sensor is used to measure the angular velocity of an object. Doheny et al. used a single gyroscope to analyze spatial gait [1]. Lim et al. proposed a gyroscope-based pedometer [2]. A gyroscope is adhered to the right shank segment to detect user’s motion. The work presented here uses gyroscope to measure angular velocity of user’s thigh, when the phone is in the user’s pocket as shown in Figure 1.
The accelerometer can be used as a sensor to measure the acceleration of an object. Aguiar et al.
used the accelerometer embedded in smart phone to detect falling of theelder [3]. Mantyjarvi et
al. used accelerometers to recognize human motions [4]. The magnetic field sensor is often used in global positioning system navigation. In this work, data from this sensor are used to generate a rotation matrix. Using the matrix and the original acceleration, the vertical acceleration can be determined. Decision tree is one of the predictive modeling approaches used in statistics, data mining and machine learning. In a decision tree [5], leaves represent target values, which are also called class labels, and branches represent measurements about an item, which is also called a feature. Manap et al. used decision tree to detect parkinsonian gait motor impairment [6].
Figure 1. An example of a mobile phone in the user’s pocket.
In the work by Lovell et al. [7], a sliding window with a size of 128 samples is used to segment signal of acceleration. In our work, an angular velocity based algorithm is developed to segment the signal of acceleration. Using this algorithm, classification and step counting can be done at the same time. In many pervious work of pedometer or gait classification, such as [2], [7], [8], researchers did not consider the capacity of anti-interference of their systems. In our method, daily irrelevant motions are added to the training set to improve the capacity of anti-interference of the system.
2.
S
YSTEMS
TRUCTUREFigure 2. System follow chart of the pedometer.
The system structure of the proposed pedometer is shown in Figure 2. Signals of original acceleration, angular velocity and magnetic field are recorded with a sampling frequency of 100 Hz. Then the signals will be cut into small segments. After that, original acceleration is mapped to the direction of the gravity. The features are extracted from each segment. Finally, all features are sent to the decision tree to classify each segment.
System Start Sensor: Collect data
Segment the signal Acceleration mapping
Feature extraction Classification and count steps
3.
S
IGNALP
ROCESSINGA
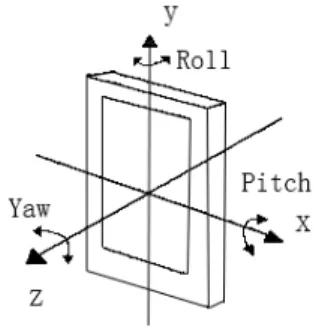
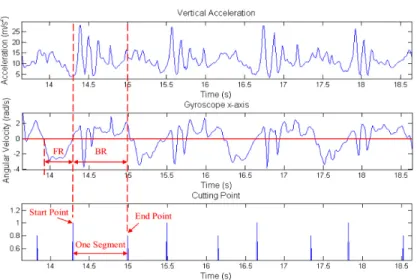
LGORITHMS 3.1. Algorithms for signal segmentingTo the thigh, a cycle of walking only contains 2 phases, forward rotation (FR) and backward rotation (BR). According to the case shown in Figure 1 and the reference frame of gyroscope shown in Figure 3, BR and FR can be detected by the x-axis of gyroscope in mobile phone.
Figure 3. Three axes of the gyroscope in a mobile phone.
Most mobile phones now have a large screen and occupy most space of user’s pocket. Therefore, the position of mobile phone is usually stable in the user’s pocket and it is reliable to use the x-axis to detect FR and BR. FR and BR can be easily recognized in the signal of x-x-axis as shown in Figures 5, 6 and 7. The principle of the algorithm is to detect FR of user’s thigh and use it to separate signal of each step. The system will continue to monitor the angular velocity of x-axis and detect FR.
If there are 15 consecutive data points whose values are all less than -1 rad/s, an FR is detected. The start point of a segment is the first data point with positive value after the FR. The start point is located by monitoring the first positive point after detecting the 15 consecutive negative points. The end point of a segment is the last peak whose value is larger than 1 rad/s, before the FR of the
next step. A peak is located by checking whether there is a data point denoted by x(n) that meets
the requirement : x(n)-x(n-1)>0 and x(n+1)-x(n)<0, where n denotes the index of the data point.
After setting the start point, if no FR is detected, the end point of the segment will be set to be the 150th data point after the start point. The signals of angular velocity and vertical vibration are segmented according to start points and end points as shown in Figures 4, 5, 6 and 7. FR is an important element of a walk-like event. If no FR is detected, no segments will be created as illustrated by the signals after the segmentation in Figure 8. Therefore, some irrelevant motions are discarded and the reliability of the system is improved.
Using this algorithm, one segment represents a walk-like event. The system can simply count the number of segments, which are considered to be true walk events by a decision tree, and obtain
the number of steps of different gait patterns as shown in Figure 8. Let SWLG, SWUS, and SWDS
denote the number of steps of the 3 gait patterns. The mobile phone only monitors one of user’s thighs. Therefore, one segment represents 2 steps.
If a sliding window is used, one step might be detected with 2 consecutive windows, and the number of segments is not equal to the number of steps. Also, a step near the boundary of a segment might be missed, if the step counting algorithm is applied to a larger segment that consists of several small segments.
Figure 4. Signals of walking on a level ground
Figure 5. Signals of walking up stairs.
Figure 7. Signals of walking down stairs.
Figure 8. Gait classification and step counting.
3.2 Acceleration mapping
The acceleration given by the mobile phone is respected in the mobile phone reference frame shown in Figure 3. Vertical vibration is a significant signal induced by the walk. Therefore, original acceleration needs to be mapped to the direction of the gravity to generate the signal of vertical vibration. There are two methods to achieve it.
In the first method, we calculate the angle between vector of linear acceleration provided by linear acceleration sensor and the vector of g provided by gravity sensor, where g denotes the
acceleration due to gravity, and |g|=9.8 m/s2. Let Alinear denote the linear acceleration, AGD denote
the value of the acceleration in the direction of gravity, and xlinear, ylinear and zlinear denote elements
of the vector of Alinear respectively, then they can be computed as follows.
A segment
A decision tree
Irrelevant motion Discarded
WLG WUS WDS SWLG=SWLG+2 Feature extraction SWUS=SWUS+2 SWDS=SWDS+2
In the second method, a rotation matrix can be generated by getRotationMatrix, a function provided by Android, using data from the accelerometer and the magnetic field. Then the original
acceleration can be mapped to the direction of gravity. Let AGD denote the value of the
acceleration in the direction of gravity, Mrotation denote the rotation matrix and Aoriginal denote the
vector of acceleration respecting to mobile phone’s reference frame, then
In Android, there are two kinds of sensors, hardware-based sensors and software-based sensors. Software-based sensors need data from several hardware-based sensors to produce its own data [9]. This means they need more time to process their data. Linear acceleration sensor and gravity sensor are software-based. Method 2 is better than Method 1 because the former is based on hardware-based sensors and needs less time to generate the data.
4.
S
IGNIFICANTF
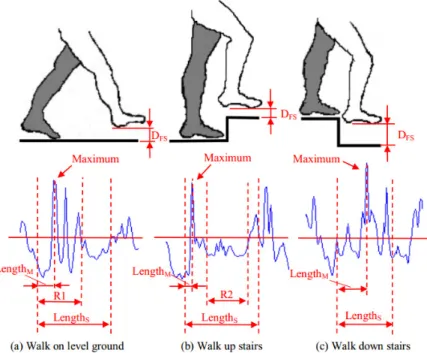
EATURESIn Figure 9, DFS denotes the distance between one’s foot and the surface of ground or stairs.
LengthM denotes the length between the start point and the point of the maximum in a segment.
LengthS denotes the length of a segment. In the signal of vertical vibration, two significant
features, location of peak in a segment and variance are found to classify different gait patterns.
4.1. Location of the maximum in a segment
The definition is shown as follows. LocationM denotes the location of the maximum in a segment.
Data of a segment is recorded in an array. Each data point has its own index. IndexS denotes the
index of the start point. IndexE denotes the index of the end point. IndexM denotes the index of the
data point with maximum value. LengthS denotes the length of a segment. LengthM denotes the
distance between the start point and the point with the maximum value. (5) (6)
Figure 9. Gait analysis and signal of vertical vibration
Signal in a segment represents the BR of user’s thigh, as shown in Figure 9. In motions of walking on level ground or walking up stairs, when the user begins to rotate his/her thigh
backward, his/her foot will soon touch the surface, due to small DFS. Then vibration is induced by
heel strike. Therefore, the maximum is located near the start point of a segment. When walking
down stairs, DFS is larger. After beginning to rotate one’s thigh backward, one’s foot will not soon
touch the surface and induce vibration. Then the maximum is not located near the start point. This feature can separate the motion of walking down stairs from the other 2 gait patterns.
4.2 Variance of a segment
Let Da denote the average of data values in a segment, n denote the number of data points, and Di
denote a specified data point. Var denotes the variance of a segment. We calculate the variance of a segment as follows
(8)
(9)
In Figure 9, R1 and R2 denote 2 ranges in the signals of walking on level ground and down stairs respectively. R1 is a range of vibration. This range will increase the variance of the segment. Compared with R1, R2 is a range that is relatively flat. R2 will decrease the variance of the segment. Therefore, the variance of a segment of walking on level ground will be larger than that in a segment of walking up stairs. Using this feature, the motion of walking on level ground can be distinguished from the motion of walking up stairs.
balanced. If one class is the majority in a training set, the decision tree created by this training set is more likely to classify an unknown instance to that class. Then C4.5 algorithm in Weka is used to identify distinct features and create a decision tree, according to the training set. Six features are selected to create the decision tree as shown in Figure 10. In this figure, “Ground” denotes walking on level ground. “Up” denotes walking up stairs. “Down” denotes walking down stairs. “Other” denotes irrelevant motion. In the signal of vertical acceleration, AcceleGMin denotes the minimum value, AcceleGMax denotes the maximum value, AcceleGAverage denotes the average, AcceleGMaxL denotes the location of the maximum and AcceleGVar denotes the variance. In the signal of angular velocity, GyroMin denotes the minimum.
Figure 10. Decision tree used in the system
While creating the classifier Weka also evaluate the performance of this predictive model. Cross validation is a common method to evaluate the accuracy of classifiers [10]. In Leave One-Out (LOO) cross validation, one subject is used for testing and the rest are used for training. The classification result is then computed and repeated until all subjects have participated in the testing dataset. The overall classification result is then computed as the average of all testing subjects [13]. Here 10-folder cross-validation is used to measure the accuracy of this classifier. In
the cross-validation, the whole training dataset is divided into 10 subsets. One subset is used for testing the rest are used for training. The classification accuracy of this decision tree is 92.3645 %. Another measure of classification algorithms performance is a confusion matrix [14]. Precision and recall are typical classification performance measures using the confusion matrix [15]. Precision and recall are defined as:
(10)
(11)
To a class in training dataset, TP (True Positive) denotes the number of correctly classified positive instances, FN (false negative) denotes the number of positive instances incorrectly classified as negative; TN (true negative) denotes the number of correctly classified negative instances and FP( false positive) denotes number of negative instances incorrectly classified as positive. The precise and recall of each class is shown in table 1.
Table.1 Confusion matrix of the decision tree
Classified as Measurement
Class WLG WUS WDS Other TP FP FN Precision Recall
WLG 93 1 2 4 93 4 7 95.9% 93.0%
WUS 1 87 0 4 87 8 5 91.6% 94.6%
WDS 0 1 80 6 80 5 7 94.1% 92.0%
Other 3 6 3 115 115 14 12 89.1% 90.6%
6.
E
XPERIMENTR
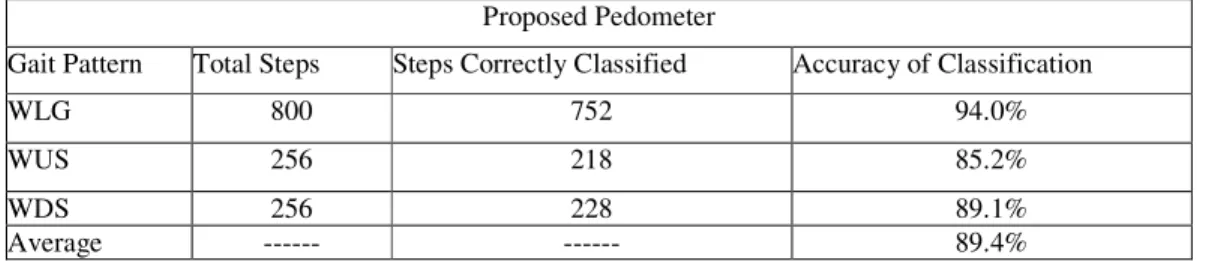
ESULTThe decision tree based pedometer is tested in a walking experiment and an anti-interference experiment. Subjects were asked to wear a Samsung Gear fit [16], a wearable device, in the two experiments. Then the efficiency of the proposed system can be compared with that of the Gear fit. Four subjects participated in these two experiments. In the walking experience, each subject was asked to take 200 steps on level ground, go up 4 floors, then go down 4 floors. Each floor has 16 stairs. In the anti-interference experiment, subjects were asked to shake or swing the mobile phone and the Gear fit 10 times at the same time and to see whether the pedometer and Gear fit take those motions as steps. Samsung Gear fit cannot classify gait patterns. The accuracy of Gear fit in Table 1 only represents the accuracy of step detection. In the walking experiment, the overall classification accuracy is 89.4%. In the anti-interference experiment, the average false steps recorded by the pedometer are 2.5, while Gear fit produces 12 false steps, as shown in Table 2.
Table .1 Accuracy of step detection
Proposed Pedometer Samsung Gear Fit
Gait Pattern
Total Steps
Steps Detected Accuracy of Step Detection Steps Detected Accuracy of Step detection WLG 800 776 97.0% 779 97.4% WUS 256 230 89.8% 235 91.8% WDS 256 238 92.9% 210 82.0% Average --- --- 93.2% --- 90.4%
WDS 256 228 89.1%
Average --- --- 89.4%
Table 3. Result of anti-interference experiment
False Steps Recorded
Subject1 Subject2 Subject3 Subject4 Average
Proposed Pedometer 2 0 4 4 2.5
Gear fit 13 10 17 8 12
7.
C
ONCLUSIONA decision-based pedometer that can count steps and classify 3 gait patterns is developed. An angular velocity based algorithm is used in this pedometer to segment signals and enable the pedometer to count steps of different gait patterns easily. The decision tree is used to improve the accuracy and reliability of the pedometer. The system has been tested in several experiments with good results. The experiment results show that the proposed pedometer produces much less false step count than a commercial product.
ACKNOWLEDGEMENTS
This work is supported by City University of Hong Kong (Project 6987027).
REFERENCES
[1] E.P.Doheny, T.G.Foran and B.R.(2010) Greene, "A single gyroscope method for spatial gait analysis," in Proc. EMBC, pp. 1300-1303.
[2] Y.P.Lim, I.T.Brown and J.C.T.Khoo,( 2008) "An accurate and robust gyroscope-based pedometer," in Proc. EMBS, pp. 4587-4590.
[3] B.Aguiar, T.Rocha, J.Silva and I.Sousa,(2014) "Accelerometer-based fall detection for smartphones," in Proc. MeMeA, pp. 1-6.
[4] J.Mantyjarvi, J.Himberg and T.Seppanen,(2001) "Recognizing human motion with multiple acceleration sensors," in Proc. Systems, Man, and Cybernetics, vol. 2, pp.747-752.
[5] Rokach, L., O.Maimon,(2008) Data mining with decision trees: theory and applications, World Scientific Pub Co Inc, pp vii and 71.
[6] H.H.Manap, N.Md Tahir, R.Abdullah,(2013) "Parkinsonian Gait Motor Impairment Detection Using Decision Tree," in Proc. EMS, pp. 209-214.
[7] N.H.Lovell, N.Wang, E.Ambikairajah, B.G. Celler,(2007) "Accelerometry Based Classification of Walking Patterns Using Time-frequency Analysis," in Proc. EMBS, pp. 4899-4902.
[8] J.S.Wang, C.W.Lin, T.C.Yang, Y.J Ho,(2012) "Walking Pattern Classification and Walking Distance Estimation Algorithms Using Gait Phase Information," IEEE Trans. Biomedical Engineering, vol. 59, no. 10, pp. 2884-2892.
[9] Motion Sensors in Android http://developer.android.com/guide/topics/sensors/sensors_motion.html [10] R.O.Duda, P.E.Hart & D. G. Stork,(2001) Pattern Classification. 2nded, New York: Wiley.
[11] Z.Chi and H.Yan, (1996) "ID3-derived fuzzy rules and optimized defuzzification for handwritten numeral recognition," IEEE Trans. on Fuzzy Systems, vol. 4, no. 1, pp. 24-31.
[12] S.Zhao, Z.Chi, P. Shi and H. Yan, (2003) "Tow-stage segmentation of handwritten Chinese characters based on fuzzy decision rules," Pattern Recognition, vol. 36, pp. 145-156.
[13] A.Murad, T.Sarkodie-Gyan, H.Y.Yu, O.Fuentes, R.Brower. & A.Abdelgawad, (2011) "Automatic classification of pathological gait patterns using ground reaction forces and machine learning algorithms," EMBC, pp.453-457.
[14] N.V.Chawla, K.W.Bowyer, L.O.Hall, and W.P.Kegelmeyer, (2002) "SMOTE: Synthetic Minority Over-sampling Technique", Journal of Artificial Intelligence Research, vol. 16, pp. 321 -357.
[15] D.L.Olson & D.Delen (2008) Advanced Data Mining Techniques. Springer. [16] Information on Samsung Gear Fit:
http://www.samsung.com/global microsite/gear/gearfit_features.html
AUTHORS
Juanying Lin received his master degree in Electronic and Information Engineering from City University of Hong Kong. He is currently a research assistant in the Department of Electronic Engineering at City University of Hong Kong. His research interests include digital image processing, motion pattern recognition and mobile computing.
Leanne Chan received her PhD degree in Biomedical Engineering from University of Southern California. She is currently Assistant Professor in the Department of Electronic Engineering at City University of Hong Kong. Her research interests include retinal prosthesis testbed development and microelectronic systems.
Hong Yan received his Ph.D. degree from Yale University. He was professor of imaging science at the University of Sydney and currently is professor of computer engineering at City University of Hong Kong. He was elected an IAPR fellow for contributions to document image analysis and an IEEE fellow for contributions to image recognition techniques and applications. His research interests include bioinformatics, image processing and pattern recognition.