MICROBIOME-MEDIATED METABOLIC ACTIVITY AND WEIGHT DYSREGULATION IN ANOREXIA NERVOSA
Susan C. Kleiman
A dissertation submitted to the faculty at the University of North Carolina at Chapel Hill in partial fulfillment of the requirements for the degree of Doctor of Philosophy in the Department
of Nutrition in the Gillings School of Global Public Health.
Chapel Hill 2016
ABSTRACT Susan C. Kleiman:
Microbiome-Mediated Metabolic Activity and Weight Dysregulation in Anorexia Nervosa (Under the direction of Cynthia M. Bulik)
Anorexia nervosa (AN) is a serious and often life-threatening psychiatric disorder that continues to perplex clinicians and researchers. Treatment outcome is poor, and despite
significant morbidity and mortality, the evidence base for treatment is weak. The biology of AN is poorly understood, which has hindered development of novel interventions. Compelling evidence that the intestinal microbiota regulates key features of AN, including weight, energy metabolism, anxiety, and depression, provides a strong rationale for exploring the role of this complex microbial community in relation to the disorder. Changes in gut microbial communities associated with extreme weight loss may perpetuate and contribute to AN via direct effects on weight and mood.
To better understand the role of the intestinal microbiota in physiologic changes associated with AN, we (i) characterized the composition and diversity of the intestinal
We found evidence of an intestinal microbial dysbiosis in patients with acute AN, marked by lower microbial diversity and taxonomic differences from healthy controls. Moreover, we found compositional changes to the intestinal microbiotas of patients with AN during hospital-based renourishment, as well as relative changes in fecal energy content. Although we saw associations between microbial markers and psychopathology in patients with AN, there were no significant associations between microbial composition and diversity and psychiatric measures in healthy adult females.
This work introduced a novel approach to studying the pathophysiology of AN by profiling the intestinal microbiota in individuals with AN using high-throughput 16S rRNA sequencing. Ultimately, we may identify bacterial taxa whose promotion or elimination would improve the efficacy and efficiency of therapeutic weight restoration, as well as the
TABLE OF CONTENTS
LIST OF TABLES……….vii
LIST OF FIGURES………..viii
LIST OF ABBREVIATIONS……….ix
CHAPTER 1: GUT FEELINGS: A ROLE FOR THE INTESTINAL MICROBIOTA IN ANOREXIA NERVOSA?………..1
1.1 The pathophysiology of anorexia nervosa remains unclear………...1
1.2 A dysbiosis or microbial imbalance in the intestinal microbiota exists in patients with anorexia nervosa………2
1.3 The intestinal microbiota influences adiposity in humans and animal models……….3
1.4 The intestinal microbiota influences behavior in humans and animal models………..4
1.5 The intestinal microbiota is a valid intervention target……….5
CHAPTER 2: THE INTESTINAL MICROBIOTA IN ACUTE ANOREXIA NERVOSA AND DURING RENOURISHMENT: RELATIONSHIP TO DEPRESSION, ANXIETY, AND EATING DISORDER PSYCHOPATHOLOGY…………...9
2.1 Introduction………....9
2.2 Methods………12
2.3 Results………..16
2.4 Discussion………18
CHAPTER 3: ENTERIC MICROBIOME-MEDIATED DIETARY ENERGY EXTRACTION IN ACUTE ANOREXIA NERVOSA: A PILOT STUDY……….32
3.1 Introduction………..32
3.3 Results………..34
3.4 Discussion………35
CHAPTER 4: THE GUT-BRAIN AXIS IN HEALTHY FEMALES: LACK OF ASSOCIATION BETWEEN MICROBIAL COMPOSITION AND DIVERSITY AND PSYCHIATRIC MEASURES………...41
4.1 Introduction………..41
4.2 Methods………....42
4.3 Results………..46
4.4 Discussion………48
CHAPTER 5: DAILY CHANGES IN COMPOSITION AND DIVERISTY OF THE INTESTINAL MICROBIOTA IN PATIENTS WITH ANOREXIA NERVOSA: A CASE SERIES………..55
5.1 Introduction………..55
5.2 Methods………...56
5.3 Results……….60
5.4 Discussion………....61
CHAPTER 6: SUMMARY AND FUTURE DIRECTIONS………69
6.1 Summary of Findings………..69
6.2 Significance and Limitations………...74
6.3 Future Directions……….76
LIST OF TABLES
Table 1 – Hospital admission (T1) vs. hospital discharge (T2): differences in
microbial taxa and diversity measures in females with AN (n=10)………..22
Table 2 – Hospital admission (T1): differences in microbial taxa and diversity measures in females with AN (n=16) vs. healthy comparison group (n=12)………23
Table 3 – Hospital discharge (T2): differences in microbial taxa and diversity measures in females with AN (n=10) vs. healthy comparison group (n=12)………24
Table 4 – Hospital admission (T1): microbial taxa and diversity measures associated with depression and/or anxiety in females with AN (n=15)………25
Table 5 – Hospital admission (T1): microbial taxa and diversity measures associated with eating disorder psychopathology in females with AN (n=15)……….26
Table 6 – Hospital admission (T1) vs. hospital discharge (T2): associations between microbial taxa and diversity measures in females with AN………38
Table 7 – Demographic and clinical characteristics of participants (n=91)………..52
Table 8 – Demographic and clinical characteristics of patients (n=3)………..64
Table 9 – Weekly metabolic indicators: Patient A………65
Table 10 – Weekly metabolic indicators: Patient B………..66
LIST OF FIGURES
Figure 1 – Heatmaps of samples from patients with AN at hospital admission (T1; n=16) and discharge (T2; n=10) at the (A) phylum and (B) genus
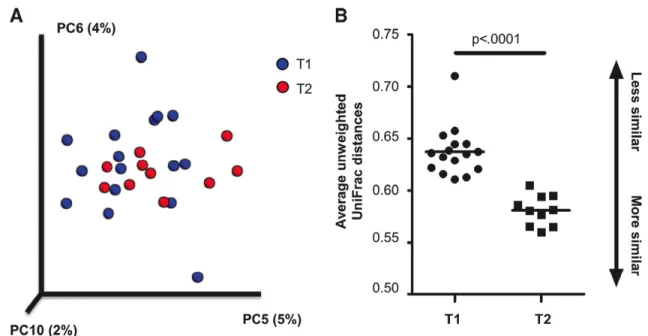
taxonomic levels………28 Figure 2 – Principal coordinate plot of samples from patients with AN and
average unweighted UniFrac distances at hospital admission (T1; n=16) and
discharge (T2; n=10)……….29 Figure 3 – Alpha diversity in samples from patients with AN at hospital
admission (T1; n=16) and discharge (T2; n=10) and a healthy comparison
group (n=12)………..30 Figure 4 – Correlation between depression and alpha diversity in samples
from patients with AN at hospital admission (T1)………31 Figure 5 – Fecal energy content in paired samples from individuals (n=7)
during hospitalized treatment for AN………39 Figure 6 – Association between fecal energy content and intestinal microbial
measures in samples (n=24) from individuals (n=15) during hospitalized
treatment for AN………40 Figure 7 – Histograms of p-values for associations with psychiatric measures
by taxonomic level……….53 Figure 8 – Principal coordinate plots of psychiatric measures by quartile………54 Figure 9 – Intestinal microbiotas of three AN patients during therapeutic
LIST OF ABBREVIATIONS
AN Anorexia nervosa BAI Beck Anxiety Inventory BDI Beck Depression Inventory-II BMI Body mass index
CEED Center of Excellence for Eating Disorders EDE-Q Eating Disorder Examination-Questionnaire FMT Fecal microbial transplantation
FDR False discovery rate GABA Gamma-aminobutyric acid
GF Germ-free
GI Gastrointestinal
HCG Healthy comparison group IBD Inflammatory bowel diseases IBS Irritable bowel syndrome
Mini IPIP Mini International Personality Item Pool PC Principal coordinate
PCR Polymerase chain reaction PSS Perceived Stress Scale
CHAPTER 1 GUT FEELINGS:
A ROLE FOR THE INTESTINAL MICROBIOTA IN ANOREXIA NERVOSA?1 1.1 The pathophysiology of anorexia nervosa remains unclear
Anorexia nervosa (AN) affects 0.9% of women and 0.3% of men in the United States(1) and continues to perplex clinicians and researchers. Treatment outcome is poor, especially in adults, and AN has the highest mortality rate of any psychiatric disorder.(2, 3) Despite
significant morbidity and mortality,(1-4) the evidence base for the treatment of AN is weak.(5, 6) Although a fundamental first step in treatment, few clinical trials exist that explore how best to renourish individuals with AN, and treatment approaches are typically based on clinical opinion or guidelines.(7) Moreover, gastrointestinal effects of refeeding are uncomfortable, distressing, and painful, and body fat redistribution after refeeding is unequal, with disproportionate central adipose tissue deposition.(8) Low treatment acceptance and high treatment dropout are common. To date, the biology of AN and the physical adaptations that occur during weight restoration are poorly understood. New lenses through which to view the disorder are essential to advance understanding and enhance treatment.
Genetic epidemiological investigations indicate that AN has a strong genetic etiology.(9, 10) Indeed, a significant familial association has been reported for AN,(11, 12) and twin studies estimate heritability at 48-74%.(9, 10, 13, 14) Although a strong genetic component exists, twin
studies clarify that environmental factors or gene environment interactions are also implicated and are worthy of investigation.
Humans coexist with numerous diverse microbial communities, or microbiotas, living in and on the human body. The intestinal microbiota refers to living organisms, including
prokaryotes, eukaryotes, archaea, and viruses, while the microbiome refers to the cumulative genomes of these organisms. Although each person has a unique microbiota, a core set of microorganisms is common across individuals.(15, 16) The environment, including long-term dietary patterns, exerts profound influence on the intestinal microbiota.(17, 18) Short-term dietary changes can also induce measurable microbial shifts.(19)
Compelling evidence that the intestinal microbiota regulates key features of AN, including weight regulation, energy metabolism,(20) anxiety, and depression,(21) provides a strong rationale for exploring the role of this complex microbial community in the disorder. However, the functional role of enteric microbes in AN has never been comprehensively explored.(22, 23) Based on the existing literature, it is logical to posit that changes to gut
microbial communities associated with extreme weight loss may perpetuate and contribute to AN via direct effects on weight and mood. Defining alterations and functional effects of AN
intestinal microbiotas on adiposity and behavior could provide new mechanistic insights into this
perplexing illness and guide new treatment paradigms.
1.2 A dysbiosis or microbial imbalance in the intestinal microbiota exists in patients with anorexia nervosa
intestinal microbiota in AN.(23) However, further research is needed to investigate whether these new species are uniquely associated with AN. Moreover, a molecular-based study analyzing the intestinal microbiota of nine patients with AN found increased levels of the archaeon
Methanobrevibacter smithii.(22) Although intriguing, this study was cross-sectional and used a narrow approach [quantitative polymerase chain reaction (PCR) of specific bacterial taxa] to determine the abundances of a limited number of microbial groups (n=4). Given that the intestinal microbiota encompasses 500–1,000 different microbial species,(24) a more
comprehensive characterization of the intestinal microbiota in AN, how it changes following treatment, and how it differs from healthy controls is warranted. Exploration of longitudinal changes in the intestinal microbiota in patients with AN over the course of medically supervised
weight restoration would provide new insights into how current AN treatment impacts enteric
microbes and how microbial shifts may contribute to adipose distribution and behavior.
1.3 The intestinal microbiota influences adiposity in humans and animal models
Consistent evidence implicates the intestinal microbiota in excessive accumulation and storage of fat in humans.(25, 26) Additionally, in mice, obese intestinal microbiotas are more effective at extracting calories from food and stimulating host accumulation of fat than
microbiotas of lean mice.(27) Transfer of microbiotas from mouse models of diet- or genetically-induced obesity to germ-free (GF) mice is sufficient to stimulate increased adiposity and
metabolic dysfunction.(27) Similarly, fecal samples transplanted to mice from obese adult humans transmit obesity-associated phenotypes via the intestinal microbiota.(20) Given that AN is marked by extreme weight dysregulation and is treated initially by weight restoration,(28)
exploring the functional impact of a dysbiotic intestinal microbiota on adiposity in AN is a
response.
1.4 The intestinal microbiota influences behavior in humans and animal models
A majority of individuals with AN report a lifetime history of comorbid anxiety disorders (75%)(29-31) or major depressive disorder (80%).(32) Animal models provide evidence that enteric microbes significantly influence both anxiety and depression, and many studies have documented behavioral changes following pathogenic infection or manipulation of the intestinal microbiota. For example, infection with a pathogenic microbe increases anxiety-like
behavior,(33-35) and GF mice exhibit reduced anxiety-like behavior that is reversed upon reconstitution with a gut microbiota.(36-39) Furthermore, GF BALB/c mice colonized with an NIH Swiss intestinal microbiota show reduced anxiety-like behavior compared to GF NIH Swiss mice colonized with a BALB/c microbiota, indicating that gut microbe-associated changes in anxiety are transmissible and are affected by the composition of the intestinal microbiota.(40) Probiotics have been shown in animal models to reduce depressive and anxiety-like behavior at effect sizes similar to antidepressant treatment,(41, 42) and prebiotics may reduce stress-induced anxiety-like behavior and stimulate changes in microbial diversity.(43)
These findings suggest that changes within the intestinal microbiota may be of central importance to the development or maintenance of depression and anxiety, but few studies have examined associations of the enteric microbe-gut-brain axis in human samples—and significant results generally lack replication. Two studies comparing the intestinal microbiotas of
individuals with mild-to-severe depression to healthy controls generated mixed findings, with one failing to find significant between-group differences,(44) while the other found increased diversity in individuals with major depressive disorder and significant taxonomic
studies as potential means for altering mood, with improvement in measures of depression, anxiety, cognitive reactivity, and stress levels in healthy volunteers after placebo-controlled supplementation trials of prebiotic or probiotic formulas.(46-48) However, prebiotic or probiotic supplementation has not always been associated with observable compositional changes to the intestinal microbiota.
There are many possible physiologic mechanisms involved in the enteric microbe-gut-brain axis. Bravo et al. (2011) suggest that a naturally occurring enteric microorganism used as a probiotic impacts behavior via the vagus nerve (the main gut-brain communication pathway) and gamma-aminobutyric acid (GABA) expression in the brain.(41) However, the intestinal
microbiota also (i) stimulates release of cytokines and chemokines that can elicit immune response; (ii) synthesizes neurotransmitters and short-chain fatty acids that have neuroactive properties and can influence a range of other physiologic functions; and (iii) regulates permeability of the blood-brain barrier.(49)
The investigation of the specific enteric microbes that influence anxiety and depression in AN has never been attempted. Yet the centrality of anxiety and depression in AN, and the
demonstrated role of the intestinal microbiota on these traits, support research to identify
whether microbial shifts in patients with AN correlate with anxiety and depression measures and
whether they can confer anxiety and depression to GF mice.
1.5 The intestinal microbiota is a valid intervention target
microbial transplants beyond the treatment of C. difficile and metabolic syndrome, but this research is in its infancy and the mechanism by which these transplants (via enema or capsule) induce a beneficial outcome is unclear. Supporting this concept, a probiotic originally isolated from the intestinal microbiota of a healthy individual (Lactobacillus rhamnosus JB-1) reduced anxiety- and stress-related behavior in mice via modulation of the expression of GABA in the brain.(53) These biological and behavioral effects were not seen in vagotomized mice,
illustrating the critical role of microbe-gut-brain communication. Thus, an enteric microbe, originating from the intestinal microbiota, is known to regulate behaviors that are prominent in AN. Identifying microbes within the intestinal microbiota of patients with AN associated with specific AN traits (weight regulation, anxiety, and depression) that are transmissible to GF mice
would provide a rationale to develop new, microbiota-based treatments for this disorder.
This research would pioneer the combination of large scale 16S rRNA gene sequencing-based studies of intestinal microbiotas in AN with exploration of their functional influence on weight regulation and behavioral traits associated with AN. Correlating the configuration of an individual’s intestinal microbiota with health status is a fundamental first step in testing for a causative role of enteric microbes in AN. A unique challenge for this research is the inability to compare individuals with AN to similarly malnourished individuals who do not have AN or other medical conditions that result in malnutrition. This does not preclude other informative designs that could, for example, explore whether the presence of specific enteric microbes are associated with successful maintenance of therapeutically restored weight after renourishment.
(from feces) from patients with AN into GF mice and measuring anthropometric, metabolic, and behavioral changes that occur, along with the composition of the intestinal microbiota. This would test the ability of donor microbiotas to functionally impact AN-related phenotypes (i.e., weight regulation, anxiety, and depression) in the recipient animals. Identifying enteric microbes that have a potential detrimental or beneficial impact on weight regulation and behavior in patients with AN would generate target microbes that can then be studied further on a platform that enables the investigation of host–microbe interactions, namely gnotobiotics.
Novel interventions for AN are essential. Microbiota-modulating strategies could comprise a significant therapeutic advance in the treatment of AN. Our incomplete
understanding of the pathophysiology of AN has hindered the development of novel, safe, acceptable, and effective interventions. Concerted attention to this area could identify bacterial taxa whose promotion or elimination would improve the efficiency of therapeutic weight restoration, as well as the psychological and physical treatment experience of patients. We need new information about the biology of AN at a microbial level to inform innovative therapies targeting enteric microorganisms, which may fundamentally alter the way we understand and treat AN.
As a critical first step, the overarching goal of this dissertation is to gain a greater understanding the role of the intestinal microbiota in the physiologic changes associated with AN. We hypothesize that a unique intestinal microbial dysbiosis arises from prolonged
(i) Characterize the composition and diversity of the intestinal microbiota in acutely ill patients with AN before and after hospital-based renourishment and compared to healthy controls (Chapter 2);
Hypothesis: the intestinal microbiota in patients with AN will differ in measures of
composition and diversity from that of healthy controls and change over the course of
hospital-based renourishment.
(ii) Examine associations between microbial composition and diversity and measures of depression, anxiety, and eating disorder psychopathology in patients with AN (Chapter 2) and healthy females (Chapter 4);
Hypothesis: the composition and diversity of the intestinal microbiota is significantly
associated with measures of psychopathology in patients with AN and healthy females.
(iii) Investigate changes in fecal energy content during hospital-based renourishment and associations with the intestinal microbiota (Chapter 3);
Hypothesis: the intestinal microbiota in AN, which is altered during renourishment, adaptively responds to a low-energy environment (i.e., prolonged caloric restriction). and
(iv) Characterize daily changes in composition and diversity of the intestinal microbiota in three acutely ill patients with AN over the entire course of hospital-based
renourishment and identify enteric bacterial groups associated with metabolic changes during treatment (Chapter 5).
CHAPTER 2
THE INTESTINAL MICROBIOTA IN ACUTE ANOREXIA NERVOSA
AND DURING RENOURISHMENT: RELATIONSHIP TO DEPRESSION, ANXIETY,
AND EATING DISORDER PSYCHOPATHOLOGY2
2.1 Introduction
The robust and documented role of the intestinal microbiota in metabolic function and weight regulation provides a strong rationale for exploring the role of this complex microbial community in the emergence, maintenance, and recovery from anorexia nervosa (AN).(26) AN is a severe, life-threatening mental illness(54) associated with dangerously low body weight and biochemical, metabolic, immunologic, and sensory abnormalities,(55-60) as well as mortality rates among the highest for any psychiatric disorder.(3) Despite the significant morbidity and mortality associated with AN(1-4) and decades of research, the evidence base for its treatment is weak—especially during the initial renourishment phase.(5, 61) Current models are unable to account for how individuals with AN can achieve and defend such low body weights.
The composition of the human microbiota, which includes the diverse microbial communities living in and on the human body, as well as the genetic material of these microorganisms (microbiome) and their interactions with the surrounding environment, has become a burgeoning area of study. The composition of these microbial communities can vary with age, sex, environment, geography, diet, and disease, but we understand little about the nature of these variations or their impact on human development, physiology, immunity, and
nutrition.(62) Seminal work by the Human Microbiome Project has characterized the
microbiome in a cohort of healthy individuals,(63) whereas other investigators have focused on how deviations from the norm could contribute to diseases such as inflammatory bowel diseases (IBD),(64) asthma,(65-70) and obesity.(22, 25, 27, 71-74)
A growing body of evidence from both animal models and human studies shows communication between the intestinal microbiota and the brain (i.e., the so-called gut-brain axis).(75) This phenomenon has not been studied in individuals with AN, and the specific mechanism(s) through which enteric microbes affect brain function remains unclear. However, individuals with AN often present with comorbid anxiety and depression—up to 80% will experience major depression at some point in their lifetime,(32) whereas up to 75% will have some form of anxiety disorder, including social phobia, specific phobia, and generalized anxiety disorder.(29-31)
The intestinal microbiota plays a demonstrable role in weight gain/loss(22, 25, 27, 71-74) and energy extraction from the diet(27, 74, 76) in human and animal models. Given that AN is marked primarily by extreme weight dysregulation,(28) exploring the role of the intestinal
microbiota in AN is a logical and inevitable next step. Consistent evidence implicates this enteric microbial community in obesity and metabolic outcomes, although the degree of that
contribution is controversial.(20, 25, 27, 52, 73) Findings suggest that the composition of the intestinal microbiota differs between obese and lean individuals,(25, 73) and that obese
individuals may extract more energy from a given diet than their lean counterparts,(27) but very little is known about the gut microbiota in individuals with AN.
identified 11 completely new bacterial species in the Firmicutes (n=7), Bacteroidetes (n=2), and Actinobacteria (n=2) phyla, suggesting distinct characteristics of the gut microbiome in AN.(23) Further research is needed to investigate whether these new species are uniquely associated with AN. In addition, a molecular-based study(22) analyzing the intestinal microbiota of nine patients with AN found increased levels of the archaeon Methanobrevibacter smithii. Because M. smithii and other methanogens play an important role in removing excess hydrogen gas from the gut and improving efficiency of microbial fermentation (and associated energy yield), this could
demonstrate an adaptive response toward optimizing energy extraction from a very low-calorie diet. Although novel findings were reported, this study analyzed a limited number of microbial groups (two phyla: Bacteroidetes and Firmicutes; one genus: Lactobacillus; and one archaeon: M. smithii). Animal models also suggest that the intestinal microbiota influences satiety mechanisms through interaction with peptide signaling(77) and protective adaptation in a starvation state.(78) A more comprehensive characterization of the intestinal microbiota of individuals with acute AN is required, along with exploration of changes in enteric microbes over the course of medically supervised weight restoration.
2.2 Methods and Materials
The study was approved by the Biomedical Institutional Review Board at the University of North Carolina at Chapel Hill (UNC). All participants provided written consent before study participation.
Females (n=16) admitted for inpatient treatment at the UNC Center of Excellence for Eating Disorders (CEED) participated in the study. Participants were recruited from consecutive inpatient admissions from December 2012 to May 2013, and inclusion criteria were as follows: a) age 15 to 64 years; b) meet the Diagnostic and Statistical Manual of Mental Disorders, Fourth Edition, Text Revision criteria for AN; and c) present at less than 75% of ideal body weight. Exclusion criteria were based on factors known to influence the composition of the intestinal microbiota: history of gastrointestinal tract surgery (other than appendectomy or
cholecystectomy); history of IBD, irritable bowel syndrome, celiac disease, or any other diagnosis that could explain chronic or recurring bowel symptoms; treatment in the last two months with antibiotics, nonsteroidal anti-inflammatory drugs, or steroids; or intentional use of probiotics during the last two months.
Data from HCG (n=12) with no recurring gastrointestinal symptoms were obtained from a previous study.(79) This study recruited controls via advertisement from the general population in the same geographical region (central North Carolina) and from UNC outpatient clinics. HCG participants were subject to the same exclusion criteria as patients with AN and were selected for this analysis based on sex (female), age (15 to 64 years), and body mass index (BMI; 18.5–24.9 kg/m2). They were not screened for psychopathology during recruitment.
Height was measured at admission for all AN patients and again at discharge for those younger than 21 years. Eating disorders diagnosis and psychopathology were established via the Eating Disorder Examination(80) and the Structured Clinical Interview for DSM-IV-TR Axis I
Disorders(81) conducted by credentialed members of the CEED Assessment Core. AN patients also completed electronic versions of the Beck Anxiety Inventory (BAI),(82) Beck Depression Inventory-II (BDI),(83) and Eating Disorder Examination–Questionnaire (EDE-Q)(84) within 24 hours of admission.
The first stool sample produced after admission (T1) was collected for all AN patients (n=16), and for a subset of these patients (n=10), an additional sample was collected before discharge (T2). Input and output are measured as part of routine treatment, minimizing risk of missing samples, and all samples were collected by nurses trained in collection protocols. Fresh stool samples were collected from HCG in the same manner as AN patients, as previously reported.(79) All samples were transferred to the laboratory, where they were mechanically homogenized with a sterile spatula, aliquoted into sterile 2 ml cryovials, and stored in a -80 °C freezer for future DNA isolation and nucleotide sequence analysis.
Bacterial DNA was isolated from collected samples using a phenol/chloroform extraction method combined with physical disruption of bacterial cells and a DNA clean-up kit (Qiagen DNeasy Blood and Tissue extraction kit [Qiagen, Valencia, CA]), as previously described.(79, 85)
Bacterial community composition in isolated DNA samples was characterized by
and purified for the sequencing reaction. Sequencing was performed on a 454 Life Sciences Genome Sequencer FLX machine (Roche, Florence, SC) by the Microbiome Core Facility in the UNC School of Medicine.
16S rRNA sequence data generated by the 454 sequencer were processed by the Quantitative Insights Into Microbial Ecology (QIIME) pipeline.(86) Sequences that were less than 200 base pairs or greater than 1000 base pairs in length, contained incorrect primer sequences, or contained more than one ambiguous base were discarded.(87) Sequences were clustered into Operational Taxonomic Units (similar to species level) based on their sequence similarity at a 97% threshold using BLAST and assigned taxonomy using the Greengenes database.(88) Principal coordinates were generated using unweighted and weighted UniFrac distances.(89-91) The richness of the intestinal microbiota was characterized by the number of observed bacterial species in each sample and the Chao-1 estimator of diversity.(92, 93)
discovery rate (FDR) procedure addressed multiple testing(94) and was applied to the number of comparisons per outcome and per taxonomic rank. A global, multivariate hypothesis test
developed for dimensional small-sample data (i.e., the type of data acquired through high-throughput technology in metabolomics, genomics, and proteomics) was also used to test for differences in alpha diversity, beta diversity, and taxa abundance across all bacterial groups.(95) A global test offers additional conceptual advantages to a univariate test because microbiota can work together or in a pathway and may have greater explanatory power when considered
collectively.
Differences in alpha diversity, beta diversity, and taxa abundance of bacterial groups (at the phylum, class, order, family, and genus levels) were compared in AN patients at T1 (n=16) versus HCG (n=12) and AN patients at T2 (n=10) versus HCG with two-tailed Wilcoxon-Mann-Whitney tests. The Chi et al.(95) global multivariate test was used for beta diversity and per taxonomic level, and FDR correction was applied as described earlier.
Associations between T1 psychopathology scores measured as continuous variables (BDI [depression], BAI [anxiety], and EDE-Q [total + subscales for Dietary Restraint, Eating Concern, Shape Concern, and Weight Concern]) and alpha diversity, beta diversity, and taxa abundance of bacterial groups (at the phylum, class, order, family, and genus levels) were examined in AN patients (n=15; one patient did not complete the surveys) with the tau-b correlation coefficient. Bacterial groups present in at least 25% of T1 samples were considered. Univariate analyses used the Wilcoxon-Mann-Whitney test, and the FDR procedure was used to adjust for multiple testing, implemented per outcome and per taxonomic rank. The global multivariate test was implemented for beta diversity and per taxonomic level.
was used given the exploratory nature and small sample size. All analyses were conducted in SAS 9.3 (Cary, NC).
2.3 Results
Fecal samples were collected at T1 from female patients with AN (n=16). Average age was 28.0 (11.7; mean [standard deviation]) years, and mean BMI at T1 was 16.2 (1.5) kg/m2. A subset of patients (n=10) provided an additional sample at T2, when they had reached a mean BMI of 17.4 (0.9) kg/m2. Female HCG (n=12) who provided samples had a mean age of 29.8 (11.6) years and mean BMI of 21.5 (1.9) kg/m2. Participants were predominately white (n=14 patients with AN; n=7 HCG), with a small representation of African American participants (n=2 patients with AN; n=1 HCG). Four HCG participants did not provide information on race.
At T1, patients with AN (n=15) had mean BDI and BAI scores of 26.6 (13.4) and 17.7 (11.9), respectively, reflecting moderate depression and anxiety.(96, 97) Most patients endorsed at least mild levels of depression (80.0%) and anxiety (66.7%). Mean EDE-Q total scores of 3.6 (1.8) and scores on subscales for Dietary Restraint (3.7 [1.9]), Eating Concern (3.4 [1.9]), Shape Concern (3.8 [1.9]), and Weight Concern (3.4 [2.1]) are consistent with other clinical samples of patients with AN.(98, 99)
Table 1 presents changes in bacterial composition and diversity over the course of inpatient weight restoration. Global tests indicated significant differences between T1 and T2 in beta (between-sample) diversity (p<0.001) and at the phylum (p=0.042) and genus (p=0.041) taxonomic levels (Figure 1). Based on unweighted UniFrac distances, three principal
coordinates (5, 6, 10) were significantly different at hospital admission and discharge and remained significant at an FDR level of 0.1. The average unweighted UniFrac distances were significantly different between groups (p<0.0001), with T2 samples showing greater similarity to each other than T1 samples (Figure 2). The strongest taxonomic changes were seen in the family Ruminococcaceae, with significant changes in specified (Ruminococcus; p=0.002) and
unspecified (p=0.004) subgenera.
We compared the intestinal microbiota in patients with AN at T1 and T2 to that of age- and sex-matched HCG. At both time points, the alpha (within-sample) diversity remained significantly lower in patients with AN versus HCG, measured as either the number of observed species or Chao-1 estimator (Figure 3; Tables 2 and 3). However, the bacterial composition of samples from patients with AN at T1 showed greater differences with HCG than samples collected at T2. At T1, patients with AN had greater levels of class Bacilli (p=0.007) and the unspecified genus in family Coriobacteriales (p<0.001) and reduced levels of class Clostridia (p=0.007), order Clostridiales (p=0.006), and genera Anaerostipes (p=0.003) and
Alpha (within-sample) diversity, measured as bacterial richness or the Chao-1 estimator, was significantly associated with scores on the BDI and EDE-Q. Greater levels of depression were negatively associated with the number of observed bacterial species (p=0.026) and Chao-1 estimator (p=0.026; Figure 4 and Table 4). Lower number of observed species was also
associated with greater levels of eating disorder psychopathology, measured as EDE-Q total score (p=0.026) or scores on subscales for Shape Concern (p=0.008) and Weight Concern (p=0.025; Table 5). All associations remained significant at an FDR level of 0.1.
Significant associations were also seen between specific bacterial taxa and BDI, BAI, and EDE-Q scores, but none remained significant at an FDR level of 0.1. The strongest (negative) associations were seen with the family Ruminococcaceae (Tables 4 and 5).
2.4 Discussion
In examining the composition and diversity of the intestinal microbiota in patients undergoing inpatient treatment of AN, we report i) changes over the course of hospital-based weight restoration; ii) significant differences between patients with AN and HCG; and iii) associations between microbial measures and depression, anxiety, and eating disorder
psychopathology. These results extend findings from earlier, smaller studies of patients with AN and provide strong support for future work, including mechanistic studies of gut-brain
interaction, to better understand the biological mechanisms at work in the risk and maintenance of AN.
Significant changes in the composition of the intestinal microbiota were seen in patients with AN during renourishment, particularly among genera falling under the family
In comparing the intestinal microbiota of patients with AN to that of HCG, we found that alpha diversity was significantly lower in patients with AN both before and after inpatient weight restoration. Alpha diversity was also significantly associated with depression and eating disorder psychopathology in our patient group, with a lower number of observed bacterial species
associated with greater depression and greater weight concern, shape concern, and overall eating disorder psychopathology. These results show intriguing associations and underscore findings across various other disease states, including IBD(64) and arthritis,(102) which have shown that a healthier gut is a more diverse one. Moreover, as we found greater differences in bacterial composition between AN and HCG before versus after hospital-based renourishment, our results may suggest that the intestinal microbiota is trending toward a healthier state during treatment.
Although there has been limited research to date into the role of the intestinal microbiota in AN, some parallels can be drawn to microbial changes associated with malnutrition. Studies have demonstrated that acute malnutrition in children is marked by an intestinal dysbiosis and that the malnutrition phenotype (marked by severe weight loss) can be transmitted via the
intestinal microbiota in a gnotobiotic mouse model.(103, 104) This microbial dysbiosis may also interact with a nutrient-deficient diet to affect energy metabolism and cause malnourishment to persist.(103, 105)
Mounting evidence from animal studies in which the intestinal microbiota have been manipulated through probiotics, antibiotics, or microbial transfer to gnotobiotic mice has shown that behavior is associated with changes in bacterial composition and diversity.(40-42, 106-111) This includes models of depression and anxiety, which are common among patients with
those showing that lower bacterial diversity is associated with greater depression and anxiety, are at the forefront of providing evidence for the gut-brain axis in a human population.
Several limitations should be taken into account when considering these results. First, we did not control for diet of either patients with AN or HCG. The composition of the intestinal microbiota is strongly influenced by long-term dietary patterns,(17, 18) and short-term dietary changes can also induce dramatic microbial shifts.(19) Because patients resided on an inpatient hospital unit, dietary intake was controlled, and all participants consumed a standard diet, with far less variation across individuals than what would be expected from those in a free-living environment. In addition, our sample size limited power to detect differences between patients and controls over the course of renourishment. However, we did see some significant
compositional changes during inpatient treatment, as well as significant global changes in composition and diversity using a statistical method that provides greater explanatory power by considering the intestinal microbiota collectively. Third, all of our study participants were female, limiting generalizability of the results to males, who comprise approximately 10% of individuals with AN.(113) Given that we would be unlikely to recruit a sufficient number of male participants to allow testing for sex differences, we focused recruitment on females to maximize sample size. Lastly, we are unable to distinguish between changes to the intestinal microbiota that reflect weight gain versus recovery from AN, which will be important in future work, as BMI alone is associated with abundance of specific bacteria.(114)
mechanistic studies examining the impact of specific taxa on behavior and adiposity, including transplantation of the intestinal microbiota of patients with AN into gnotobiotic mice, will allow us to distinguish between microbial markers of renourishment and recovery from
Table 1. Hospital admission (T1) vs. hospital discharge (T2): differences in microbial taxa and diversity measures in females with AN (n=10)
Taxonomic/diversity
level Classification statistic Test p FDR corrected p
Global Tests
Phylum 2.66 0.042
Class 2.14 0.067
Order 1.77 0.064
Family 1.70 0.064
Genus 1.74 0.041
Beta diversity Weighted 1.50 0.22
Unweighted 6.07 0.0003
Univariate Tests
Family Eubacteriaceae -3.5 0.039 0.63
Genus Ruminococcaceae_genus -26.5 0.004 0.10
Oscillospira -22.5 0.020 0.34
Ruminococcus 27.5 0.002 0.10
Beta diversity Unweighted (PC 5) -23.5 0.014 0.070 Unweighted (PC 6) -21.5 0.027 0.090 Unweighted (PC 10) 26.5 0.004 0.040 a FDR = false discovery rate; PC = principal coordinate
b Alpha = 0.05; FDR level = 0.1
Table 2. Hospital admission (T1): differences in microbial taxa and diversity measures in females with AN (n=16) vs. healthy comparison group (n=12)
Taxonomic/diversity
level Classification statistic Test p FDR corrected p
Class Bacilli -2.72 0.007 0.026
Clostridia 2.72 0.007 0.026
Order Clostridiales 2.76 0.006 0.068
Lactobacillales -2.25 0.024 0.15
Family Actinomycetaceae -2.03 0.042 0.23
Lachnospiraceae 2.02 0.043 0.23
Porphyromonadaceae -2.60 0.009 0.14
Ruminococcaceae 2.53 0.011 0.14
Streptococcaceae -1.97 0.049 0.23
Genus Anaerostipes 2.99 0.003 0.042
Blautia 2.06 0.031 0.17
Coribacteriales_genus -4.62 <0.0001 0.005
Faecalibacterium 3.18 0.002 0.034
Lachnospira 2.16 0.030 0.17
Parabacteroides -2.60 0.009 0.10
Ruminococcaceae_genus 2.30 0.022 0.16
Ruminococcus 2.39 0.017 0.15
Alpha diversity # of observed species 4.02 <0.0001
Chao-1 estimator 3.83 0.0001
a FDR = false discovery rate b Alpha = 0.05; FDR level = 0.1
Table 3. Hospital discharge (T2): differences in microbial taxa and diversity measures in females with AN (n=10) vs. healthy comparison group (n=12)
Taxonomic/diversity
level Classification statistic Test p FDR corrected p
Phylum Bacteroidetes 2.08 0.038 0.11
Firmicutes -2.08 0.038 0.11
Class Bacteroidia 2.08 0.038 0.35
Order Bacteroidales 2.08 0.038 0.42
Family Porphyromonadaceae 2.74 0.006 0.15
Genus Coribacteriales_genus 4.29 <0.0001 0.004
Parabacteroides 2.74 0.006 0.065
Ruminococcaceae_genus -3.07 0.002 0.047 Alpha diversity # of observed species -2.80 0.005
Chao-1 estimator -2.41 0.016
a FDR = false discovery rate b Alpha = 0.05; FDR level = 0.1
Table 4. Hospital admission (T1): microbial taxa and diversity measures associated with depression and/or anxiety in females with AN (n=15)
Taxonomic/diversity
level Classification Behavioral measure statistic Test p FDR corrected p
Class Clostridia BDI -0.394 0.042 0.50
Order Actinomycetales BDI 0.406 0.040 0.40
Clostridiales BDI -0.394 0.042 0.40 Coriobacteriales BAI 0.410 0.036 0.40
Family Actinomycetaceae BDI 0.406 0.040 0.46
Rikenellaceae BDI -0.488 0.016 0.34 Ruminococcaceae BDI -0.587 0.002 0.16 BAI -0.566 0.004 0.16
Genus Blautia BDI -0.433 0.026 0.47
Faecalibacterium BDI -0.386 0.047 0.47 Lachnospira BDI -0.526 0.008 0.47 BAI -0.421 0.037 0.47 Rikenellaceae_genus BDI -0.488 0.016 0.47
Roseburia BDI -0.406 0.040 0.47
BAI -0.503 0.012 0.47 Ruminococcus BDI -0.490 0.011 0.47 BAI -0.527 0.007 0.47
Veillonella BDI 0.460 0.034 0.47
Alpha diversity # of observed species BDI -0.433 0.026 0.045 Chao-1 estimator BDI -0.433 0.026 0.090 Beta diversity Weighted (PC 2) BDI -0.510 0.009 0.45
BAI -0.488 0.013 0.45 a FDR = false discovery rate; PC = principal coordinate; BDI = Beck Depression Inventory-II; BAI = Beck Anxiety Inventory
b Alpha = 0.05; FDR level = 0.1
Table 5. Hospital admission (T1): microbial taxa and diversity measures associated with eating disorder psychopathology in females with AN (n=15)
Taxonomic/diversity
level Classification Behavioral measure statistic Test p corrected FDR p
Order Actinomycetales ShapeC 0.450 0.024 0.40
WeightC 0.434 0.030 0.40 Clostridiales EatingC -0.452 0.020 0.40 EDEQ -0.448 0.020 0.40 Turicibacterales EatingC -0.484 0.018 0.40
Family Actinomycetaceae ShapeC 0.450 0.024 0.34
WeightC 0.434 0.030 0.38 Clostridiaceae Restraint -0.437 0.025 0.34 Clostridiales_family WeightC -0.453 0.022 0.34 Odoribacteraceae Restraint 0.450 0.024 0.34 Ruminococcaceae Restraint -0.554 0.005 0.16 EatingC -0.529 0.006 0.16 ShapeC -0.534 0.006 0.16 WeightC -0.579 0.003 0.16 EDEQ -0.600 0.002 0.16 Turicibacteraceae EatingC -0.484 0.018 0.34
Genus Anaerostipes EatingC -0.463 0.028 0.47
Alpha diversity # of observed species ShapeC -0.515 0.008 0.045 WeightC -0.441 0.025 0.045 EDEQ -0.429 0.026 0.045 Chao-1 estimator ShapeC -0.476 0.015 0.090 Beta diversity Weighted (PC 4) EatingC -0.394 0.042 0.83
Unweighted (PC 1) EatingC -0.413 0.033 0.58 ShapeC -0.437 0.025 0.58 WeightC -0.422 0.032 0.58 EDEQ -0.448 0.020 0.58 a FDR = false discovery rate; PC = principal coordinate
b EDEQ refers to the total score on the Eating Disorder Examination-Questionnaire. The following subscales are also included: Dietary Restraint (Restraint), Eating Concern (EatingC), Shape Concern (ShapeC), Weight Concern (WeightC)
c Alpha = 0.05; FDR level = 0.1
Figure 1. Heatmaps of samples from patients with AN at hospital admission (T1; n=16) and discharge (T2; n=10) at the (A) phylum and (B) genus taxonomic levels. Bacterial
Figure 2. Principal coordinate plot of samples from patients with AN and average
Figure 3. Alpha diversity in samples from patients with AN at hospital admission (T1; n=16) and discharge (T2; n=10) and a healthy comparison group (n=12). Bacterial
Figure 4. Correlation between depression and alpha diversity in samples from patients with AN at hospital admission (T1). Bacterial composition was characterized by 454
CHAPTER 3
ENTERIC MICROBIOME-MEDIATED DIETARY ENERGY EXTRACTION IN ACUTE ANOREXIA NERVOSA: A PILOT STUDY3
3.1 Introduction
Treatment of anorexia nervosa (AN) challenges clinicians, scientists, and patients.(115) Variability in response to therapeutic renourishment remains largely unexplained. Speed of weight gain, metabolic fluctuations, physical and psychological distress, and re-loss of restored weight are likely influenced by unknown biological mechanisms.
The intestinal microbiota plays a significant role in metabolic function and weight regulation, and we reported an intestinal microbial dysbiosis in AN.(116) Moreover, obese mice may extract calories from food more efficiently than lean mice, and this “efficiency” can be passed to germ-free mice through fecal microbiota transplantation—causing increased adiposity in obese microbiota recipients, even on isocaloric diets.(27) The intestinal microbiota may
mediate increased adiposity via dietary energy harvest. We therefore investigated the relationship between the intestinal microbiota and fecal energy content before and after clinical
renourishment in AN.
Fecal energy content provides an indirect measure of energy absorption and proxy for efficiency of microbiota-mediated dietary energy extraction. Overfeeding lean volunteers leads to compositional changes to the intestinal microbiota and less energy lost in feces on a
calorie diet.(117)
Our objectives were to (i) investigate changes in fecal energy content during
renourishment; and (ii) examine associations between fecal energy content and composition and diversity of the intestinal microbiota. We hypothesized that the intestinal microbiota in AN, which is altered during renourishment, has adaptively responded to a low-energy environment (i.e., prolonged calorie restriction).
3.2 Methods
The study was approved by the Biomedical Institutional Review Board at the University of North Carolina at Chapel Hill. All participants provided written consent. Female inpatients with AN (n=15), representing a subset of participants in a previous study,(116) consented to additional sample analysis. The first fecal sample after admission (T1) was collected for all patients, and when possible, an additional sample was collected before discharge (T2). Samples were mechanically homogenized, aliquoted into 2 mL cryovials, and stored in a −80°C freezer.
To prepare samples (n=24: n=14 for T1, n=10 for T2) for bomb calorimetry, fecal matter from one cryovial was baked in pellet form for 48h at 60°C. Energy content was determined via Isoperibol Calorimeter Model 6200EA (Parr Instrument Co., Moline, IL), calibrated with 10 runs of benzoic acid. Each sample was weighed and placed in an oxygen bomb, which was placed in 2000 mL distilled water inside the calorimeter. Energy content was calculated using heat produced by pellet combustion and corresponding water temperature rise.
the Quantitative Insights Into Microbial Ecology pipeline,(86) clustered into Operational Taxonomic Units at 97% threshold (using BLAST), and assigned taxonomy using the
Greengenes database.(88) Microbial richness was characterized by Shannon diversity index.(118, 119)
Differences in energy intake (kcal/day) and fecal energy content (cal/g) associated with paired T1 and T2 samples (n=7) were compared with paired Student’s t-tests (alpha 0.05). Due to significant differences in energy intake between T1 and T2, and the association between energy intake and energy content of fecal samples, we normalized fecal energy content by participant energy intake from the day before sample collection to generate a relative measure of fecal energy content. We evaluated differences in fecal energy content using absolute and relative measures.
Mixed linear models examined the relationship between energy content of all available fecal samples (n=24: n=14 for T1, n=10 for T2), Shannon diversity index, and bacterial taxa abundance at the phylum, class, order, family, and genus levels [(Diversity/Taxa) ~ Time + Calorimetry + 1/Participant]. Time (T1 vs. T2) and energy content (cal/g) were included as fixed variables and participant ID as a random variable, capturing variance in outcome explained by each parameter. False discovery rate (FDR) adjusted for multiple comparisons(94) at the recommended level of 0.1(120) using R.(121)
3.3 Results
Dietary records were available for n=7 participants and matched to paired fecal samples. Mean (SD) energy intake in these patients increased from 1557 (360) kcal/day at T1 to 2600 (566) kcal/day at T2 over mean length of stay 30.4 (12.6) days, a significant increase (p<0.001, paired Student’s t-test) reflecting renourishment.
Mean (SD) absolute energy content of fecal samples did not differ between T1 [4586 (620) cal/g] and T2 [4591 (500) cal/g] (p=0.98, paired Student’s t-test). When normalized by participant energy intake, relative energy content of fecal samples decreased significantly from T1 [3.1 (1.0) cal/g] to T2 [1.9 (0.7) cal/g] (p=0.002, paired Student’s t-test) (Figure 5).
Mixed linear models of the relation between absolute energy content of fecal samples (n=24) and taxa abundance and diversity of bacterial groups suggest significant but modest associations between phylum-level abundance and energy content for most phyla (Table 6, Figure 6), even after FDR correction. Shannon diversity index was significantly associated with fecal energy content (p=0.042; adjusted p=0.063), with higher energy content associated with greater microbial diversity. Associations at other taxonomic levels were not significant. 3.4 Discussion
We previously described an intestinal microbiota dysbiosis in acute AN marked by lower microbial diversity.(116) Exploring the role of this complex community in dietary energy
extraction in these patients, we found evidence of relative but not absolute changes in fecal energy content when comparing T1 and T2, which were also modestly associated with microbial composition and diversity. This supports our hypothesis of microbial adaptation to a low-energy environment and suggests that changes in energy availability may impact mechanisms of dietary energy extraction that are mediated by the intestinal microbiota.
quality, quantity, and composition.(19, 74, 117) Substantial increases in energy availability associated with renourishment in AN would be expected to influence composition and/or diversity of resident microorganisms. However, we found that absolute energy content did not differ between fecal samples at T1 and T2 despite increased energy intake. This finding could mean that microbial changes during renourishment support the physiologic need for weight restoration in AN by fully capturing additional energy availability for metabolic demands. Alternatively, the absence of a difference could reflect increased bioavailability of energy at T1 vs. T2, with the intestinal microbiota at T1 being primed for maximum metabolic efficiency (i.e., extracting as much energy as possible from a low-calorie diet), yet the body is simply unable to take up all available energy—especially since caloric intake in the days after admission may be substantially higher than immediately prior to admission. This inability to fully absorb available energy could be linked to fasting-induced changes in the intestinal epithelium that decrease absorptive capacity.(122)
When considered relative to energy intake, fecal energy content was significantly greater at T1 vs. T2, suggesting that relative energy content of fecal samples decreased as caloric intake increased. This pattern suggests that clinically renourished patients both consume and extract more calories from the diet at T2. This parallels a randomized cross-over trial where overfeeding lean males induced rapid compositional changes in the intestinal microbiota that were associated with relatively lower fecal energy content.(117) In addition, a cross-sectional study of AN reported greater abundance of archaeon Methanobrevibacter smithii compared with lean
mechanisms of the intestinal microbiota, remains unknown.
Mixed evidence surrounds associations between fecal energy content and microbial biomarkers. In our female patients with AN, greater fecal energy content was associated with greater microbial diversity, increased abundance of phyla Bacteroidetes and Proteobacteria, and decreased abundance of phyla Firmicutes and Actinobacteria. However, degree of overfeeding in healthy males was associated with increased relative abundance of Firmicutes and decreased relative abundance of Bacteroidetes.(117) Moreover, significant increases in fecal energy content on a high-fat diet were not associated with abundance of Firmicutes, Bacteroidetes, or
Actinobacteria.(123)Longitudinal studies are required to examine how changes in microbial composition are related to energy balance and biomarkers of metabolism.
Limitations exist in our study. Fecal energy content is an indirect and imperfect measure of nutrient extraction via the intestinal microbiota, and efficiency of energy absorption in patients with AN may differ from healthy individuals due to other variables—e.g., gastrointestinal
distress, gastric transit time, etc. This exploratory study was likely underpowered to examine associations between fecal energy content and composition of the intestinal microbiota at other taxonomic levels.
Clinical renourishment in AN induces dynamic shifts in energy intake and, thus,
Table 6. Hospital admission (T1) vs. hospital discharge (T2): associations between microbial taxa and diversity measures in females with AN
Taxonomic level p FDR corrected p
Firmicutes 0.020 0.063
Proteobacteria 0.038 0.063
Bacteroidetes 0.047 0.063
Actinobacteria 0.053 0.063
Verrucomicrobia 0.768 0.768
Diversity measure p FDR corrected p
CHAPTER 4
THE GUT-BRAIN AXIS IN HEALTHY FEMALES:
LACK OF ASSOCIATION BETWEEN MICROBIAL COMPOSITION AND DIVERSITY AND PSYCHIATRIC MEASURES4
4.1 Introduction
Investigations conducted over the last decade have generated consensus among
researchers that the intestinal microbiota plays a vital role in a range of physiologic processes, especially those related to immunologic and metabolic function. A healthy intestinal microbiota is also important for normal brain development and behavioral functions.(108) The enteric microbe-gut-brain axis has garnered increasing attention as a key, bidirectional communication pathway that influences mood, cognition, and behavior.(124-126) In addition to a direct
connection via the vagus nerve, gut bacteria may interact with the brain through production of neurotransmitters, hormones, and other metabolites.
Whether a dysbiosis in the intestinal microbiota plays a direct role in the pathophysiology of psychiatric disorders remains to be determined; however, both preclinical animal studies and clinical human studies are actively investigating this question. Numerous studies in animal models have documented behavioral changes following manipulation of the intestinal
microbiota, including effects on behavior associated with stress,(111) anxiety,(107, 108, 110, 127) and depression.(41, 42) Validating animal models of the enteric microbe-gut-brain axis in human populations has reported modest associations and has been limited by small sample sizes
and lack of consistency in assessment of psychiatric and microbial outcome measures. Although underpowered, these studies in human cohorts suggest a potential role for the intestinal
microbiota in anxiety, depression, stress, cognitive reactivity, and eating disorders.(45-48, 116) Given the heightened interest in the enteric microbe-gut-brain axis and accumulating evidence supporting a role for the intestinal microbiota in mood and behavior, we investigated whether such associations would extend to healthy populations. We, therefore, examined associations between the composition and diversity of the intestinal microbiota and measures of depression, anxiety, eating disorder psychopathology, stress, and personality in a group of healthy adult females.
4.2 Methods
The study was approved by the Biomedical Institutional Review Board at the University of North Carolina at Chapel Hill (UNC). All participants provided written consent before study participation.
Study Population
Healthy adult females (n=100) ages 15-50 years with BMI 18.5–24.9 kg/m2 were recruited from central North Carolina via listserv announcements, targeted emails, and social media to serve as controls for ongoing research. Participants were recruited between July 2014 and March 2015. Due to possible impact on the intestinal microbiota, potential participants were excluded for the following reasons: (i) history of gastrointestinal tract surgery (other than
intentional use of probiotics during the last two months (via food or supplement); and/or (vi) abuse of laxatives within the last month.
Body Composition and Assessments
Participants self-reported current height and weight during the screening process. Participants completed an online psychiatric questionnaire that included five widely-used and validated measures: (i) Beck Anxiety Inventory (BAI);(96, 128) (ii) Beck Depression Inventory-II (BDI);(97, 129) (iii) Eating Disorder Examination-Questionnaire (EDE-Q);(130, 131) (iv) Perceived Stress Scale (PSS);(132, 133) and (v) Mini International Personality Item Pool (Mini IPIP).(134)
Sample Collection, Processing, and Storage
During the consent process, participants were provided with an at-home stool collection kit and trained in sample collection procedures. Each kit included: Styrofoam container,
disposable collection hat, stool collection tube, biohazard bag, pair of non-latex gloves, two ice packs, and stool collection record sheet. Participants were instructed to return the sample (in the biohazard bag, with ice packs, in the Styrofoam box) to the research office within 24 hours of collection and to keep the sample refrigerated during any interim period. Samples were then immediately transferred to the laboratory, where they were mechanically homogenized with a sterile spatula, aliquoted into sterile 2 ml cryotubes, and stored in a −80 °C freezer for future DNA isolation and molecular microbiological analysis.
DNA Isolation
Sequencing of 16S rRNA Genes
Bacterial community composition in isolated DNA samples was characterized by amplification of the V4 variable region of the 16S rRNA gene by polymerase chain reaction (PCR) (forward primer 515, 5'-GA GTG CCA GCM GCC GCG GTA A-3'; reverse primer 806, 5'-ACG GAC TAC HVG GGT WTC TAA T-3'). Generation of 16S rRNA sequences consisted of two separate amplifications: (1) 95°C for three minutes, then 10 cycles of 95°C for 30 seconds, 50°C for 30 seconds, and 72°C for 30 seconds, followed by one cycle of 72°C for five minutes using 120 ng of fecal DNA as template, 10 µM of each 16S V4 primer, and the
KAPA2G Robust PCR kit (Kapa Biosystems, Wilmington, MA); and (2) 95°C for three minutes, then 22 cycles of 95°C for 30 seconds, 50°C for 30 seconds, and 72°C for 30 seconds, followed by one cycle of 72°C for five minutes using 5 µL of purified PCR product from the first
amplification as template, 10 µM of forward and reverse primers that contain Illumina MiSeq adaptor sequences with a 12-base error-correcting Golay barcode incorporated in the reverse primer, and the KAPA HiFi HotStart ReadyMix PCR kit.(135) Purification of PCR products was carried out after each amplification using the HighPrep PCR clean-up kit (MagBio, Lausanne, Switzerland) with a DynaMag-96 side magnet (Life Technologies, Carlsbad, CA). 16S rRNA PCR products were then quantified and pooled for sequencing. Sequencing was performed on an Illumina MiSeq desktop sequencer (Illumina, San Diego, CA) by the High-Throughput
Sequencing Facility in the Carolina Center for Genome Sciences at the UNC School of Medicine.
Analysis of 16S rRNA Sequences
sequence reads (250 bp) were clustered into Operational Taxonomic Units based on their sequence similarity at a 97% threshold using BLAST and assigned taxonomy using the
Greengenes database.(88) Principal coordinates were generated using unweighted and weighted UniFrac distances.(89-91)
Results were validated using an alternate pipeline, in which forward reads from the 16S rRNA sequencing data were classified with version 2.10.1 of the RDP classifier with a threshold of a 50% RDP score.(136)
Statistical significance was determined using Kendall’s tau-b correlation coefficient in R.(121) R scripts are available at
https://github.com/afodor/metagenomicsTools/blob/master/src/scripts/IanNovember2015/correlat ionsOneColumnAtATime.txt
The diversity of the intestinal microbiota was characterized by the Shannon diversity index.(118, 119)
Statistical Analysis
participant metadata. The FDR procedure was applied to the number of comparisons per outcome and per taxonomic rank. The α level used was 0.05, but for FDR correction, a more lenient criterion of 0.1 was used.(120) All analyses were conducted in R.(121)
4.3 Results
Of 100 participants who consented to participate in the study, 94 completed the psychiatric questionnaires and submitted a fecal sample, of which sequencing results from 91 samples met quality control standards for analysis. Demographic and clinical characteristics of the final participant sample (n=91) are shown in Table 7. In brief, the participants had a mean (SD) age of 29.0 (7.9) years and were within the normal or healthy weight range for adults.(137) On average, their scores indicate normal or minimal levels of anxiety (BAI), depression (BDI), and stress (PSS) and are in line with, or lower than, those of similar non-clinical samples.(128, 138-140) Total scores on the EDE-Q and its four subscales (dietary restraint and eating, weight, and shape concerns) are lower than norms for U.S. college students and young adult females in Sweden,(99, 141) which is likely a reflection of the participant recruitment and screening process, which eliminated individuals with a lifetime eating disorder history.
Following sequencing of 16S rRNA genes, we had 91 samples with complete data, after excluding those samples with insufficient depth of sequence reads for our downstream analysis. The total number of 16S rRNA sequence reads was 15,408,275, and the mean number of reads was 169,322 per sample (range: 47,709-317,349 sequence reads).
phyla, 19 classes, 24 orders, 52 families, and 153 genera) that were present in at least 10% of our samples. At each taxonomic level, we also calculated the Shannon diversity index. We evaluated 4,522 hypotheses [17 measures * (261 taxa + 5 Shannon diversity metrics)] using the non-parametric Kendall’s tau-b test for association. Histograms of generated p-values across all possible associations (Figure 7) are largely uniform, suggesting that the null hypothesis of no association is generally supported across all taxonomic levels. Using FDR correction for all 4,522 hypotheses, there were no significant hits even if the threshold were set to 93% FDR.
We also used a less conservative correction, in which associations between each of the 17 human measurements and each taxonomic level were corrected independently (for example, the comparisons of BDI and the 14 phyla were corrected only for the 14 phyla independent of all the other tests that we ran). Even using this much less stringent threshold, where we might expect some spurious correlations, there were no significant hits at a 5% FDR. We conclude that there is a striking lack of correlation between microbial community composition and the measurements we have gathered from our human cohort.
To further visualize the associations in our data set, we generated principal coordinate plots using unweighted UniFrac distances and colored these plots by quartiles of the main
4.4 Discussion
Our results provide evidence for a lack of association in physically and psychologically healthy adult females between microbial markers of gut composition and diversity and a collection of psychiatric measures, including anxiety, depression, eating-related thoughts and behaviors, stress, and personality. No associations between these measures met established significance thresholds in our analysis.
Animal models suggest a role for the intestinal microbiota in anxiety, depression, and stress, and many animal studies have documented behavioral changes following manipulation of the intestinal microbiota using prebiotics, probiotics, antibiotics, infection with pathogenic bacteria, or microbial transfer to germ-free (GF) mice (i.e., mice raised in a sterile environment and lacking an intestinal microbiota). Seminal work by Sudo et al. (2004) on hypothalamic-pituitary-adrenal axis activity showed that GF mice have exaggerated stress response when compared to conventionally-raised mice.(111) GF mice also have reduced anxiety-like behavior compared to conventional mice,(107, 108, 110, 127) which can be reversed via early-life
colonization with intestinal bacteria.(107, 108) Anxiety-like behavior can also be increased in mice with pathogenic infection(142-144) or transferred between mice with a characteristic anxiety phenotype and non-anxious GF mice using microbial transfer.(40) Probiotic
formulations, such as Lactobacillus rhamnosus and Bifidobacterium infantis, have been shown in animal models to reduce depressive and anxiety-like behavior at effect sizes similar to