AN ECONOMIC SIGNALING COMPARISON OF HIGH SCHOOL DIPLOMA TO GENERAL EDUCATION DEVELOPMENT CERTIFICATE HOLDERS IN THE UNITED
STATES ARMY
Brooke Davis Maxfield
A dissertation submitted to the faculty at the University of North Carolina at Chapel Hill in partial fulfillment of the requirements for the degree of Doctor of Philosophy in Educational
Psychology, Measurement, and Evaluation in the School of Education.
Chapel Hill 2016
ii © 2016
iii ABSTRACT
Brooke Davis Maxfield: An Economic Signaling Comparison of High School Diploma to General Education Development Certificate Holders in the United States Army
(Under the direction of Eric Houck)
Potential employees alert employers of their ability levels and occupational skills through education and education credentials during the hiring process. As such, education serves as a sorting mechanism for potential employees by their work-related characteristics such as perseverance, determination, ability, productivity, and so forth (Page, 2010; Riley, 1979). Military attrition studies of the 1980s found that education credentials were positively correlated to military retention and reinforced the premise of economic credentialing theory (National Library of Education, 1998). Therefore, the military developed a three-tier system that was based on the education credentials of new recruits. This system is still used by the Army to assess the qualifications of those who serve in the military. Employers also rely on employee characteristics viewed as useful in the work environment, referred to as education signaling. Education
signaling allows for consideration of job performance covariates that go beyond schooling or credentials (e.g., aptitude-test scores, race, gender; Kjelland, 2008; Weiss, 1983, 1995). This study focuses on the influence of Army enlisted soldiers’ education credentials and signaling on their occupational success via retention and promotion.
iv
v
“By three methods we may learn wisdom: First, by reflection, which is noblest; second, by
imitation, which is easiest; and third by experience, which is the bitterest.”
― Confucius
vi
ACKNOWLEDGEMENTS
“Listen to the mustn'ts, child. Listen to the don'ts. Listen to the shouldn'ts, the impossibles, the won'ts. Listen to the never haves, then listen close to me... Anything can happen, child. Anything can be.”
― Shel Silverstein
Many sources of support and inspiration have gotten me through my doctoral studies, the ultimate being my Lord and Savior, Jesus Christ. Without my faith and the serenity of prayer, I am not sure I would have succeeded in this task. I give all glory to Him.
The journey has been long to complete a goal that started when I was five years old. Like many young girls, I wanted to be just like my mother when I grew up, and secretly I set the goal to be a “doctor” when I realized my mother was a doctor. My mother’s achievements and hard work continue to be an inspiration to me. For a variety of reasons I have also admired my sister. Whether it is sibling rivalry or wanting to model myself after her, my sister’s intellect and academic achievements have inspired me to pursue my educational goals.
Throughout this process, I have become aware of how invaluable my parent’s support and encouragement are to me. My mother and father have given me tough love when needed and celebrated my achievements. I am lucky and blessed to have them in my corner.
vii
During my graduate studies at UNC, my family was blessed with the birth of my niece, Charlotte, and my nephew, Jameson. The two of them have renewed my drive to ensure the best educational outcomes for American children. They bring light and positivity to every day and hope for the best in the next generation.
And last, but not least, I give special thanks to my Gram, a hard-working and independent woman. She has always given me love and support to pursue my dreams and aspirations, always encouraging me to live my life to the fullest.
viii
TABLE OF CONTENTS
LIST OF TABLES ... xiii
LIST OF FIGURES ... xvi
LIST OF EQUATIONS ... xvii
CHAPTER 1: INTRODUCTION ... 1
Statement of the problem ... 3
Predictors of military retention ... 5
Education tiers ... 6
The selectivity of the U.S. Army ... 7
Sample ... 9
Purpose of the study and research questions ... 9
Research questions regarding retention ... 10
Research questions regarding promotion ... 11
Measures ... 11
Hypotheses ... 12
Retention hypotheses ... 12
Promotion hypotheses ... 13
Significance of this research ... 16
CHAPTER 2: LITERATURE REVIEW ... 18
Conceptual framework: Economic signaling theory of education ... 19
ix
Education Credentialing ... 22
Education Signaling ... 23
Gender as a signal ... 23
Race as a signal ... 24
Character as a signal ... 24
Years of schooling as a signal ... 25
Achievement tests as a signal ... 27
The GED option ... 28
The history of the GED ... 28
GED exam content ... 30
GED norming and scoring ... 31
Characteristics of and research on the GED test-taker ... 33
Military tiers ... 35
Military retention research across all services ... 37
Education and achievement test indicators of retention ... 39
Military promotion research ... 42
Summary of military retention ... 43
CHAPTER 3: DATA AND METHODOLOGY ... 45
Data ... 45
Data source ... 45
Data and Measures ... 46
Education and testing data ... 46
Armed Services Vocational Aptitude Battery (ASVAB) ... 46
Armed Forces Qualification Test (AFQT) ... 50
x
Enlistment rank ... 52
Interactions ... 54
Sample ... 54
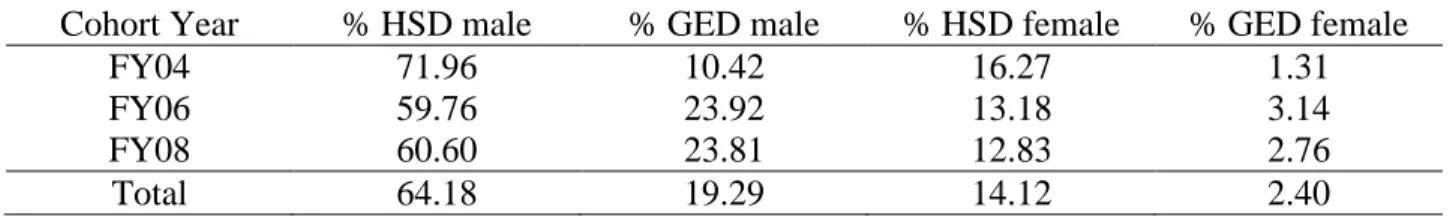
Cohorts by gender and education ... 56
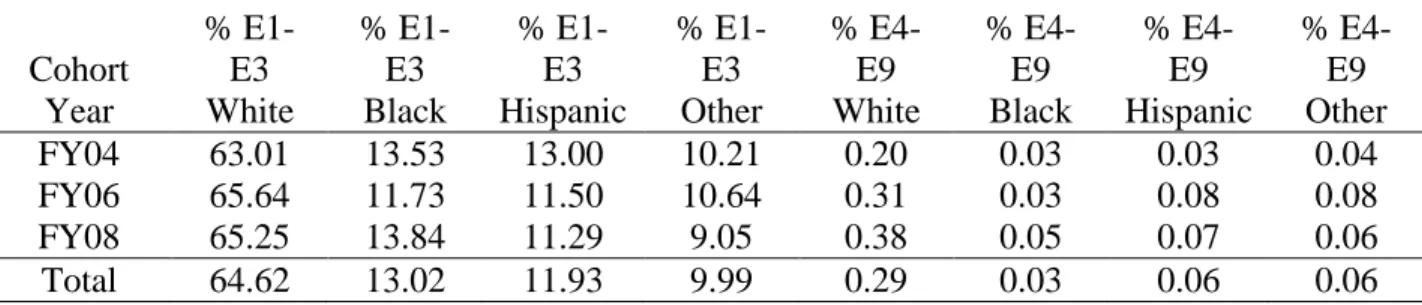
Cohorts by race and education ... 57
Cohorts by rank, with education, gender and race ... 58
Descriptive statistics ... 60
Missing data ... 60
Summary of Data and Measures ... 61
Methodology ... 65
Research Questions ... 65
Research questions regarding retention ... 65
Research questions regarding promotion ... 66
Cross-tabulation ... 68
Logistic regression ... 69
Goals and uses of logistic regression ... 70
Logistic and linear regression: similarities and differences ... 71
Maximum likelihood estimation (ML) ... 73
Odds ratios and pseudo R2 ... 73
Model construction and interpretation ... 75
Summary of methods ... 77
CHAPTER 4: FINDINGS ... 78
Retention through cross-tabulation ... 79
Research questions regarding retention ... 79
xi
Retention at 4 years ... 86
Summary on retention through cross-tabulation ... 94
Promotion through cross-tabulation ... 96
Research questions regarding promotion ... 96
Promotion at 2 years ... 97
Promotion at 4 years ... 104
Summary on promotion through cross-tabulation ... 112
Logistic regression ... 116
Logistic regression on retention ... 118
Summary of logistic regression on retention ... 128
Logistic regression on promotion ... 133
Summary of logistic regression on promotion ... 139
Summary of findings ... 143
Retention ... 143
Promotion ... 145
CHAPTER 5: DISSCUSSION ... 147
Main findings and limitations of study ... 147
Connection to Economic Theory ... 152
Conceptual framework review ... 152
Retention findings connected to Economic Theory ... 156
Credentialing ... 156
Signaling ... 156
Promotion findings connected to Economic Theory ... 160
Credentialing ... 160
xii
Implications of findings ... 162
Economic Theorists ... 162
Army ... 167
School leaders ... 170
Future research ... 172
Conclusion ... 173
APPENDIX A: VOTE COUNTING – LOGISTIC REGRESSION – RETENTION – BY COHORT AT 2 AND 4 YEARS ... 175
APPENDIX B: VOTE COUNTING – LOGISTIC REGRESSION – PROMOTION – BY COHORT AT 2 AND 4 YEARs ... 177
APPENDIX C: COHORT AS AN INDEPENDENT VARIABLE FOR TIME – LOGISTIC REGRESSION ... 179
xiii
LIST OF TABLES
Table 1 Army 36-Month Attrition for FY 1988-2005 Non-Prior Status
Accessions by Education Credential ... 40
Table 2 Percentage of 36-Month Attrition for FY 1988-1993 All Services Non-Prior Service Accessions by Education Credential, Tier, and AFQT Category ... 41
Table 3 ASVAB Exam Content ... 47
Table 4 ASVAB and Education Requirements by Military Branch ... 49
Table 5 Test Score Category and AFQT results ... 51
Table 6 Three-Year Attrition Rates by Credential Type and AFQT Score for All Services, 1988 to 2012 ... 52
Table 7 Army E1-E5 Ranks and Duty Descriptions ... 53
Table 8 Basic Pay for Active Duty Soldiers ... 54
Table 9 Tier I and AFQT TSC Results for Active Army Enlisted, by Cohort .. 55
Table 10 Cohort Size, Gender, and Education ... 56
Table 11 Cohort by Gender With Education ... 56
Table 12 Education Credential by Race: FY04 Cohort ... 57
Table 13 Education Credential by Race: FY06 Cohort ... 57
Table 14 Education Credential by Race: FY08 Cohort ... 58
Table 15 Cohorts by Rank and Education ... 58
Table 16 Cohorts by Rank and Gender ... 59
Table 17 Cohorts by Rank and Race ... 59
Table 18 Descriptive Statistics of the Study Sample and % Missing Data ... 62
Table 19 Retention at 2 Years by Education Credential, by Cohort ... 80
xiv
Table 21 Retention at 2 Years by AFQT Category and Education
Credential, by Cohort ... 82 Table 22 Retention at 2 Years by Gender and Education Credential,
by Cohort ... 84 Table 23 Retention at 2 Years by Race and Education Credential,
by Cohort ... 85 Table 24 Retention at 4 Years by Education Credential, by Cohort ... 87 Table 25 Retention at 4 Years by AFQT Category, by Cohort ... 88 Table 26 Retention at 4 Years by AFQT Category and Education Credential,
by Cohort ... 90 Table 27 Retention at 4 Years by Gender and Education Credential,
by Cohort ... 91 Table 28 Retention at 4 Years by Race and Education Credential,
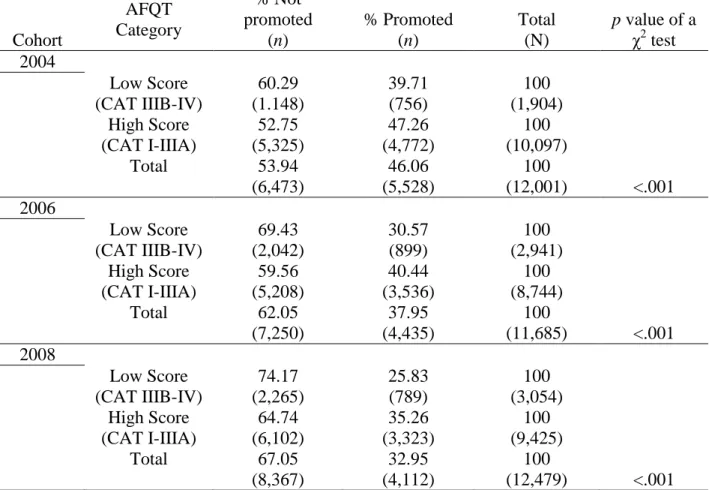
by Cohort ... 92 Table 29 Promotion at 2 Years by Education Credential, by Cohort ... 97 Table 30 Promotion at 2 Years by AFQT Category, by Cohort ... 98 Table 31 Promotion at 2 Years by AFQT Category and Education Credential,
by Cohort ... 100 Table 32 Promotion at 2 Years by Gender and Education Credential,
by Cohort ... 101 Table 33 Promotion at 2 Years by Race and Education Credential,
by Cohort ... 103 Table 34 Promotion at 4 Years by Education Credential, by Cohort ... 105 Table 35 Promotion at 4 Years by AFQT Category, by Cohort ... 106 Table 36 Promotion at 4 Years by AFQT Category and Education Credential,
by Cohort ... 107 Table 37 Promotion at 4 Years by Gender and Education Credential,
by Cohort ... 109 Table 38 Promotion at 4 Years by Race and Education Credential,
xv
Table 39 Logistic-Regression Odds-Ratio Retention Output at 2 and 4 Years
for the 2004 Cohort ... 118 Table 40 Logistic-Regression Odds-Ratio Retention Output at 2 and 4 Years
for the 2006 Cohort ... 123 Table 41 Logistic-Regression Odds-Ratio Retention Output at 2 and 4 Years
for the 2008 Cohort ... 126 Table 42 Summary Logistic-Regression Retention Analysis of All Cohorts at
2 Years ... 129 Table 43 Summary Logistic-Regression Retention Analysis of All Cohorts at
4 Years ... 129 Table 44 Logistic-Regression Odds-Ratio Promotion Output at 2 and 4 Years
for the 2004 Cohort ... 134 Table 45 Logistic-Regression Odds-Ratio Promotion Output at 2 and 4 Years
for the 2006 Cohort ... 135 Table 46 Logistic-Regression Odds-Ratio Promotion Output at 2 and 4 Years
for the 2008 Cohort ... 138 Table 47 Summary Logistic-Regression Promotion Analysis of All Cohorts at
2 Years ... 139 Table 48 Summary Logistic-Regression Promotion Analysis of All Cohorts at
4 Years ... 139 Table 49 Retention Hypotheses, Literature Supports, Economic Theory, and
Analytic Findings ... 153 Table 50 Promotion Hypotheses, Literature Supports, Economic Theory, and
Analytic Findings ... 157 Table 51 Education Credentialing and Signaling in Army Retention and
xvi
LIST OF FIGURES
xvii
LIST OF EQUATIONS
Equation 1 AFQT Score ... 50 Equation 2 Probability-to-Odds-Ratio Correlation ... 74 Equations for logistic-regression models ... 76 and 116
Equation 3 Education credential and AFQT score
Equation 4 Education credential, AFQT score, and gender Equation 5 Education credential, AFQT score, gender, and race
1
CHAPTER 1: INTRODUCTION
Teachers, parents, and counselors frequently advise their students that staying in school and earning a High School Diploma (HSD) or a Graduate Educational Diploma (GED) is not only beneficial to their future employment opportunities but also beneficial with respect to their future financial and career successes. Teachers, counselors, and administrators of students who are from lower social/economic status strongly emphasize these secondary educational goals because students of this subgroup often do not have the financial resources that would enable them to pursue education beyond the high school level.
These views regarding the importance of basic education are consistent with current economic theory that asserts that education credentials tend to signal to potential employers that the job applicant with a HSD or GED has the fortitude to persevere and the potential to be more productive than the applicant who fails to complete a high school education.
2
student completes has positive implications for the future employment/financial successes of the student.
Education credentialing theory, however, goes one step further and relates earning power and financial and career success to the educational degrees and credentials earned by the student. Implicit in education credentialing is the belief that educational milestones of degrees or
credentials, such as HSDs or GEDs, reflect positive personal characteristics that are valued by employers. Under this theory, the more formal degrees/certifications the applicants have, the more desirable they are to the potential employer.
This study and its analyses focused on the relationship between these two educational achievement groups (i.e., HSD and GED recipients) and selected demographic variables as they related to the retention and promotion paths of Army enlisted soldiers over a period of several years.
Military service has long been a viable employment option for young men and women who do not plan to attend college but are physically fit, have no criminal record, and have earned either a HSD or a GED. In fact, this group of young people makes up the majority of enlisted soldiers in the U.S. Army and have been the foundation of the Army’s enlisted ranks for several years.
3
The analyses of this dissertation were designed to determine if the findings of the 1980s studies were still valid in today’s Army, in terms of both promotion and retention of non-prior service enlisted soldiers with HSD and GED education credentials. The findings are especially salient during the current time of military downsizing and increased numbers of enlisted applicants with GED credentials. The results also provide information regarding whether economic signaling that is present in the general labor market also exists in the meritocracy of the U.S. Army. Furthermore, findings from the study have the potential to guide and inform the curriculum, counseling, and advisement of prospective soldiers. Whether utilized through advising, leading, or parenting, the results of this research highlight possible deficiencies and realities of the transition to enlisted military life with and without traditional high school qualifications.
The remainder of this chapter further defines the focus of the study. The first half of the chapter details the financial implications of retention of enlisted recruits and the guidelines that the Army uses to select and retain qualified enlisted applicants. The chapter goes on to detail specific information on the study including the sample, research questions, and hypotheses. Finally, the chapter concludes with the potential value of the findings to Army policymakers, economic theorists, and educators.
Statement of the problem
4
and more responsibility, both of which increase the soldier’s potential for future career advancements/training in the Army.
Military attrition, or reduced retention, was defined in this study as failure to complete the full contracted term of service. Attrition from the Army is either voluntary or mandated by the Army (i.e., involuntary attrition). The Army’s decision not to retain a soldier is frequently due to the soldier’s failure to meet the physical standards/requirements of the training or the soldier’s inability to adapt to the military culture. The reasons for a soldier’s voluntary leave prior to fulfilling the full contract term of service varies, but typically soldiers with less education are more likely to leave the service early.
5 Predictors of military retention
Investigating the causes of military separation is challenging because of the wide array of circumstances and differences in how each military branch reports and handles instances of reduced retention (Laurence et al., 1996).
The military branches have identified three distinct time periods during which separation from military service occurs. These benchmark time periods are (a) basic training, (b) skill training, and (c) service in the field or active service time (Laurence et al., 1996). The recorded rationale for attrition varied from one period to the next (Laurence et al., 1996). Typically, most early attrition occurred during the basic training time period, which is structured much like high school with lectures, classwork, and homework (Laurence et al., 1996).
The U.S. Department of Defense categorizes the reasons for separation from military service into eight interservice separation codes (ISC) or leave codes (Laurence et al., 1996). Four of the eight are attrition codes (i.e., medical disqualifications, dependency or hardship, failure to meet minimum behavioral or performance criteria, other separations or discharges), with failure in behavior and performance criteria being the most frequently cited reason for separation
(Booth-Kewley, Larson, & Ryan, 2002; Klein, Hawes-Dawson, & Martin, 2009; Laurence, 2014; Laurence et al., 1996).
6
specific leave code either exceeds the limit for the specific code and/or there are administrative guidelines in place that preclude additional entries into these specific leave categories. In such cases, secondary (or alternate) leave codes are frequently utilized (Booth-Kewley et al., 2002; Laurence et al., 1996; USGAO, 1997). This situation distorts the accuracy of the discharge records, especially in cross-branch analysis. Therefore, to avoid confusion regarding retention classification and coding, the current study focused on only one military branch, the U.S. Army. Education tiers
Despite the inconsistency in military attrition records, retention trends do exist across the military services. Although several factors contribute to a soldier’s decision to leave the military, the existing research shows that the strongest predictor of early separation across military
branches, races, and genders is education (Booth-Kewley et al., 2002). Links between reduced retention and gender, race, and aptitude are less convincing than the correlation between
retention and education credentials (Booth-Kewley et al., 2002). As such, education credentials tend to serve as a marker of a soldier’s training, occupational success, skill, and longevity over other variables (Burkhauser, Hanser, & Hardison, 2014; Laurence, 2014).
The U.S. military did not always screen for education qualifications. Prior to a 1980 research study on education credentials and retention, candidates (i.e., potential military recruits) with HSD credentials were not differentiated from candidates with GED credentials. However, the results of the 1980 military manpower studies clearly showed that there was a difference in retention of HSD and GED recipients. These findings were the impetus for the Military
7
The three-tier system classifies soldiers by educational qualifications. Tier I includes candidates with HSDs, some postsecondary courses, or adult education diplomas. Tier II consists of soldiers with GEDs, distance learning, or virtual diplomas. Tier III includes candidates who enlisted in the military without education credentials (e.g., high school dropouts). Homeschooled candidates are placed in Tier I or Tier II, depending on their military aptitude scores. The
military three-tier system mimics the impact of education credentials in the civilian labor market where employees with more education, as indicated by degrees and certificates, are viewed as more desirable and productive employees by employers.
The structure of the three-tier system is based on the findings that Tier I candidates are more successful in their job assignment and less likely to separate from military service prior to the fulfillment of their initial contractual term than Tier II and Tier III candidates. To overcome the educational requirements and to qualify for military selection and placement, Tier II and Tier III recruits are required to score higher on the Armed Service Vocational Aptitude Battery (ASVAB) than their Tier I counterparts. Although not alleviating retention concerns, the rationale for the cut score differences across tiers is that those recruits who do not have a HSD but score high on the military aptitude test are more trainable and exhibit better job performance than recruits in Tiers II and III who do not score well on the ASVAB (Laurence, 2014).
The selectivity of the U.S. Army
8
assessing new personnel into the military is costly and time-consuming, it behooves the Army to practice prudence in identifying likely candidates who have the intellectual ability and the attributes that will make them good investments for multiple years of service, especially in today’s austere environment.
Accordingly, the Army has a number of requirements for non-prior service soldiers that often screens out young men and women who want to join. Candidates for enlistment in the Army have to satisfy eligibility requirements that include age, citizenship, aptitude, education, medical, and conduct screening. Those candidates with health issues, drug or alcohol abuse problems, weight problems, or criminal offenses are not considered as viable candidates for Army service.
Furthermore, potential candidates not only are required to meet educational criteria, per their incoming degree or diploma, but are required to do well on the Armed Services Vocational Aptitude Battery (ASVAB), which evaluates their abilities to perform well within the Army’s unique structure. The ASVAB is a multiple-choice test designed to measure a candidate’s verbal, math, science, and technical and spatial aptitude. There are four sections of the ASVAB, referred to as the Armed Forces Qualification Test (AFQT), used for specific branch assignment
eligibility.
9
only 23.4% of the pool of 17-24 year-olds were qualified to serve in the Army in 2012 (ODCSP, 2015). This percentage of candidates was further decreased by competition from other military services and potential candidates’ lack of propensity to serve in the military services.
Sample
The sample for this study consisted of three cohorts of non-prior service enlisted Army soldiers with HSD or GED credentials from 2004 to 2012. The three cohorts were selected for several reasons including the facts that (a) the Army experienced an increase in enlistments following the terrorist attacks of 9/11, and those who enlisted were aware of the high probability that they would be deployed overseas for combat-related military service (e.g., Afghanistan and Iraq); (b) patriotism was high and new soldiers were committed to serving their country for one to two terms of service, with a term running 3 to 4 years; and (c) the similarity of the cohort groups allowed for comparison of trends using the same measures (i.e., ASVAB and GED exams). Additionally, the opportunity to track cohorts over 4 years made it possible to identify those soldiers who left the Army prior to their enlistment term, completed one full term, or served more than their initial tour of service. Moreover, during the period of time for the study, soldiers were deployed frequently and for longer periods of time. This was important because soldiers who have deployed have higher retention than those who have not deployed (ODCSP, 2015).
Purpose of the study and research questions
Since the Army manpower studies of the 1980s, there have been increases in the
10
educational backgrounds of the U.S. population still have the same relationship to retention and career success that existed in the past. Such assessments help determine if the bias regarding economic theory through retention and performance of GED versus HSD, the two largest enlisted populations, are still valid.
Focusing on the Army as the population of interest allows for a comparison of the three cohort groups within the Army’s unique structure. The Army is viewed as a meritocracy, a system in which the talented are selected and moved ahead into leadership positions on the basis of intellectual criteria and achievement. Operating under the premise of a meritocracy, the Army data provide an ideal study group for measuring enlisted retention and promotion as well as an analysis of the relationship to other variables such as education, gender, race, and cognitive ability as defined by standardized test scores.
Research questions regarding retention:
1. Do enlisted soldiers with High School Diplomas (HSDs) serve in the Army for a longer period of time than enlisted soldiers with General Education Diplomas (GEDs) (service retention)?
2. Are enlisted soldiers with low test scores more or less likely to be retained than high-test-score enlisted soldiers?
3. Are enlisted soldiers with low test scores and with High School Diplomas (HSDs) more likely to be retained than enlisted soldiers with low test scores and General Education Diplomas (GEDs)?
11
5. Is there any disparity in retention across races of those enlisted soldiers with the same education credentials?
Research questions regarding promotion:
1) Are enlisted soldiers with High School Diplomas (HSDs) more likely to be promoted than General Education Diplomas (GEDs) enlisted soldiers (career progression)? 2) Are enlisted soldiers with high test scores more likely to be promoted than enlisted
soldiers with low test scores?
3) Are enlisted soldiers with low test scores and High School Diplomas (HSDs) more likely to be promoted than enlisted soldiers with low test scores and General Education Diplomas (GEDs)?
4) Is there any disparity in promotion tracks across the genders of those enlisted soldiers with the same education credentials?
5) Is there any disparity in promotion tracks across races of those enlisted soldiers with the same education credentials?
Measures
The research questions were addressed by calculating the retention and promotion (i.e., changes in rank) of the three cohort groups of enlisted Army soldiers at 2 years and 4 years after enlistment to determine if there were any discernible differences over time for the three separate cohort groups by their education credentials.
12
potential bias in the promotion and retention for those soldiers who enlisted in the early part of the cohort year versus those who entered the Army in the latter part of the cohort year.
Hypotheses
Retention hypotheses
Army enlisted soldiers with HSDs were hypothesized to stay in service longer than Army enlisted soldiers with GEDs. This hypothesis was based on several research studies that have shown that soldiers and civilians with more education have higher retention and employment rates than their less educated coworkers (Booth-Kewley et al., 2002; Bowman, 1971/2008; Kjelland, 2008; Kumazawa, 2010; Laurence, 2014; Laurence et al., 1996; Laurence et al., 1997; Pollack, Boyer, Betsinger, & Shafer, 2009; Psacharopoulos, 2006/2008; Talcott, Haddock, Klesges, Lando, & Fiedler, 1999; Weiss, 1995).
Furthermore, the military three-tier system for recruitment and retention was based on the findings from the 1980s that soldiers with more education served longer (Burkhauser et al., 2014; Greene, 2002; Laurence, 2014; Laurence et al., 1997; NLE, 1998). Hence, education has been identified as the best predictor of military attrition, and research has shown that soldiers with less education have a higher tendency of premature departure from service (Booth-Kewley et al., 2002; Laurence, 2014; Laurence et al., 1997).
More education has also been tied to higher AFQT scores (Arkes, 1999; Buddin & Kirby, 1997). Therefore, if HSD soldiers serve longer than GED soldiers, and there is a positive
13
connection has been, and still is today, the basis for the military’s use of test scores as a screen for enlistment eligibility (Booth-Kewley et al., 2002).
Research on military retention differences between the genders has found that male soldiers stayed in service longer than female soldiers (Booth-Kewley et al., 2002; Pollack et al., 2009; Wolfe et al., 2005). Still, education has been identified as the best predictor of military attrition and to have the stronger influence on Army retention (Booth-Kewley et al., 2002; Laurence, 2014; Laurence et al., 1997). Therefore, it was hypothesized that HSD males would have the highest retention, followed by HSD females, GED males, and lastly GED females. This hypothesis emphasized the stronger influence of education over gender as a predictor of Army retention, per the military tier system and education credentialing.
Military retention research regarding racial differences has found that Hispanic soldiers remained in service longer than Black or White soldiers (Booth-Kewley et al., 2002; Pollack et al., 2009; Talcott et al., 1999). Despite the previous findings, the hypothesis for this study was that White soldiers would exhibit the highest retention, followed by Hispanic soldiers and then Black soldiers. This hypothesis was based on historical trends of significant mean differences of race in education, employment, credentialing, and test score distributions that favor Whites over Hispanics and Blacks (Sackett, Schmitt, Ellingson, & Kabin, 2001). Additionally, education was hypothesized to remain the more prominent variable for predicting Army retention over race (Booth-Kewley et al., 2002; Laurence, 2014; Laurence et al., 1997).
Promotion hypotheses
14
2006/2008). This has also been true for soldiers in the military setting, where soldiers with HSDs have been more successful than soldiers with GEDs (Laurence, 2014). Additionally, more
education results in higher cognitive ability, higher AFQT scores, and greater ability to learn new skills on the job (Arkes, 1999; Bowman, 1971/2008; Buddin & Kirby, 1997). Thus, education credentials enhance the value of the employee to the employer and result in more promotion opportunities (Arkes, 1999; Riley, 1979; Smith, 2005).
Economic research has addressed the challenge of finding significant relationships between achievement test scores and wages or promotions (Weiss, 1995). Despite this difficulty, the positive correlation between education and AFQT scores found by Arkes (1999) and Buddin and Kirby (1997) and the Army’s use of AFQT scores as a screen for new recruits led to the hypothesis that soldiers with high AFQT scores would be promoted more than their lower AFQT scoring peers.
More education results in improved cognitive ability, higher AFQT scores, and increased job capabilities (Arkes, 1999; Bowman, 1971/2008; Buddin & Kirby, 1997). Employers tend to hire employees based on credentials under the assumption that those credentials indicate
15
soldiers; and AFQT score was expected to be a stronger predictor of Army promotion than education credentials.
There was minimal scholarly literature found on the subject of military promotion by gender, and most of the research was based on trends in American society. As such, males were expected to be promoted more than females, and HSD soldiers were expected to be promoted more than GED soldiers. Males were hypothesized to have higher promotion percentages based on several studies that found that males were more frequently promoted than their female coworkers (Baldwin, 1996; Maume, 1999; Ng, Eby, Sorensen, & Feldman, 2005; Smith, 2005). Additionally, males were reported to place more value on money, promotions, leadership, and power than women when ranking job attribute preferences (Konrad, Ritchie, Lieb, & Corrigall, 2000). Furthermore, in the general labor market, less educated males have been promoted more than their more educated female coworkers (Ng et al., 2005). Despite the fact that gender appeared to be a stronger predictor of promotion in the general labor market, the fourth promotion hypothesis stressed education as the stronger predictor of Army promotion. The importance of education in Army promotion was based on the structure of the military and the use of AFQT scores for entrance into the military services.
16
HSD soldiers were predicted to be promoted more frequently than their GED peers, regardless of race. Racially, White soldiers were hypothesized to be the most frequently promoted racial group, followed by Hispanic soldiers then Black soldiers. This hypothesis was based on promotion trends in the general labor market research that show White male employees
promoted more frequently than White women and both males and females of other racial groups (Maume, 1999; Smith, 2005). Additionally, military research has shown that White soldiers are promoted more quickly than Black soldiers (Baldwin, 1996; Butler, 1976; Kumazawa, 2010). The promotion of Hispanic soldiers was expected to exceed that of Black soldiers due to military research that indicated higher retention rates of Hispanic soldiers (Booth-Kewley et al., 2002; Pollack et al., 2009; Talcott et al., 1999).
Significance of this research
Findings from this research have the potential to inform three distinct audiences: (a) economic theorists, (b) the Army and its recruiting offices, and (c) school leaders and guidance counselors. In light of recent Department of Defense (DoD) budget restrictions and the
17
Furthermore, it provides information on the influence of cognitive ability scores on Army retention and promotion.
With reference to economic theory, the use of the military sample of Army enlisted soldiers allows for a unique examination of the credentialing impact of HSD and GED
certification for future outcomes in the Army’s recruiting efforts. The results indicate whether the Army’s current emphasis on HSD over GED credentials is similar to the emphasis placed on education credentials in the general labor market, or if the education differences are negated by the military meritocracy in the form of the ranking system and the cognitive screening
(ASVAB/AFQT scores) in the Army.
18
CHAPTER 2: LITERATURE REVIEW
The focus of this study was to determine if enlisted recruits who entered the Army with High School Diplomas (HSDs) stayed in the Army for a longer period of time and progressed up the enlisted ranks quicker than those enlisted recruits who entered the Army with General
Education Diplomas (GEDs). Not only did the force structure of the Army allow for a controlled comparison of these two educational groups, but the results demonstrated if the meritocratic military structure mimicked or contradicted the occupational success differences of these two educational groups found in the general labor market under economic theory.
Among the four U.S. military services, the Army has a history of accepting the highest percentage of non-prior service recruits with HSDs and GEDs and, therefore, was the most appropriate service from which to draw the sample for this study. Using a conceptual framework grounded in economic theory, three different Army cohort groups of non-prior service enlisted recruits with HSD and GED certificates were compared using the standardized cognitive marker of AFQT test scores taken from the ASVAB test series.
19
characteristics of the GED. Finally, the chapter concludes with a discussion of military retention as it relates to economic theory and the GED.
Conceptual framework: Economic signaling theory of education
Individuals base their decision to pursue or complete an education track on the relative cost of education, in terms of time and resources, as it relates to the benefits of the education credential obtained (Heckman & Polacheck, 1974; Liu & Wong, 1982). The significance of a positive correlation between education and personal economic reward, occupational opportunity, and prestige encourages many young people to complete their K-12 education and possibly continue with further studies.
Economic theory, specifically human capital theory and education credentialing, rely on investment in education, an emphasis on improved productivity, and the relationship between productivity and earnings. The fundamental connection between education and earnings relies on the signaling that occurs between the employee and his or her employer. As such,
20 Figure 1. Conceptual Framework.
Human Capital Theory
Theory built on the assumption that each additional year of schooling, no matter the level, results in an increase of earnings in the
job market with or without a degree or certificate.
Education Credentialing
Earning a degree or certificate implies the mastery of a certain skill set to include perseverance and determination that are rewarded economically in the job market.
Economic Signaling Theory of Education (Education Signaling)
Building on concepts from human capital theory and education credentialing to include other possible influences (e.g., aptitude tests scores,
21 Human Capital Theory
Within human capital theory, individuals sacrifice the resources of time and possibly money to pursue education with the hope that the sacrifice provides benefits (e.g., money, power, prestige) over time beyond the investment costs. As described in Figure 1 and shown in Figure 2, each additional year of education results in increased economic return under the premises of human capital theory and indicates the ability of individuals to produce specific outcomes. In other words, one’s level of education is an indicator of one’s innate ability to produce and to adapt (Bowman, 1971/2008; Brown & Sessions, 1999; Card, 2002; Chevalier et al., 2004; Layard & Psacharopoulos, 1974; Page, 2010; Schultz, 1970/2008; Wolpin, 1977).
Figure 2. Human Capital Theory (adapted from Card & Krueger, 1992). 0
0.1 0.2 0.3 0.4 0.5 0.6 0.7 0.8 0.9
1 2 3 4 5 6 7 8 9 10 11 12 13 14 15 16 17 18 19 20 21
Ea
rning
D
if
fe
re
ntial
22 Education Credentialing
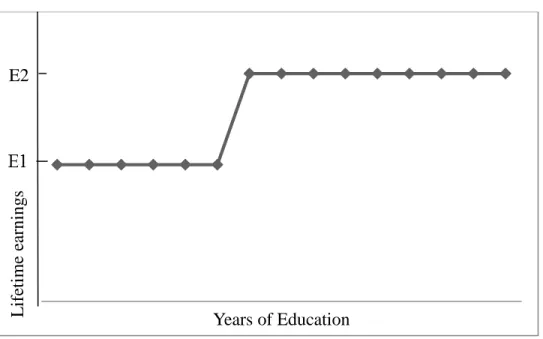
Education credentialing builds on human capital theory by focusing on cumulative educational experiences that result in the granting of degrees or earning of education certificates. Therefore, as shown in Figure 3, increases in one’s earnings coincide with one’s educational milestones (e.g., high school or college education). Figure 3 displays the pay one would receive with a degree or certificate (E2) and earnings one would receive absent a degree or certificate (E1).
Figure 3. Education Credentialing (adapted from Page, 2010).
Furthermore, more productive individuals are expected to pursue more years of education than their less productive peers, and, as such, their education credentials alert employers to their potential for higher productivity (Page, 2010). In other words, education serves as a sorting mechanism for individuals by ability level (Riley, 1979). Therefore, based on the theory of education credentialing, the attainment of education credentials by an employee is an indicator of
L
ife
ti
me
ea
rning
s
23
desirable employee characteristics (e.g., perseverance, determination, ability, productivity) to employers (Page, 2010).
Education Signaling
As displayed in Figure 1, education signaling moves beyond human capital theory and education credentialing. Education signaling allows for the incorporation of additional covariates beyond schooling that are frequently tied to job performance (Weiss, 1983, 1995). Variables such as aptitude test scores, race, and gender allow employers to further evaluate the likelihood of the employee succeeding in a work environment (Kjelland, 2008; Weiss, 1983, 1995). The following sections summarize the signaling research on factors such as gender, race, character, years of schooling, and achievement tests as markers for the employee’s potential productivity in the general labor market.
Gender as a signal
Gender roles in the U.S. have changed over the past century (e.g., more women working outside of the home, more women with higher educational degrees, fewer gender-biased jobs) (Konrad et al., 2000). Still, a meta-analysis on gender differences in job attributes for the 1970 to 1988 U.S. workforce found consistency with regards to traditional gender roles and stereotypes tied to job attributes (Konrad et al., 2000). Specifically, males placed a higher value on money, promotion, leadership, and power (Konrad et al., 2000). Females, on the other hand, placed greater value on the ease of the home-to-work commute, intrinsic jobs, and interpersonal skills (Konrad et al., 2000). Women in more traditionally masculine jobs, however, did match men on job attribute preferences (Konrad et al., 2000).
24
in several other studies along with the finding that males with less education had higher
promotion rates than their female coworkers with more education (Ng et al., 2005; Smith, 2005). Although education was a good predictor for promotion decisions, sex of the employee had more of an impact on promotion decisions (Ng et al., 2005; Smith, 2005).
Race as a signal
According to a study by Smith (2005), White males were promoted more often than minorities and females. Racial promotion disparities have been related to racial differences in aptitude test scores, education opportunities, and educational success (Sackett et al., 2001). With reference to standardized tests such as the ASVAB exam and AFQT score, Blacks and Hispanics score much lower than their White test-taking peers (Sackett et al., 2001). The impact of these differences has had devastating effects on future employment and promotion opportunities for minorities.
Character as a signal
Beyond ability level, the correlation that exists between lower education and less favorable occupation characteristics serves as a signal from employees to employers. For example, individuals with fewer years of education are more likely to exhibit tendencies to quit, be truant, have trouble learning new skills, or have health issues (Bowman, 1971/2008; Kjelland, 2008; Psacharopoulos, 2006/2008; Weiss, 1995). Therefore, employers may view the lack of education credentials as a screen for these unfavorable characteristics in potential employees.
25
the only educational indicator that is used by employers is successful completion of a degree or certificate by the employee, starting at the high school level (Schultz, 1970/2008; Wachtel, 1976; Weiss, 1995).
Years of schooling as a signal
Not only does completing a degree signal desirable characteristics to employers, but the time taken to complete the degree also has value. Under human capital theory, time spent in school is viewed positively but, per education credentialing, additional years spent in school without obtaining a degree suggest negative occupational attributes (Hungerford & Solon, 1987; Kjelland, 2008; Riley, 1979). In fact, additional years of schooling without the benefit of earning a degree or certificate result in negative rates of return and reverse signaling implications
(Kjelland, 2008). Thus, credentials and years to complete a degree result in different hiring decisions by employers. Credentials and certificates signal ability level to employers and lead to hiring decisions, whereas years of schooling to obtain credentials relate more to wage offer decisions (Liu & Wong, 1982).
26
theory, that these individuals would be more productive (Liu & Wong, 1982). However, the Liu and Wong study found that employers relied less on this information as time went on and as they conducted their own on-the-job evaluations. As a result, wages changed over time, not due to credentials but rather due to their own internal employee evaluation results (Liu & Wong, 1982).
Interestingly, other research has shown that additional years of schooling were a detriment to the employee. Specifically, within educational groupings of degree earners (i.e., among high school graduates or college graduates), additional years of education were
negatively correlated with wage earnings (Flores-Lagunes & Light, 2009; Wood, 2009). That is to say, students who took longer to obtain the same certificate or degree had lower salaries (Flores-Lagunes & Light, 2009; Wood, 2009). Flores-Lagunes and Light (2009) suggested using age rather than years of schooling when comparing the earnings of graduates because of the time required for part-time schooling or internship experiences. However, they proposed using years of schooling over age when comparing the wages of those students who had dropped out of school.
Despite the mixed results from studies related to years of schooling, the commonly held belief continues to be that the shorter amount of time required to obtain a degree signals higher cognitive ability and conversely, the longer it takes to earn a degree signals unfavorable
27
courses, a signal of lower ability, earned the same wages as students who graduated on time (Groot & Oosterbeck, 1994). The results of the Groot and Oosterbeck study contradicted
signaling theory predictions and warned against rewarding for perceived high ability on the basis of years of schooling.
Achievement tests as a signal
Having additional employee information tends to enable employers to form a more accurate picture of the employee’s occupational ability and eventual employment success. Therefore, in addition to the information on gender, race, education credentials, character, years of schooling, etc., achievement test results serve as a useful signal to employers. Armed Forces Qualification Test (AFQT) scores from the Armed Services Vocational Aptitude Battery
(ASVAB) coded into test score categories (TSC) served as an informative measure for this study. Both the ASVAB exam and AFQT scores have been used as intelligence markers in economic literature. In a report that summarized the findings from years of their earlier work, Cawley, Heckman, and Vytlacil (2001) found little difference in the predictive power of wage variance when using the entire ASVAB battery results versus the four specific sections used for the AFQT scoring. However, in several studies, higher ability scores on the ASVAB were
28
scores and earnings for the sample of over 6,000 full-time employed Italians who were in high-skilled jobs 3 years after their 1998 graduation (Castagnetti, Chelli, & Rosti, 2005).
Despite these findings, a common and frequently reiterated sentiment in the economic literature is that “there is a long history of researchers failing to find an economically significant relationship between scores on achievement tests and wages” (Weiss, 1995, p. 140). However, it is difficult to disentangle achievement test results from motivation and employment success (Kjelland, 2008; O’Neill, 1990). This is especially true in the military setting where scores on the ASVAB, and subsequently the AFQT, determine one’s duty and branch assignment.
Therefore, the predictors for success in the military may mimic but not fully align with signals used in the civilian job market. Thus, to increase retention, the military created a tier system to distinguish between candidates of different education credentials. This study focused on the comparison of soldiers with HSDs, classified as Tier I candidates, to those soldiers with GEDs, classified as Tier II candidates.
The GED option
The military three-tier system assumes aptitude differences among candidates possessing varying education credentials. To fully understand the rationale behind the tier structure, a better understanding of the GED is required. The next several sections outline the rationale for the creation of the GED exam, critical analysis of the exam, and characteristics and changes among those who have taken the tests.
The history of the GED
29
curriculum including a written section, literary interpretation, math, science, and social studies in the form of multiple-choice questions (Bowen & Nantz, 2014; NLE, 1998; Tyler, 2005). The five sections that comprised the original 1942 GED were selected by an Army Institute Advisory Committee from the Iowa Test of Educational Development test bank (Tyler, 2003, 2005). Similar attempts to create a generalized high school qualification test after World War I were thwarted by institutes of higher education, but increased effort, cooperation, and public and political support garnered enthusiasm for the creation of the GED assessments after World War II (NLE, 1998). The original purpose of the GED was to provide World War II veterans who had not completed their high school education with access to postsecondary educational
opportunities under the GI Bill (Tyler, 2003).
The GED was only available to war veterans for the first few years it was administered, but in 1947 New York became the first state to allow high school dropouts to take the assessment exam (Tyler, 2003). Since its creation, the GED has grown in popularity as a viable alternative to a traditional high school diploma for civilians and war veterans alike. As early as 1959, the number of civilian GED test-takers outnumbered the service members for whom the exam was originally designed (NLE, 1998).
30
who were asking for financial assistance to seek employment, return to high school, or enroll in adult education programs to prepare themselves for the GED exam (Murnane et al., 2000).
Access to the GED for those as young as 16 years of age or those who were incarcerated increased the popularity of the assessment (Rachal & Bingham, 2004; Tyler, 2005). By 2003, the annual count of GED test-takers was roughly 700,000 to 800,000, with the majority (e.g.,
500,000) of the test-takers receiving a passing grade (Tyler, 2003). The popularity of the GED has continued to grow over time with changes to educational standards and reform such as No Child Left Behind and the Common Core State Standards (Heckman & LaFontaine, 2010). In 2009, 84.4% of the 18-24 year-olds in the United States had some form of high school credential, and of that group 5.1% had GED certification (Institute of Education Sciences [IES], 2011a).
In summary, the GED has gained popularity since its inception based on increased access for civilians and disadvantaged groups as well as changes in educational policies and federal funding.
GED exam content
Not only has the population of GED test-takers changed over the decades, but the test itself has undergone significant changes. The original version of the test consisted of 10 hours of multiple-choice questions on reading selections and mathematics that included algebra and geometry. The 1978 version of the GED changed from information-recall questions to concept and application questions for the social studies and science sections, and included more realistic and factual reading passages. Due to the changes in the test-taking population (e.g., war veterans to the general public), the 1981 version of the GED used simplified language that was
31
taking the test, which included a writing sample and problems focused on real-world application scenarios. The 2002 version of the GED, which was taken by all of the GED recipients in the study sample for this dissertation, included the use of a scientific calculator for a portion of the mathematics exam and a restructured rubric for the writing section.
GED norming and scoring
The GED test has been criticized for being too easy, for having low passing requirements (e.g., to receive a passing grade, only one third of the test questions had to be answered
correctly), and for allowing multiple retakes on sections of the exam (Greene, 2002). In addition to these concerns, the scoring and norming procedures have frequently been questioned and criticized.
The GED norming sample was comprised of a random sample of high school seniors who took one to three of the five GED content tests (Heckman, Humphries, & Mader, 2010). Scores of GED test-takers were then compared to the high school norming sample to determine if they had passed the exam. The cut scores were set so that roughly two thirds of the sample passed the exam (American Council on Education [ACE], 1995; Tyler, 2003, 2005). The GED exam cut scores, or minimum passing standards, were set by the Commission on Educational Credit and Credentials, but individual states could opt for additional standards prior to awarding GED certificates (IES, 2011a; NLE, 1998).
Much of the criticism regarding the GED norming process focused on the lack of incentives for the high school norming sample to give their best effort on the test. As such, the norming scores may have underestimated the true potential of the norming group and
32
thirds of high school seniors, as suggested by the normed cut score. This discrepancy was due to the lack of incentives of the norming group, the wide access that GED test-takers had for
preparation for taking the exam, and the high frequency of GED retesting (Tyler, 2003, 2005). Prior to 2002, the scoring process for the GED exam was relatively stable with a test score range of 20-80 on each of the five sections, a median of 50, and a standard deviation of 10. On that scale, the original 1942 standards required a minimum passing score of 35 on each section or an average of 45 for the five tests. In 1982, the minimum passing score for each section of the GED was raised to 40. The scoring scale was again changed for the 2002 GED test, the version used for the GED sample of this study, from the 20-80 range to a completely different scoring structure of 200-800. Additionally, the 2002 version of the GED test included a new minimum score of 410 for each section and a mean score of 450 for the five subtests. Despite the fact that these changes only seemed to represent a scale change with an additional zero at the end of the scores (e.g., median of 500 and standard deviation of 100 on the new scale compared to a median of 50 and a standard deviation of 10 on the previous scale), the GED testing service insisted that these revisions were more meaningful than the mere addition of a zero.
33
Characteristics of and research on the GED test-taker
Since the introduction of the GED as an alternative to a traditional HSD, education researchers have frequently examined the differences between the two educational groups. Demographically, high school dropouts consist of both genders and all races, but the dropout population tends to have higher percentages of Black and Hispanic students, students from lower socioeconomic backgrounds, and students for whom English is not their primary language (Chuang, 1997; Heckman & LaFontaine, 2010; IES, 2011b, 2015).
Research on whether the availability of the GED option promotes early exits from high school has yet to be conclusive, but trends on dropouts who pursue a GED and dropouts who do not pursue GED certification do exist. The Institute of Education Sciences has highlighted several indicators of students at high risk for dropping out of high school, and their findings include both those who subsequently earned a GED certification and those who never pursued additional education credentials (no-GED). For example, while in high school, both GED and no-GED students were more inclined to enroll in remedial classes and avoid college preparatory coursework (IES, 2011b). Furthermore, even though the grade point averages (GPAs) of GED and no-GED students were similar, scores on standardized tests revealed higher cognitive ability among the GED students (IES, 2011b). Moreover, both GED and no-GED dropouts exhibited more behavioral problems (e.g., assault on teachers, tardiness, truancy, substance abuse) while in school than their HSD peers (Cawley et al., 2001; Chuang, 1997; Jaeger & Page, 1996;
34
A synthesis of the GED research up to 1997 found that (a) HSD graduates did better in the labor market than GED recipients; (b) GED recipients came from more economically advantaged families than students who dropped out of high school and did not pursue a GED certificate (no-GED); (c) GED recipients exhibited higher cognitive ability than no-GED dropouts; (d) even though both GED recipients and no-GED dropouts left school before high school graduation, GED recipients attended school for a longer period of time than the no-GED dropouts; and (e) GED recipients had greater earnings over time than the no-GED dropouts (Tyler, 2003). However, when controlling for family background, cognitive ability, and years spent in school, job earnings for GED recipients and no-GED dropouts were similar (Cameron & Heckman, 1993; Tyler, 2003). It was also noted that the no-GED dropouts were more likely to serve jail time, experience poor physical and mental health, and abuse drugs and alcohol than were their peers who obtained GED credentials (Heckman et al., 2010; IES, 2011a, 2011b; Laurence, 2014; Psacharopoulos, 2006/2008). Additionally, GED recipients were more likely to be male and come from a single-family home when compared to their HSD peers (Cameron & Heckman, 1993; IES, 2011b).
35
Obtaining the GED certificate was more economically beneficial for high school dropouts with lower reported cognitive skills because those with higher cognitive ability were able to obtain steady jobs without the benefit of GED credentials (Cameron & Heckman, 1993; Murnane et al., 2000; Tyler, 2001). Nonetheless, it still took roughly 4 to 5 years for GED recipients to realize the economic advantages of earning their GED credentials (Tyler, 2001, 2002, 2003). As such, a student’s decision to remain in school and earn a HSD, drop out and earn a GED, or drop out and not pursue a GED remains a decision that is based on economics and future earning potential (Tyler, 2003).
On the basis of earning data from 2007, GED recipients and no-GED dropouts, when compared to HSD graduates, earned roughly $260,000 less and paid nearly $60,000 less in taxes over their lifetime (Psacharopoulos, 2006/2008). This loss in income amount to billions of dollars lost in income taxes for the U.S. government, half of which could have been recouped if high school dropouts had completed just one more year of schooling (Psacharopoulos,
2006/2008).
In summary, research comparing the earnings of students with HSD, GED, and dropouts with no-GED supports economic theory by favoring HSD over GED and GED over no-GED. Even though findings suggested that those with a HSD fared better in the labor market than GED recipients, the cognitive, life, and social abilities of these two groups were not drastically
different. However, despite these similarities, GED recipients were more likely to enter the workforce or enlist in the military than pursuing additional education.
Military tiers
36
ability. The military forces have developed categories and protocols that recruiters use to ensure that they get the best candidates to fill the enlisted ranks. Based on the retention studies from the 1980s, three groupings or educational tiers were created to assure a higher probability of enlisted retention.
Tier I consists of individuals who have earned a traditional high school diploma, attended some college, or earned an adult education diploma. Tier II consists of individuals with
equivalency credentials such as the GED or alternative high school credentials such as distance learning or virtual diplomas. Tier III includes candidates with no high school credentials. Tier III candidates have a high risk of attrition due to their inability to adapt to the requirements of military life and, as such, they are no longer considered as eligible candidates for enlistment in the military (ODCSP, 2015).
Students who have completed high school through a homeschool option are classified as Tier I or Tier II, depending on their AFQT Test Score Category (TSC). If the recruit scores 50 or higher on the AFQT, he or she is coded in TSC I to IIIA and placed in Tier I (ODCSP, 2015).
37 Military retention research across all services
There is a rather large body of literature dealing with the subject of military attrition. Previous research has examined the influence of a host of variables (e.g., age, gender, marital status, recruitment period, pay scale, waivers, body mass index, education, test qualification scores from the ASVAB) on military attrition (Eubanks, 2014; Laurence et al., 1996; Laurence et al., 1997). For the purpose of this study, the research focused on Army enlisted retention and promotion, as influenced by a number of variables.
No one disputes the fact that service in the military is challenging because of the military structure and the nature of the mission of the military. This is especially true for those young people who have disciplinary or mental health issues. For example, a 2009 study of 1,134 soldiers with a history of mental health issues found that these soldiers had low retention rates during the study period of 1979 to 1985 (Klein et al., 2009). The longer these soldiers stayed in the military, the more violations they committed (Klein et al., 2009). Similarly, soldiers with dominant personalities also had problems adjusting to military life. A 1986 to 1987 study of 49,000 first-term Army soldiers found that those with disciplinary issues were more likely to leave the Army before the end of their enlistment term due to the soldier’s inability or unwillingness to follow orders (McCloy et al., 1993).
38
educated airmen were more frequently disciplined for misconduct that led to early separation, and White airmen had higher attrition rates than other racial groups (Talcott et al., 1999).
Larson and Kewley (2000) identified numerous reasons for Navy retention issues that occurred during boot camp training and fleet training. These reasons included challenges and failure associated with the transition to military life, dissatisfaction with military life, discipline and leadership issues, medical problems, falsified enlistments or screening inaccuracies,
substance dependency, and lack of motivation. Another 1997 to 1999 Navy study of sailors who had separated early found that more than one third of the 66,690 sailors had been discharged in their first year of service for medical, behavioral, or administrative reasons (Booth-Kewley et al., 2002). The results echoed findings from other Navy attrition studies that showed (a) females, non-Hispanics and those with less education were more likely to separate early, (b) medical and behavioral dismissals were common among the less educated, and (c) sailors who were given behavioral or administrative separation had a history of trouble with authority figures (Booth-Kewley et al., 2002).
A 1997 study of 1,530 Marine Corps soldiers conducted over a period of a year and a half confirmed that female marines had higher attrition rates than male marines (Wolfe et al., 2005). Furthermore, the attrition rates for male marines declined after the first 32 days of Marine Corps basic training, whereas the attrition rates for female marines continued throughout the entire basic training period (Wolfe et al., 2005).
39
surmised that females, non-Hispanics, and those with less education were more likely to leave Marine Corps basic training prematurely (Pollack et al., 2009).
Education and achievement test indicators of retention
Without controlling for the composition of new recruits entering the military, those who focus on the raw numbers of soldiers who prematurely separate from the military would
conclude that recruits with HSDs are more likely to leave the military prematurely than those recruits who entered the military with GED certificates. This, however, is deceptive since the vast majority of new recruits entering the enlisted branches of the military are HSD graduates. Thus, to more accurately report retention rates, attrition needs to be reported as a percentage of recruits in relationship to their respective educational grouping.
40 Table 1
Army 36-Month Attrition for FY 1988-2005 Non-Prior Status Accessions by Education Credential
Tier/Education Credential N % Attrition
Tier I
High School Graduate 1,146,429 31
College
One Semester 35,711 42
Two years or more 62,829 22
Adult Education 17,094 43
Failed Exit Exam 601 32
Tier II
H.S. Equivalency 118,341 45
ChalleNGe GED 3,454 44
Occupational Program Certificate 4,144 44 Certification of Attendance or Completion 217 38
Correspondence School Diploma 194 40
Home-School Diploma 2,669 41
Other Nontraditional H.S. Credential 174 26 Tier III
Less than H.S. Diploma 9,629 52
Note. Adapted from Laurence (2014).
Laurence (2014) also found that GED enlisted recruits who were in higher ASVAB categories (I to IIIA) were more likely to separate early from the military than those HSD
41 Table 2
Percentage of 36-Month Attrition for FY 1988-1993 All Services Non-Prior Service Accessions by Education Credential, Tier, and AFQT Category (N in parenthesis)
Tier Credential
AFQT Category
Total
I II IIIA IIIB IV
Tier I 21.4
(58, 652) 25.7 (481,559) 30.0 (350,702) 32.4 (370,335) 34.3 (40,187) 28.8 (1,309,518) Diploma Graduate 21.5
(51,106) 25.5 (453,237) 29.5 (335,599) 32.0 (354,111) 33.8 (38,709) 28.5 (1,240,394)
Tier II 40.9
(842) 45.6 (16,652) 49.9 (21,958) 47.4 (4,287) a 47.7 (44,095) GED 43.1 (722) 46.9 (14,880) 50.4 (20,053) 49.5 (2,787) a 48.7 (38,778)
Tier III 43.4
(327) 49.4 (8,060) 54.8 (11,204) 56.1 (1,750) a 52.6 (21,459) Note. Adapted from Laurence (2014).
a
Unreliable estimates with n < 50.
Table 2 shows a relationship between attrition rates, education credentials, and AFQT scores. In general, enlisted recruits in higher AFQT categories (i.e., TSC Ito IIA) were less likely to prematurely separate from military service than enlisted recruits in lower AFQT categories (i.e., IIIB to IV) of the same education credential. Similarly, those with more educational training, as indicated by tier classification, had lower attrition rates than their less experienced peers. Furthermore, Table 2 shows that Tier I recruits, even those in the lowest AFQT TSC categories (i.e., IV), had higher retention rates than Tier II and Tier III recruits who scored in the highest TSC (I).