Introduction
Harmful algal blooms occur when phyto-plankton accumulate and negatively affect the environment and human or animal health. Harmful blooms are associated with a small subset of phytoplankton species. Out of 4,000 marine phytoplankton, it is estimated that some 200 are high biomass producers, and only ~80 are potential toxin-producers (Masó and Garcés 2006; Smayda 1997; Smayda and Reynolds 2003; Zingone and Enevoldsen 2000). Although naturally occur-ring in fresh, estuarine, and marine waters, the growth, toxicity, and geographic distri-bution of harmful algae have increased in part because of environmental factors such as nutrient enrichment and warmer water temperatures (Dyble et al. 2008; Moore et al. 2008; Paerl et al. 2001; Paerl and Huisman 2008, 2009; Sellner et al. 2003). Most epide-miologic studies of harmful algal blooms, specifically those generated by cyanobacteria, have been conducted at freshwater sites. In the United States, freshwater harmful algal blooms have been associated with waterborne disease outbreaks that include dermatologic,
gastrointestinal, respiratory, febrile, ear, and eye symptoms (Dziuban et al. 2006; Hilborn et al. 2014; Yoder et al. 2004). The World Health Organization (WHO) has established guidelines for cell count categories associated with the risk of human health effects (Bartram and Chorus 1999). The lowest guidance level of 20,000 cyanobacterial cells per milliliter was derived from an epidemiologic study of freshwater cyanobacteria exposure (Pilotto et al. 1997). Currently, there is no federal regulation of cyanobacteria or cyanotoxin exposure for recreational waters in the United States; however, several state and local govern-ments have established guidelines for exposure based on their own risk assessments or those of the WHO (Burch 2008).
Adverse human health outcomes have been associated with marine dinoflagellates, diatoms, and cyanobacteria (WHO 2003). For example, harmful algal blooms produced by Karenia brevis, a marine dinoflagellate, have been reported to produce brevetoxins that are associated with gastrointestinal and respiratory illnesses (Backer et al. 2003, 2005; Hlavsa et al. 2011; Kirkpatrick et al. 2010).
Lyngbya majuscula, a benthic marine cyano-bacterium, is known to produce toxins, such as debromoaplysiatoxin and lyngbyatoxin, and to cause acute dermal lesions among swimmers (Nagai et al. 1996; Osborne et al. 2001, 2007; Osborne and Shaw 2008; WHO 2003). The picoplanktonic Synechococcus, a cyanobacterium, has been reported to produce microcystins, a group of potent hepatotoxic cyanotoxins (Carmichael and Li 2006). A limited number of epidemiologic studies have investigated the effects of harmful marine algal exposures, and most of these have focused on blooms of K. brevis (Backer et al. 2003; Kirkpatrick et al. 2010). As a result, thresh-olds or concentrations of phytoplankton associated with adverse health effects are not well-established for marine waters.
Given the association between increasing ocean temperatures and increased frequency of harmful algal blooms around the world, there is a need to understand the impact of harmful algal blooms on human health as Address correspondence to E.D. Hilborn, U.S. Environmental Protection Agency (EPA), Office of Research and Development, National Health and Environmental Effects Research Laboratory, Environmental Public Health Division, 109 T.W. Alexander Dr., Mail Code: 58A, Research Triangle Park, NC 27709 USA. Telephone: (919) 966-0658. Email: [email protected].
We thank Westat Inc. (Rockville, Maryland), L. D’Anglada of the Office of Water (U.S. EPA), and the National Epidemiological and Environmental Assessment of Recreational (NEEAR) Water Study Team for field study implementation. We also thank M. Aubel and A. Foss of GreenWater Laboratories (Palatka, Florida) for technical guidance; B. Bill of the National Oceanic and Atmospheric Administration (NOAA) (Seattle, Washington) and N. Osborne of the University of Exeter (Cornwall, UK) for thoughtful review and comments during manuscript preparation; and the NEEAR study participants.
Funding was provided by the U.S. EPA.
The views expressed in this manuscript are those of the individual authors and do not necessarily reflect the views and policies of the U.S. Environmental Protection Agency. Mention of trade names or com-mercial products does not constitute endorsement or recommendation for use.
A.D.C. is employed by GreenWater Laboratories, Palatka, Florida. The authors declare they have no actual or potential competing financial interests.
Received: 4 December 2014; Accepted: 14 September 2015; Advance Publication: 18 September 2015; Final Publication: 1 April 2016.
A Prospective Study of Marine Phytoplankton and Reported Illness Among
Recreational Beachgoers in Puerto Rico, 2009
Cynthia J. Lin,1,2 Timothy J. Wade,3 Elizabeth A. Sams,3 Alfred P. Dufour,4 Andrew D. Chapman,5 and
Elizabeth D. Hilborn3
1Oak Ridge Institute for Science and Education (ORISE) Research Participation Program at the U.S. Environmental Protection Agency
(EPA), Chapel Hill, North Carolina, USA; 2Department of Epidemiology, UNC Gillings School of Global Public Health, Chapel Hill, North
Carolina, USA; 3Environmental Public Health Division, National Health and Environmental Effects Research Laboratory, Office of
Research and Development, U.S. EPA, Research Triangle Park, North Carolina, USA; 4Microbial Chemical Environmental Assessment
Research Division, National Exposure Research Laboratory, Office of Research and Development, U.S. EPA, Cincinnati, Ohio, USA;
5GreenWater Laboratories, Palatka, Florida, USA
Background: Blooms of marine phytoplankton may adversely affect human health. The potential public health impact of low-level exposures is not well established, and few prospective cohort studies of recreational exposures to marine phytoplankton have been conducted.
oBjective: We evaluated the association between phytoplankton cell counts and subsequent illness among recreational beachgoers.
Methods: We recruited beachgoers at Boquerón Beach, Puerto Rico, during the summer of 2009. We conducted interviews at three time points to assess baseline health, water activities, and subse-quent illness. Daily water samples were quantitatively assayed for phytoplankton cell count. Logistic regression models, adjusted for age and sex, were used to assess the association between exposure to three categories of phytoplankton concentration and subsequent illness.
results: During 26 study days, 15,726 individuals successfully completed all three interviews. Daily total phytoplankton cell counts ranged from 346 to 2,012 cells/mL (median, 712 cells/mL). The category with the highest (≥ 75th percentile) total phytoplankton cell count was associated with eye irritation [adjusted odds ratio (OR) = 1.30; 95% confidence interval (CI): 1.01, 1.66], rash (OR = 1.27; 95% CI: 1.02, 1.57), and earache (OR = 1.25; 95% CI: 0.88, 1.77). In phytoplankton group-specific analyses, the category with the highest Cyanobacteria counts was associated with respiratory illness (OR = 1.37; 95% CI: 1.12, 1.67), rash (OR = 1.32; 95% CI: 1.05, 1.66), eye irritation (OR = 1.25; 95% CI: 0.97, 1.62), and earache (OR = 1.35; 95% CI: 0.95, 1.93).
conclusions: We found associations between recreational exposure to marine phytoplankton
and reports of eye irritation, respiratory illness, and rash. We also found that associations varied by phytoplankton group, with Cyanobacteria having the strongest and most consistent associations.
citation: Lin CJ, Wade TJ, Sams EA, Dufour AP, Chapman AD, Hilborn ED. 2016. A
climate change progresses (Dale et al. 2006; Gingold et al. 2014; Moore et al. 2008; Peperzak 2005). The objective of the present study was to evaluate the association between phytoplankton cell counts and subsequent illness among recrea tional beachgoers at a tropical marine beach.
Methods
We conducted a prospective study of beach-goers at Boquerón Beach, Puerto Rico, in the summer of 2009. We assessed the rela-tionship between phytoplankton counts and the development of illness after recreational exposure. This study was in the context of the National Epidemiological and Environmental Assessment of Recreational (NEEAR) Water Study. A description of the study design, objectives, and protocols and a report of the associations between fecal indicator organisms and swimming-associated illness have been published (Wade et al. 2010b).
Site description. Boquerón Beach is located on the southwest coast of Puerto Rico (Figure 1). It is approximately 1 mile long and is located on Boquerón Bay, adjacent to the Caribbean Sea.
Interviews. We offered beachgoers enrollment in the study at the beach on summer weekends and holidays for a total of 26 days. Inclusion criteria consisted of a) an adult household member > 21 years of age; b) completion of three interviews (enrollment, beach exit, follow-up); and c) no previous participation in the study within the prior 28 days. An adult answered questions for all other household members at the beach. Interviews began at Boquerón Beach on 16 May 2009 and concluded on 2 August 2009.
Participants gave verbal informed consent for study participation in their chosen
language, English or Spanish, and were inter-viewed by study personnel proficient in the language. All study materials were approved by the Institutional Review Board of the University of North Carolina at Chapel Hill. The enrollment interview collected informa-tion about demographics, baseline health, chronic health conditions, and contact infor-mation for follow-up. The exit interview collected information about water exposure and other activities in which the participants engaged while at the beach that day. Water exposure was ascertained with the following questions: “Did you immerse your body, not necessarily your head, in the water today?” “Did you put your face in the water or submerge your head in the water today?” and “Did you swallow the water?” The tele-phone interview, conducted 10–12 days later, recorded self-reported illness experienced since the beach visit. Participants were offered incen-tives, such as a cooler, a tote bag, or a beach-related item, to encourage completion of the exit interview. A US$25 check was provided to each household after the follow-up telephone interview was completed.
Health end points. The health end points were defined a priori and were similar to those previously studied in relation to recre-ational water quality and health (Colford et al. 2007; Prüss 1998; Wade et al. 2010a). They included incident cases of gastroin-testinal (GI) illness, respiratory illness, rash (independent of sunburn), earache, and eye irritation occurring during the 10- to 12-day period between the beach visit and the follow-up telephone interview. The definitions for each illness are shown in Table 1. Signs and symptoms of each health end point were inquired about separately. For example, the following was asked for stomachache: “Have you or anyone else had a stomach ache or abdominal cramping since the interview at Boquerón Beach?” Individual signs/symptoms of illness included the following: stomach-ache; diarrhea; nausea; vomiting; urinary tract infection; fever; headache; sore throat; cough; cold; runny or stuffy nose; earache, ear infec-tion, or runny ears; watery eyes; eye infection; infected cut; and rash or itchy skin. For each question, participants could answer yes or no;
they also had the option to refuse to answer or to say that they did not know.
Water samples. Three fixed transects were selected at least 60 m apart to encompass the majority of the beach site. Water at sites along each transect was repeatedly sampled for marine phytoplankton counts and toxins; samples were collected from waist depth at each location at 1100 hours on each study day (Figure 1). All samples were refrigerated or placed on ice within 30 min of collection and were maintained under refrigeration during shipment to GreenWater Laboratories/ CyanoLab (Palatka, Florida) for analysis. Water samples were combined into a daily composite sample and were quantitatively assayed for total and group phytoplankton cell counts (cells per milliliter) by an expe-rienced phycologist who used the counting method described in Standard Methods for the Examination of Water and Wastewater (American Public Health Association 1998). The limit of detection using 5-mL samples at 100× magnification was 0.2 cells/mL. Water samples were also analyzed for two cyano-bacterial toxins, lyngbyatoxin-a and debro-moaplysiatoxin, using high-performance liquid chromatography–mass spectrometry (HPLC-MS) (Nagai et al. 1996; Osborne et al. 2008). These toxins were selected a priori based on the characteristics of the site; the limit of detection for both toxins was 1.0 ppb. Major phyto-plankton groups were identified and included Cyanobacteria, Dinophyta (dinoflagellates), Bacillariophyta (diatoms), and miscellaneous other groups and morphotypes.
Statistical analysis. Multivariable logistic regression was used to evaluate the association between exposure to different categories of phytoplankton cell count and incidence of reported illness. The outcome was a binary indicator for each health end point as defined in Table 1. Each outcome was modeled sepa-rately. Each analysis excluded participants who reported having the outcome of interest in the 3 days before their beach visit.
Phytoplankton cell count was categorized as high (≥ 75th percentile), medium (> 25th to < 75th percentile), and low (≤ 25th percen-tile). The lowest category served as the referent in the regression models. Cell counts were
Figure 1. Water sampling sites at Boquerón Beach.
Puerto Rico
Boquerón Beach
Waist-depth sampling sites
Boquerón Beach
0 0.25 0.5 1 Miles
Boquerón Bay
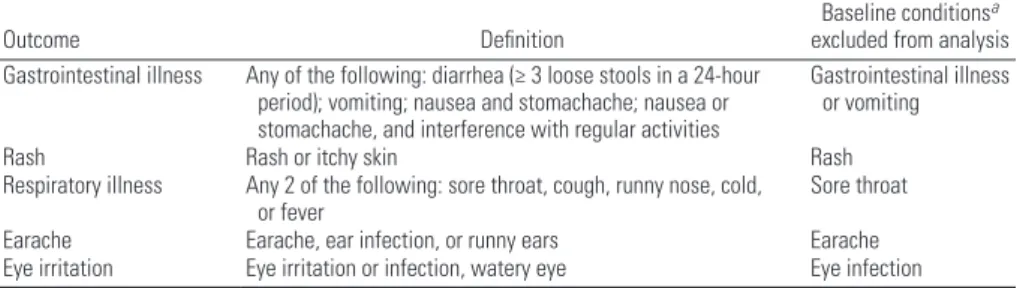
Table 1. Definitions and exclusion criteria for outcomes that occurred during the 10- to 12-day period between the beach visit and the follow-up telephone interview.
Outcome Definition Baseline conditions
a excluded from analysis Gastrointestinal illness Any of the following: diarrhea (≥ 3 loose stools in a 24-hour
period); vomiting; nausea and stomachache; nausea or stomachache, and interference with regular activities
Gastrointestinal illness or vomiting
Rash Rash or itchy skin Rash
Respiratory illness Any 2 of the following: sore throat, cough, runny nose, cold,
or fever Sore throat
Earache Earache, ear infection, or runny ears Earache
Eye irritation Eye irritation or infection, watery eye Eye infection
considered in total and by phytoplankton group (e.g., Bacillariophyta, Cyanobacteria, Dinophyta). Picocyanophytes, a subgroup of Cyanobacteria, were examined separately from the Cyanobacteria group because they occurred at an order of magnitude higher than the other groups. To focus on those with recreational water contact, only partici-pants who reported body immersion were included in models of the association between phytoplankton concentration and illness.
Covariates based on information from previous studies were considered for inclusion in the final model. Using frequency tables and chi-square tests, we identified factors associated with illness and/or water exposure to potential phytoplankton. These factors included age, sex, any other chronic illnesses, self-reported contact with algae, Enterococcus count, and digging in sand. After adjusting for different combinations of covariates, the association between phytoplankton exposure and incidence of reported illness varied by less than 0.1. The final model (adjusting for
age and sex) was based on minimizing the Akaike information criterion (AIC) in order to balance model parsimony and fit. In sensi-tivity analyses, we considered other defini-tions of water exposure: head immersion and swallowing water. Duration of time spent in the water was evaluated as a potential effect measure modifier in stratified analyses.
Results
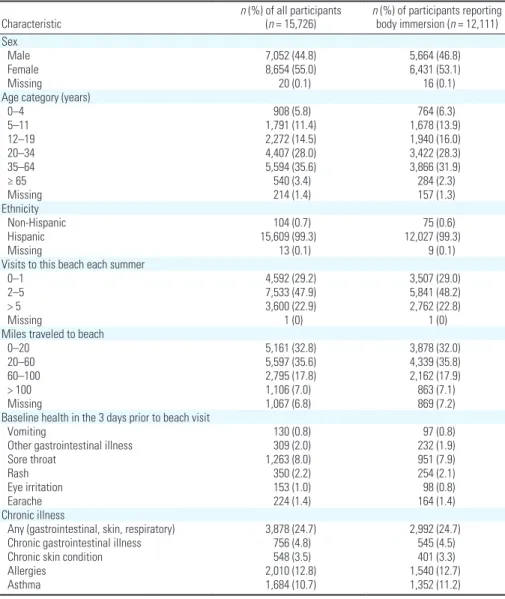
Respondent characteristics and demo-graphics. During the 26 study days, we included 15,726 individuals from 6,611 households. This represented 76% of the households initially approached and 96% of those completing the beach interview. There were slightly more female participants (55%), and nearly all (> 99%) participants self-identified as Hispanic. The average age was 30 years (range: < 1 to 92 years); children < 12 comprised < 20% of the study popu-lation. Approximately one quarter of all participants reported having a chronic illness: 13% reported having allergies, 11% reported
having asthma, 5% reported having a chronic GI illness, and 3% reported having a chronic skin condition. Women reported more chronic illnesses, specifically chronic GI illness (6% women; 3% men; χ2 p-value < 0.0001) and allergies (14% women; 11% men; χ2 p-value = 0.0004). Age categories (0–4 years; 5–11 years; 12–19 years; 20–34 years; 35–64 years; ≥ 65 years) revealed differences in chronic illness (χ2 p-value = 0.0002); chronic GI illness increased with age, reports of allergies were infrequent among the youngest participants (0–4 years), and reports of asthma were most frequent among children < 12 years of age. Participants were excluded from analyses if they reported having the illness being evaluated in the 3 days before their beach visit. At enrollment, 8% of partici-pants reported having a sore throat, and < 3% reported vomiting, other GI illness, rash, eye irritation, or earache in the previous 3 days. Table 2 summarizes the basic characteristics for all study participants and for those who reported body immersion in the water.
Beach visit activities. Upon leaving the beach, 77% of all participants reported body immersion in the water, 64% reported head immersion, and 36% reported getting water in their mouths. Table 3 summarizes a sample of activities that participants reported engaging in at the beach. We analyzed the 12,111 partici-pants (77%) who reported at least immersing their bodies in the water to improve the accuracy of exposure classification based on cell counts. As part of a sensitivity analysis, more substantial exposures were considered, including those who reported swallowing water as a marker of extreme exposure (n = 5,615). Among participants with body immersion, the mean duration spent in the water was just > 2 hr. One quarter of all participants spent ≥ 3 hr in the water, and the maximum time spent in the water was 8 hr.
Illness after beach visit. During the 10- to 12-day period between the beach visit and the follow-up telephone interview, respiratory illness was most commonly reported, with an overall incidence of 7%. The incidence was
Table 2. Characteristics of study population by level of water contact.
Characteristic n (%) of all participants (n = 15,726) nbody immersion ( (%) of participants reporting n = 12,111) Sex
Male 7,052 (44.8) 5,664 (46.8)
Female 8,654 (55.0) 6,431 (53.1)
Missing 20 (0.1) 16 (0.1)
Age category (years)
0–4 908 (5.8) 764 (6.3)
5–11 1,791 (11.4) 1,678 (13.9)
12–19 2,272 (14.5) 1,940 (16.0)
20–34 4,407 (28.0) 3,422 (28.3)
35–64 5,594 (35.6) 3,866 (31.9)
≥ 65 540 (3.4) 284 (2.3)
Missing 214 (1.4) 157 (1.3)
Ethnicity
Non-Hispanic 104 (0.7) 75 (0.6)
Hispanic 15,609 (99.3) 12,027 (99.3)
Missing 13 (0.1) 9 (0.1)
Visits to this beach each summer
0–1 4,592 (29.2) 3,507 (29.0)
2–5 7,533 (47.9) 5,841 (48.2)
> 5 3,600 (22.9) 2,762 (22.8)
Missing 1 (0) 1 (0)
Miles traveled to beach
0–20 5,161 (32.8) 3,878 (32.0)
20–60 5,597 (35.6) 4,339 (35.8)
60–100 2,795 (17.8) 2,162 (17.9)
> 100 1,106 (7.0) 863 (7.1)
Missing 1,067 (6.8) 869 (7.2)
Baseline health in the 3 days prior to beach visit
Vomiting 130 (0.8) 97 (0.8)
Other gastrointestinal illness 309 (2.0) 232 (1.9)
Sore throat 1,263 (8.0) 951 (7.9)
Rash 350 (2.2) 254 (2.1)
Eye irritation 153 (1.0) 98 (0.8)
Earache 224 (1.4) 164 (1.4)
Chronic illness
Any (gastrointestinal, skin, respiratory) 3,878 (24.7) 2,992 (24.7)
Chronic gastrointestinal illness 756 (4.8) 545 (4.5)
Chronic skin condition 548 (3.5) 401 (3.3)
Allergies 2,010 (12.8) 1,540 (12.7)
Asthma 1,684 (10.7) 1,352 (11.2)
Table 3. Activities reported at the beach exit interview.
Activity n (%)
All 15,726 (100)
No water contact 2,995 (19.0)
Total time spent in water
< 60 min 5,547 (35.3)
60 to < 120 min 3,445 (21.9) 120 to < 180 min 2,835 (18.0)
≥ 180 min 3,892 (24.7)
Body immersion 12,111 (77.0)
Head immersion 10,074 (64.1)
Water in mouth 5,615 (35.7)
Played with algae/seaweed 2,499 (15.9) Any contact with unknown animals 646 (4.1)
5% for GI illness, 5% for rash, 3% for eye irritation, and 2% for earache.
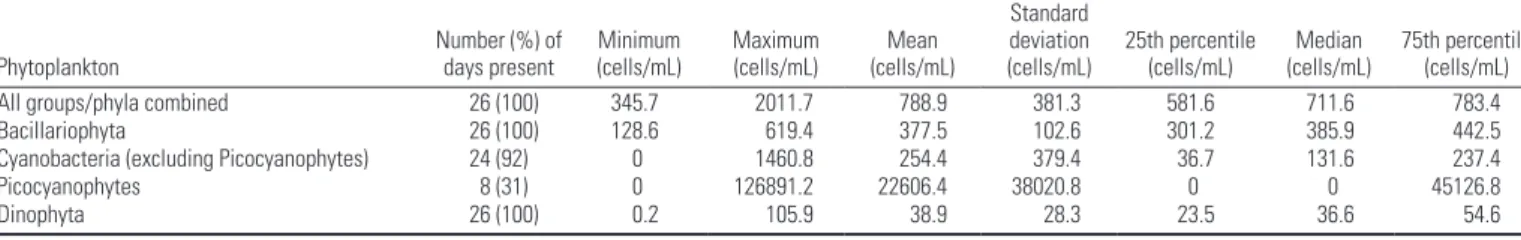
Water quality. During the 26 study days, the median phytoplankton cell count was 712 cells/mL per day (range, 346–2,012 cells/mL). Of all groups identi-fied, Bacillariophyta had the highest median (386 cells/mL per day). Cyanobacteria (excluding Picocyanophytes) had a median of 132 cells/mL per day. Picocyanophytes were only detected on 8 days but achieved a maximum count of 126,891 cells/mL. Dinophyta had a low median (37 cells/mL per day). Samples below the limit of detec-tion (< 0.2 cells/mL) were assigned a value of 0 for calculating phytoplankton distribu-tions. Table 4 summarizes the phytoplankton distribution over the study period.
Other phytoplankton groups were detected on < 8 study days at very low cell counts. These groups included Haptophyta (mean = 8.6 cells/mL), Chrysophyta (mean = 2.8 cells/mL), Rhodophyta (mean = 0.7 cells/mL), Euglenophyta (mean = 0.2 cells/mL), and Chlorophyta (mean = 0.1 cells/mL). See Appendix 1 for a list of the genera and morphotypes that were identified and their distribution according
to phytoplankton group. Concentrations of lyngbyatoxin-a and debromoaplysiatoxin were below the limit of detection of 1.0 ppb in every sample.
Enterococcus colony forming units (CFU) and phytoplankton counts were not corre-lated (Spearman’s r = –0.14, p-value = 0.5). As previously reported by Wade et al. (2010b), low to moderate levels of fecal indicator bacteria were detected at Boquerón Beach, and the geometric means of the daily samples collected were all below the U.S. Environmental Protection Agency (EPA) guideline value of 35 CFU per 100 mL (Wade et al. 2010b). Spearman’s correlations between total phytoplankton counts and different environmental factors (e.g., wind speed and direction, air temperature, water temperature, turbidity) were all < 0.3 (data not shown).
Phytoplankton count and incident illness.
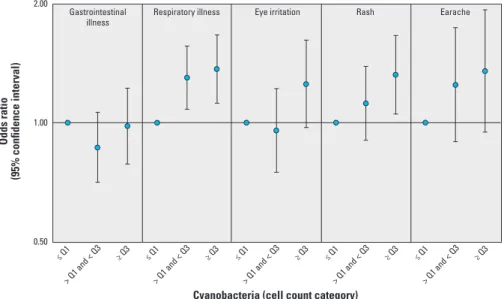
Among beachgoers who reported body immersion, the highest category of total phytoplankton cell count (≥ 75th percentile) was associated with eye irritation [adjusted odds ratio (OR) = 1.30; 95% confidence interval (CI): 1.01, 1.66], rash (OR = 1.27; 95% CI: 1.02, 1.57), and earache (OR = 1.25; 95% CI: 0.88, 1.77) (Table 5). Cyanobacteria
cell counts were associated with respiratory illness, eye irritation, rash, and earache. These associations, although not all statistically significant at α = 0.05, strengthened with increasing Cyanobacteria cell count categories (Figure 2). In particular, respiratory illness, rash, and earache all had associations that increased relatively monotonically with each Cyanobacteria cell count category. Respiratory illness had the strongest association with all Cyanobacteria cell count categories. Table 5 shows the associations between phytoplankton group cell count and incident illness among beachgoers who reported body immersion.
Picocyanophytes were not associated with any subsequent illness among partici-pants who reported body immersion in the water (Table 5). However, among those who reported swallowing water (n = 5,615), the presence of Picocyanophytes was significantly associated with earache (OR = 1.62; 95% CI: 1.14, 2.30), which was reported by 3.3% (n = 56) of those exposed and 2.1% (n = 83) of those unexposed. Similarly, among partici-pants who reported swallowing water, the highest category of Cyanobacteria cell count was associated with earache (OR = 1.75; 95% CI: 1.09, 2.82), which was reported by
Table 4. Phytoplankton distribution over 26 days.
Phytoplankton Number (%) of days present Minimum (cells/mL) Maximum (cells/mL) (cells/mL)Mean
Standard deviation
(cells/mL) 25th percentile (cells/mL) (cells/mL)Median 75th percentile (cells/mL)
All groups/phyla combined 26 (100) 345.7 2011.7 788.9 381.3 581.6 711.6 783.4
Bacillariophyta 26 (100) 128.6 619.4 377.5 102.6 301.2 385.9 442.5
Cyanobacteria (excluding Picocyanophytes) 24 (92) 0 1460.8 254.4 379.4 36.7 131.6 237.4
Picocyanophytes 8 (31) 0 126891.2 22606.4 38020.8 0 0 45126.8
Dinophyta 26 (100) 0.2 105.9 38.9 28.3 23.5 36.6 54.6
Samples below the limit of detection (< 0.2 cells/mL) were assigned a value of 0.
Table 5. Associations between phytoplankton cell counts and incident illness occurring during the 10- to 12-day period between the beach visit and the follow-up telephone interview among beachgoers who reported body immersion in water.
Phytoplankton group
Gastrointestinal illness
(n = 11,832) Respiratory illness (n = 11,160) Eye irritation (n = 12,013) (n = 11,857)Rash (n Earache = 11,947) Cases (%) OR (95% CI) Cases (%) OR (95% CI) Cases (%) OR (95% CI) Cases (%) OR (95% CI) Cases (%) OR (95% CI) All groups combined
≤ Q1 174 (5.0) 1 227 (6.9) 1 114 (3.2) 1 156 (4.5) 1 57 (1.6) 1
> Q1 to < Q3 211 (4.5) 0.91 (0.74, 1.12) 315 (7.1) 1.03 (0.86, 1.23) 144 (3.0) 0.93 (0.72, 1.19) 199 (4.2) 0.95 (0.77, 1.18) 96 (2.0) 1.25 (0.90, 1.74) ≥ Q3 178 (4.9) 1.00 (0.80, 1.24) 244 (7.1) 1.02 (0.85, 1.24) 155 (4.2) 1.30 (1.01, 1.66) 206 (5.6) 1.27 (1.02, 1.57) 76 (2.1) 1.25 (0.88, 1.77) Bacillariophyta
≤ Q1 142 (4.4) 1 189 (6.1) 1 110 (3.3) 1 170 (5.2) 1 54 (1.6) 1
> Q1 to < Q3 281 (5.0) 1.13 (0.92, 1.39) 405 (7.7) 1.28 (1.07, 1.54) 223 (3.9) 1.18 (0.94, 1.49) 279 (5.0) 0.97 (0.80, 1.18) 118 (2.1) 1.29 (0.93, 1.79) ≥ Q3 140 (4.7) 1.06 (0.83, 1.35) 192 (6.8) 1.10 (0.89, 1.35) 80 (2.7) 0.78 (0.58, 1.05) 112 (3.8) 0.73 (0.57, 0.94) 57 (1.9) 1.15 (0.79, 1.68) Cyanobacteria
≤ Q1 173 (5.0) 1 187 (5.8) 1 114 (3.3) 1 144 (4.2) 1 55 (1.6) 1
> Q1 to < Q3 226 (4.4) 0.87 (0.71, 1.06) 354 (7.4) 1.30 (1.08, 1.56) 161 (3.1) 0.96 (0.75, 1.22) 236 (4.6) 1.12 (0.90, 1.39) 101 (2.0) 1.25 (0.89, 1.74) ≥ Q3 164 (5.0) 0.98 (0.79, 1.22) 245 (7.8) 1.37 (1.12, 1.67) 138 (4.1) 1.25 (0.97, 1.62) 181 (5.5) 1.32 (1.05, 1.66) 73 (2.2) 1.35 (0.95, 1.93) Picocyanophytes
None 397 (4.8) 1 527 (6.7) 1 281 (3.3) 1 407 (4.9) 1 155 (1.8) 1
Any 166 (4.7) 0.96 (0.80, 1.16) 259 (7.8) 1.13 (0.97, 1.32) 132 (3.7) 1.10 (0.89, 1.36) 154 (4.3) 0.90 (0.74, 1.09) 74 (2.1) 1.11 (0.83, 1.47) Dinophyta
≤ Q1 128 (4.5) 1 192 (7.2) 1 96 (3.3) 1 151 (5.3) 1 64 (2.2) 1
3.2% (n = 52) of those exposed to the highest category and 1.8% (n = 29) of those exposed to the lowest category.
As shown in Table 5, the medium category of Bacillariophyta was associated with respiratory illness (OR = 1.28; 95% CI 1.07, 1.54); however, the odds ratio did not increase for the highest category (OR = 1.10; 95% CI: 0.89, 1.35). Exposure to Dinophyta was not associated with any illness.
To assess potential effect measure modi-fication by the length of time spent in water, we conducted analyses stratified by number of hours spent in the water (< 1 hr, 1 to < 2 hr, 2 to < 3 hr, ≥ 3 hr). We also restricted our analysis to other categories of water exposure (head immersion, swallowing water). The results were similar in the stratified analyses, with the exception of a stronger earache associ-ation with Cyanobacteria and Picocyanophytes after restricting to participants who reported swallowing water (data not shown).
Discussion
We report the results of a prospective evalu-ation of the health effects associated with recreational water exposure to marine phyto-plankton in the absence of a harmful algal bloom. Given the popularity of visiting beaches (Leeworthy et al. 2005) and the apparent increase in harmful algal blooms around the world (Sellner et al. 2003), we sought to better understand the effects of marine phytoplankton on human health. We found an association between total phyto-plankton cell count and incident illness: specifically, eye irritation and rash. These outcomes have also been associated with freshwater blooms (Billings 1981; Pilotto et al. 1997; Rapala et al. 2005; Walker et al. 2008).
Our study design established a temporal sequence between exposure and outcome. By having interviews performed at different time points, participants did not have to wait a long time to recall their experiences, and their exposure response could not be influenced by any subsequent illness. The high participation rate (> 75%) reduced the possibility of selec-tion bias. After considering a range of poten-tial confounders, we only adjusted for age (as a continuous variable) and sex in order to balance model parsimony and fit. Because our final model produced similar results to those of the full model (adjusting for age, sex, any other chronic illnesses, self-reported contact with algae, Enterococcus count, and digging in sand), there did not appear to be a major bias due to confounding (data not shown).
Our study design allowed one adult to answer questions for all other household members at the beach. Although there was a possibility for responder bias or misinforma-tion, there was an average of only 3.2 indi-viduals per household, and other household
members often assisted with the questionnaire responses. A limitation of our self-reported outcome data was a lack of specific details about some of the illnesses. Therefore, it was difficult to confirm the etiology of the illness on the basis of the participant responses alone. For example, we could not necessarily distinguish among rashes as being associated with cnidarians, sea lice, cercariae, salt water itself, or even something completely unrelated to the beach visit.
Cyanobacteria concentration was asso-ciated with all illnesses except GI illness; the odds of illness increased with cell count category. Our findings were consistent with reports of skin and eye irritations associated with Lyngbya majuscula blooms (Osborne et al. 2007; Osborne and Shaw 2008). Despite these similar illnesses, the Lyngbya-associated toxins, debromoaplysia toxin and lyngbyatoxin-a, were below the limit of detection in all samples, and Lyngbya comprised only 3% of total planktonic Cyanobacteria among samples (see Appendix 1). Debromoaplysiatoxin and lyngbyatoxin-a are photolabile and are unlikely to persist in the water column (Moikeha et al. 1971). It is possible that people had contact with toxins or toxic material in the water or on the ocean floor because we did not sample the seabed or measure other cyanotoxins potentially associated with Cyanobacteria.
Unlike previous epidemiologic studies of freshwater cyanobacterial blooms (Lévesque et al. 2014; Pilotto et al. 1997), GI illness was the only illness that did not appear to be associated with marine Cyanobacteria in the absence of blooms, even when we restricted the analysis to participants who reported swal-lowing water. Although the lack of association with GI illness may have been because of low Cyanobacteria cell counts, health effects may
also differ after exposure to communities of Cyanobacteria in fresh and marine waters. The maximum Cyanobacteria cell count (excluding Picocyanophytes) was 1460.8 cells/mL. In epidemiologic studies conducted at freshwater sites, illnesses were associated with cyanobac-terial counts > 5,000 cells/mL (Pilotto et al. 1997) and at counts < 20,000 cells/mL relative to no water contact (Lévesque et al. 2014). More work is needed to define Cyanobacteria concentrations that are safe for human health in marine waters.
We analyzed Picocyanophytes separately because of the different orders of magnitude of the cell counts. Although most of the cyano bacteria literature describes marine picoplankton as nontoxic, there are some reports of toxic effects caused by homog-enized Synechococcus and Synechocystis and their extracts (Martins et al. 2005, 2007; Walsh et al. 2008). Microcystins have been shown to cause adverse health effects (Codd et al. 1999; Falconer 1999; Giannuzzi et al. 2011), and a study of Synechococcus strains suggested that some marine picoplankton may be capable of synthesizing microcystins (Carmichael and Li 2006).
We observed an association between earache and Cyanobacteria among those who reported swallowing water. This finding is consistent with the positive but nonsignificant association we estimated among all those who immersed themselves in water. In the context of earache, we hypothesize that the stronger association, when restricted to those who swallowed water, may reflect more frequent head immersion and more intense exposure overall rather than being a direct consequence of swallowing water. Earache has been asso-ciated with swimming, especially when the head is immersed (Wade et al. 2013). The
Figure 2. Associations between Cyanobacteria cell count and illness among beachgoers who reported body immersion in water. Models adjusted for age (as a continuous variable) and sex. Q1 = 25th percentile; Q3 = 75th percentile.
2.00
1.00
0.50
Gastrointestinal
illness Respiratory illness Eye irritation
Odds ratio
(95% confidence interval)
Rash Earache
≤ Q1 ≥ Q3
> Q1 and < Q3
≤ Q1 ≥ Q3
> Q1 and < Q3
≤ Q1 ≥ Q3
> Q1 and < Q3
≤ Q1 ≥ Q3
> Q1 and < Q3
≤ Q1 ≥ Q3
presence of any Picocyanophytes (vs. none detected) was associated with earache among participants who reported swallowing water. To our knowledge, this association has not been previously reported.
Associations with specific outcomes varied among other phytoplankton groups. Bacillariophyta cell counts in the 25th to 75th percentile range, but not counts above the 75th percentile, were significantly associ-ated with respiratory illness when compared with counts below the 25th percentile. To our knowledge, Bacillariophyta have not been associated with respiratory illness in previous studies. Previous studies of marine diatoms, such as those of the genus Pseudo-nitzschia that produce domoic acid, have focused on adverse outcomes occurring after ingestion of contaminated shellfish rather than on recre-ational water exposure (Van Dolah 2000).
Because phytoplankton cell counts were low, we cannot be confident that associations
with health outcomes were a result of phyto-plankton exposure alone, or if phytophyto-plankton were markers for other unmeasured caus-ative factors, such as potentially pathogenic microbes or physical-chemical conditions associated with marine phytoplankton. In addition, we are unable to rule out noncausal mechanisms related to chance or bias (e.g., uncontrolled confounding, selection bias, information bias). Although phytoplankton may provide nutrients and substrates for the survival of microbial communities, there is limited knowledge on the occurrence of phytoplankton-associated pathogens (Brettar et al. 2007; Maugeri et al. 2004).
We categorized cell count a priori as high (≥ 75th percentile), medium (> 25th to < 75th percentile), and low (≤ 25th percen-tile) because health guidelines for concentra-tions of marine phytoplankton have yet to be established. As a result, it is possible that the highest cell count category was actually
below any level that could cause potential adverse health effects. For example, although we did not find an association of illness with Dinophyta, maximum cell counts for Dinophyta were only 105.9 cells/mL. In contrast, epidemiologic studies of the marine dinoflagellate, K. brevis, and associated respiratory illness measured maximum cell counts ranging from 8,120 cells/mL (Backer et al. 2003) to 121,000 cells/mL (Backer et al. 2005).
We reported cell counts per milliliter of water so that our findings could be compared with those of previous studies and the WHO guidelines for freshwater exposures (Bartram and Chorus 1999). A limitation of our phyto-plankton assessment was that we had no information on cell size to calculate biomass concentrations. Cell size can influence total phytoplankton exposure. For example, a few large cells of one species may contribute more to the overall biomass than many small cells of a different species (Hillebrand et al. 1999).
Finally, our study participants spent a large amount of time in the water; half of them spent ≥ 2 hr in the water. It is possible that we observed associations between health outcomes and low phytoplankton counts, in the absence of active phytoplankton blooms, because the participants spent so much time in the water. However, the associations did not vary significantly when stratified by total time in the water (data not shown).
Our results offer insight into the potential health effects of marine phytoplankton in the absence of a harmful algal bloom. Although some associations could be due to chance or bias, most seem plausible based on the existing literature. The evaluation of health effects asso-ciated with recreational exposure to marine phytoplankton at sub-bloom concentrations warrants further investigation.
Conclusions
We found associations between recreational exposure to marine phytoplankton and subse-quent reports of eye irritation, respiratory illness, earache, and rash at a tropical beach in the absence of an algal bloom. In addition, we found that associations varied by phyto-plankton group, with Cyanobacteria having the strongest associations with most of the outcomes assessed.
RefeRences
American Public Health Association. 1998. 10200F. Phytoplankton counting techniques. “Inverted microscope counts.” In: Standard Methods for the Examination of Water and Wastewater (Clesceri LS, Greenberg AE, Eaton AD, eds). 20th ed. Washington, DC:American Public Health Association, American Water Works Association, Water Pollution Control Federation.
Backer LC, Fleming LE, Rowan A, Cheng YS, Benson J,
Appendix 1: Genera/morphotypes by phytoplankton group
(percentage within each group)
Bacillariophyta (69% of total phytoplankton)
Pennate diatom (37); Nitzschia (12); Navicula (7); Licmophora (5); Bacillaria (4); Cylindrotheca/Nitzschia (4); Amphiprora (4); Psammodictyon (4); Chaetoceros (3); Centric diatom (3); Diploneis (2); Amphora (2); Rhizosolenia (2); Amphiprora/ Plagiotropis (1); Actinocyclus/Coscinodiscus (1); Proboscia (1); Skeletonema (1); Cocconeis (1); Gyrosigma/Pleurosigma (1); Actinoptychus (1); Bacteriastrum (1); Diatom (1); Paralia (1); Achnanthes (< 1); Plagiotropis (< 1); Pseudo-nitzschia (< 1); Triceratium (< 1); Attheya (< 1); Guinardia (< 1); Gyrosigma (< 1); Odontella (< 1); Peralia (< 1); Tropidoneis (< 1)
Dinophyta (13% of total phytoplankton)
Dinoflagellate (67); Gonyaulax (16); Ceratium (7); Prorocentrum (7); Amphidinium (1); Dinophysis (1); Protoperidinium (1)
Cyanobacteria (9% of total phytoplankton)
Cyanophyte filament (32); Pseudanabaena (26); Picocyanophyte (10); Synechococcus (5); Synechocystis (5); Cyanophyte cell pair (5); Phormidium (4); Lyngbya (3); Trichodesmium (3); Aphanothece (1); Johannesbaptistia (1); Komvophoron (1); Cyanophyte colony (1); Cyanophyte unicell, sphere 2.5–5 μm (1)
Miscellaneous (8% of total phytoplankton)
Unknown flagellate (29); Unicell, sphere 2.5–5 μm (26); Unicell, oval 2.5–5 μm (14); Unknown unicell (11); Unicell, oval 5–7.5 μm (10); Microflagellate (4); Unicell, oval/rod 2.5–5 μm (3); Unicell, sphere 5–7.5 μm (1); Unknown filament (1)
Haptophyta (0.8% of total phytoplankton)
Haptophyte flagellate (100)
Euglenophyta (0.6% of total phytoplankton)
Euglenophyte (80) Euglena/Eutreptiella (20)
Chrysophyta (0.2% of total phytoplankton)
Chrysophyte flagellate (100)
Rhodophyta (0.2% of total phytoplankton)
Rhodophyte filament (100)
Chlorophyta (0.1% of total phytoplankton)
Pierce RH, et al. 2003. Recreational exposure to aerosolized brevetoxins during Florida red tide events. Harmful Algae 2:19–28.
Backer LC, Kirkpatrick B, Fleming LE, Cheng YS, Pierce R, Bean JA, et al. 2005. Occupational exposure to aerosolized brevetoxins during Florida red tide events: effects on a healthy worker population. Environ Health Perspect 113:644–649, doi:10.1289/ehp.7502.
Bartram J, Chorus I. 1999. Toxic Cyanobacteria in Water: A Guide to their Public Health Consequences, Monitoring, and Management. New York:E & FN Spon.
Billings WH. 1981. Water-associated human illness in northeast Pennsylvania and its suspected associ-ation with blue-green algae blooms. In: The Water Environment: Algal Toxins and Health, Vol. 20 (Carmichael WW, ed). New York:Plenum, 243–255. Brettar I, Guzman CA, Höfle MG. 2007. Human
patho-gens in the marine environment - an ecological perspective. In: CIESM Workshop Monographs No. 31: Marine Sciences and Public Health. Geneva:CIESM, 59–68.
Burch MD. 2008. Effective doses, guidelines & regula-tions. Adv Exp Med Biol 619:831–853.
Carmichael WW, Li R. 2006. Cyanobacteria toxins in the Salton Sea. Saline Systems 2:5, doi:10.1186/1746-1448-2-5.
Codd G, Bell S, Kaya K, Ward C, Beattie K, Metcalf J. 1999. Cyanobacterial toxins, exposure routes and human health. Eur J Phycol 34:405–415.
Colford JM Jr, Wade TJ, Schiff KC, Wright CC, Griffith JF, Sandhu SK, et al. 2007. Water quality indicators and the risk of illness at beaches with nonpoint sources of fecal contamination. Epidemiology 18:27–35.
Dale B, Edwards M, Reid PC. 2006. Climate change and harmful algal blooms. In: Ecology of Harmful Algae, Vol. 189 (Granéli E, Turner JT, eds). Berlin, Germany:Springer, 367–378.
Dyble J, Bienfang P, Dusek E, Hitchcock G, Holland F, Laws E, et al. 2008. Environmental controls, ocean-ography and population dynamics of pathogens and harmful algal blooms: connecting sources to human exposure. Environ Health 7(suppl 2):S5, doi:10.1186/1476-069X-7-S2-S5.
Dziuban EJ, Liang JL, Craun GF, Hill V, Yu PA, Painter J, et al. 2006. Surveillance for waterborne disease and outbreaks associated with recre-ational water—United States, 2003–2004. MMWR Surveill Summ 55:1–30.
Falconer IR. 1999. An overview of problems caused by toxic blue–green algae (cyanobacteria) in drinking and recreational water. Environ Toxicol 14:5–12. Giannuzzi L, Sedan D, Echenique R, Andrinolo D. 2011.
An acute case of intoxication with cyanobacteria and cyanotoxins in recreational water in Salto Grande Dam, Argentina. Mar Drugs 9:2164–2175. Gingold DB, Strickland MJ, Hess JJ. 2014. Ciguatera
fish poisoning and climate change: analysis of National Poison Center data in the United States, 2001–2011. Environ Health Perspect 122:580–586, doi:10.1289/ehp.1307196.
Hilborn ED, Roberts VA, Backer L, DeConno E, E g a n J S , H y d e J B , e t a l . 2 0 1 4 . A l g a l bloom- associated disease outbreaks among users of freshwater lakes—United States, 2009–2010. MMWR Morb Mortal Wkly Rep 63:11–15. Hillebrand H, Dürselen CD, Kirschtel D, Pollingher U,
Zohary T. 1999. Biovolume calculation for pelagic and benthic microalgae. J Phycol 35:403–424. Hlavsa MC, Roberts VA, Anderson AR, Hill VR,
Kahler AM, Orr M, et al. 2011. Surveillance for waterborne disease outbreaks and other health events associated with recreational water—United States, 2007–2008. MMWR Surveill Summ 60:1–32. Kirkpatrick B, Bean JA, Fleming LE, Kirkpatrick G,
Grief L, Nierenberg K, et al. 2010. Gastrointestinal emergency room admissions and Florida red tide blooms. Harmful Algae 9:82–86.
Leeworthy VR, Bowker JM, Hospital JD, Stone EA. 2005. Projected Participation In Marine Recreation: 2005 & 2010. Silver Spring, MD:U.S. Department of Commerce, National Oceanic and Atmospheric Administration, National Ocean Service, Special Projects.
Lévesque B, Gervais MC, Chevalier P, Gauvin D, Anassour-Laouan-Sidi E, Gingras S, et al. 2014. Prospective study of acute health effects in relation to exposure to cyanobacteria. Sci Total Environ 466–467:397–403.
Martins R, Fernandez N, Beiras R, Vasconcelos V. 2007. Toxicity assessment of crude and partially purified extracts of marine Synechocystis and
Synechococcus cyanobacterial strains in marine invertebrates. Toxicon 50:791–799.
Martins R, Pereira P, Welker M, Fastner J, Vasconcelos VM. 2005. Toxicity of cultur-able cyanobacteria strains isolated from the Portuguese coast. Toxicon 46:454–464.
Masó M, Garcés E. 2006. Harmful microalgae blooms (HAB); problematic and conditions that induce them. Mar Pollut Bull 53:620–630.
Maugeri TL, Carbone M, Fera MT, Irrera GP, Gugliandolo C. 2004. Distribution of potentially pathogenic bacteria as free living and plankton associated in a marine coastal zone. J Appl Microbiol 97:354–361.
Moikeha SN, Chu GW, Berger LR. 1971. Dermatitis-producing alga Lyngbya-majuscula Gomont in Hawaii. 1. Isolation and chemical characterization of toxic factor. J Phycol 7:4–8.
Moore SK, Trainer VL, Mantua NJ, Parker MS, Laws EA, Backer LC, et al. 2008. Impacts of climate variability and future climate change on harmful algal blooms and human health. Environ Health 7(suppl 2):S4, doi:10.1186/1476-069X-7-S2-S4. Nagai H, Yasumoto T, Hokama Y. 1996. Aplysiatoxin
and debromoaplysiatoxin as the causative agents of a red alga Gracilaria coronopifolia poisoning in Hawaii. Toxicon 34:753–761.
Osborne N, Seawright A, Shaw G. 2008. Dermal toxi-cology of Lyngbya majuscula, from Moreton Bay, Queensland, Australia. Harmful Algae 7:584–589. Osborne NJ, Shaw GR. 2008. Dermatitis associated
with exposure to a marine cyanobacterium during recreational water exposure. BMC Dermatol 8:5, doi:10.1186/1471-5945-8-5.
Osborne NJ, Shaw GR, Webb PM. 2007. Health effects of recreational exposure to Moreton Bay, Australia waters during a Lyngbya majuscula
bloom. Environ Int 33:309–314.
Osborne NJ, Webb PM, Shaw GR. 2001. The toxins of
Lyngbya majuscula and their human and ecolog-ical health effects. Environ Int 27:381–392. Paerl HW, Fulton RS III, Moisander PH, Dyble J. 2001.
Harmful freshwater algal blooms, with an emphasis on cyanobacteria. ScientificWorldJournal 1:76–113.
Paerl HW, Huisman J. 2008. Climate. Blooms like it hot. Science 320:57–58.
Paerl HW, Huisman J. 2009. Climate change: a catalyst for global expansion of harmful cyanobacterial blooms. Environ Microbiol Rep 1:27–37.
Peperzak L. 2005. Future increase in harmful algal blooms in the North Sea due to climate change. Water Sci Technol 51:31–36.
Pilotto LS, Douglas RM, Burch MD, Cameron S, Beers M, Rouch GJ, et al. 1997. Health effects of exposure to cyanobacteria (blue-green algae) during recreational water-related activities. Aust NZ J Public Health 21:562–566.
Prüss A. 1998. Review of epidemiological studies on health effects from exposure to recreational water. Int J Epidemiol 27:1–9.
Rapala J, Robertson A, Negri AP, Berg KA, Tuomi P, Lyra C, et al. 2005. First report of saxitoxin in Finnish lakes and possible associated effects on human health. Environ Toxicol 20:331–340. Sellner KG, Doucette GJ, Kirkpatrick GJ. 2003. Harmful
algal blooms: causes, impacts and detection. J Ind Microbiol Biotechnol 30:383–406.
Smayda TJ. 1997. Harmful algal blooms: their ecophys-iology and general relevance to phytoplankton blooms in the sea. Limnol Oceanogr 42:1137–1153. Smayda TJ, Reynolds CS. 2003. Strategies of marine
dinoflagellate survival and some rules of assembly. J Sea Res 49:95–106.
Van Dolah FM. 2000. Marine algal toxins: origins, health effects, and their increased occurrence. Environ Health Perspect 108(suppl 1):133–141. Wade TJ, Sams EA, Beach MJ, Collier SA, Dufour AP.
2013. The incidence and health burden of earaches attributable to recreational swimming in natural waters: a prospective cohort study. Environ Health 12:67, doi:10.1186/1476-069X-12-67. Wade TJ, Sams EA, Brenner KP, Haugland R,
Chern E, Beach M, et al. 2010a. Rapidly measured indicators of recreational water quality and swimming-associated illness at marine beaches: a prospective cohort study. Environ Health 9:66, doi:10.1186/1476-069X-9-66.
Wade TJ, Sams EA, Haugland R, Brenner KP, Li Q, Wymer L, et al. 2010b. Report on 2009 National Epidemiologic and Environmental Assessment of Recreational Water Epidemiology Studies. EPA/600/R-10/168. U.S. Environmental Protection Agency, Office of Research and Development. Walker SR, Lund JC, Schumacher DG, Brakhage PA,
McManus BC, Miller JD, et al. 2008. Nebraska experience. Adv Exp Med Biol 619:139–152. Walsh PJ, Smith SL, Fleming LE, Solo-Gabriele HM,
Gerwick WH. 2008. Oceans and Human Health: Risks and Remedies from the Seas. Boston, MA:Elsevier/Academic Press.
WHO (World Health Organization). 2003. Algae and cyanobacteria in coastal and estuarine waters. In: Guidelines for Safe Recreational Water Environments. Geneva:WHO, 128–135.
Yoder JS, Blackburn BG, Craun GF, Hill V, Levy DA, Chen N, et al. 2004. Surveillance for waterborne-disease outbreaks associated with recreational water—United States, 2001–2002. MMWR Surveill Summ 53:1–22.