LESSONS FROM CHARTER SCHOOLS: WHAT MAKES A HIGH QUALITY SCHOOL?
Lisa Spees
A dissertation submitted to the faculty of the University of North Carolina at Chapel Hill in partial fulfillment of the requirements for the degree of Doctor of Philosophy in the Department
of Public Policy.
Chapel Hill 2016
© 2016 Lisa Spees
ABSTRACT
Lisa Spees: Lessons from Charter Schools: What Makes a High Quality School? (Under the direction of Krista M. Perreira)
ACKNOWLEDGMENTS
I would like to thank Krista Perreira, my dissertation chair and graduate advisor, for the guidance and mentorship she has provided since the beginning of graduate school. She has given me with the skills and experience I need to be a successful and effective researcher. I also want to thank the rest of my dissertation committee, Dougles Lauen, Steve Hemelt, Sudhanshu Handa, and Ted Mouw for helping me think through my dissertation and writing struggles and for providing encouragement and advice throughout the process of writing my dissertation.
I am also grateful for the support of the Carolina Population Center. Working at the Carolina Population Center (CPC) helped develop my passion for demography, health
disparities, and education inequalities. The personnel at the CPC provided me with invaluable assistance in statistics, technical and IT support, presentation design, etc. I also want to thank my friends and colleagues Stephanie Potochnick, Kathleen Wirth, Yuna Kim, and Evan Johnson for helping me navigate and complete the steps and hurdles one faces as a doctoral student.
TABLE OF CONTENTS
LIST OF TABLES ... vii
LIST OF FIGURES ... viii
CHAPTER 1: INTRODUCTION ...1
Essay One...2
Essay Two ...3
Essay Three ...3
CHAPTER TWO: THE COMPLEXITY OF ESTIMATING ACADEMIC ACHIEVEMENT IN CHARTER SCHOOLS: EVIDENCE FROM NORTH CAROLINA ...5
Introduction ...5
Background ...7
Data and Measures ...12
Methods...14
Results ...18
Discussion ...21
REFERENCES ...24
CHAPTER THREE: THE EFFECT OF CHARTER SCHOOLS ON BEHAVIORAL OUTCOMES: EVIDENCE FROM NORTH CAROLINA ...35
Introduction ...35
Theoretical Considerations ...36
Background ...38
Measures ...42
Methods...43
Results ...46
Discussion ...49
REFERENCES ...52
CHAPTER FOUR: ARE CHARTER SCHOOLS RETAINING EFFECTIVE TEACHERS: EVIDENCE FROM NORTH CAROLINA ...61
Introduction ...61
Background: Charter Schools in North Carolina ...62
Theoretical Considerations ...64
Literature Review...66
Data ...68
Methods...69
Results ...72
Discussion ...73
REFERENCES ...77
APPENDIX A: ADDITIONAL RESULTS FROM CHAPTER TWO ...88
APPENDIX B: ADDITIONAL RESULTS FROM CHAPTER THREE ...89
LIST OF TABLES
Table 2.1 North Carolina School Descriptives (2004-2011) ...30
Table 2.2 Descriptive Statistics of North Carolina Students (Grades 4-8, 2004-2011) ...31
Table 2.3 Descriptive Statistics of Switchers (Grades 4-8, 2004-2011) ...32
Table 2.4 Pooled OLS, Student RE, Student FE Results for Math and Reading Achievement, 2004-2011 ...33
Table 2.5 Non-Linear Multilevel Growth Models, 2004-2011 ...34
Table 3.1 Descriptive Characteristics of Schools in North Carolina (Grades 3-12, 2006-2009) ...58
Table 3.2 North Carolina Students (Grades 3-12, 2006-2009) ...59
Table 3.3 Effect of Attending a Charter School on Absences, Unexcused Absences, and Tardies (Grade 3-12, 2006-2009) ...60
Table 3.4 Effect of Attending a Charter School on Number and Days of In-School and Out-of- School Suspensions (Grade 3-12, 2006-2009) ...61
Table 4.1 North Carolina Elementary School Descriptives ...84
Table 4.2 Teacher Mobility Rates, by Sector (2009-2010) ...85
Table 4.3 Description of 4th and 5th Grade Teachers by Type of Move ...86
Table 4.4 Predicting Teacher Mobility Using Multinomial Logits (Math Sample) ...87
Appendix Table A1: Linear Multilevel Growth Models, 2004-2011 ...88
Appendix Table B1: Effect of Charter Schools by Number of Years Student Enrolled in Charter School using Student FE Model (Grade 3-12, 2006-2009) ...89
Appendix Table C1: Predicting Teacher Mobility using Multinomial Logits (Reading Sample) ...90
LIST OF FIGURES
Figure 2.1 Average Math Test Score Growth, Full Sample ...27
Figure 2.2 Average Reading Test Score Growth, Full Sample ...27
Figure 2.3 Average Math Test Score Growth, TPS only vs. Charter only ...28
Figure 2.4 Average Math Test Score Growth, TPS only and Switched Into Charter ...28
Figure 2.5 Average Math Test Score Growth, TPS only and Switcher out of Charter ...29
Figure 2.6 Average Math Test Score Growth, TPS only and Multiple Switchers...29
Figure 3.1 Charter Schools Coefficients by Number of Years Student Enrolled in Charter School (Grade 3-12, 2006-2009) ...57
Figure 4.1 Percentage of Students in Charter School Membership (2011-2012) ...82
CHAPTER 1: INTRODUCTION
The idea of school choice was developed in the 1950s by economist Milton Friedman. Friedman believed that poor student performance resulted from forcing schools to be democratic institutions. He argued that the government should fund the U.S. school system but not retain control over schools. In other words, the government should abandon the rules and regulations restricting traditional public schools (TPSs). Instead, Friedman proposed that school choice would fix the public school system because it would allow students to attend their chosen school and lead to a variety of new schools. Friedman predicted that vouchers would encourage the development and improvement of schools through market competition. Thus, Friedman claimed, school vouchers would not only increase student achievement but also force complacent and failing public schools to improve. Otherwise, these TPSs would be in danger of losing their best and brightest students. From Friedman’s perspective, school choice could only increase student achievement or, at worst, maintain student achievement levels.
While Milton Friedman developed the idea of school choice, it did not become a popular policy solution until John Chubb’s and Terry Moe’s Politics, Markets, and America’s Schools. This classic study analyzed 1980s educational reforms and concluded that low student
1990, charter schools, a form of school choice, have become an increasingly popular alternative to TPSs.
This dissertation evaluates the differences between charter schools and traditional public schools (TPSs) and how these differences influence teachers and students. The first essay
evaluates student achievement in charter schools and TPSs and suggests that causal claims about the effect of charter schools on student achievement may be unwarranted. In the second essay, I look beyond student achievement and extend my analysis to evaluate whether charter schools are influencing student’s behavioral outcomes. Specifically, I determine whether attending charter schools affects students’ number of absences, tardies, in-school suspensions, and out-of-school suspensions. Interestingly, while the findings on student achievement are complex and show evidence of causal heterogeneity, my results regarding charter schools influence on student behavioral outcomes are more straightforward; overall, attending a charter school is associated with better behavioral outcomes. Finally, the third essay examines whether charter schools are attracting and retaining more effective teachers than traditional public schools. In sum, this three essay dissertation provides valuable information to policymakers and educators on how local and state charter school policies and contexts are influencing teachers and students.
Essay One
Past research shows that North Carolina charter schools have a negative effect on student achievement. Disentangling the effects of charter schools from background student
achievement and a small, positive effect in reading achievement. Lastly, I demonstrate that, using multilevel growth models, charter schools have a positive effect on both math and reading achievement. Finally, examining different subpopulations of charter school students and of switchers demonstrates the prevalence of selection bias in estimating charter school effects. These findings suggest that causal claims about the effects of charter schools on achievement may be undeserved.
Essay Two
While results regarding the effects of charter schools on student achievement have been, overall, inconclusive, little research has examined the effects of charter schools on behavioral outcomes despite their importance in determining students’ future success. This study examines whether charter schools influence students’ behavioral outcomes and uses data from 2006 to 2009 in North Carolina. The results show that relative to charter school only students, switchers were negatively selected on a wide array of observable characteristics. Yet, charter school enrollment is associated with improved behavioral outcomes such as student absences, tardies, and suspensions, even after controlling for student demographic characteristics and student fixed effects. The positive, marginal association of charter schools increases as students remain in charter schools for longer periods of time.
Essay Three
There is mounting evidence that teachers are essential to increasing student achievement. However, young adults continue to feel ambivalent about joining the profession. Charter schools have become a popular alternative to TPSs and are touted as the ideal solution to fixing the US education system. Charter schools’ alternative policies are key to attracting and retaining
CHAPTER 2: THE COMPLEXITY OF ESTIMATING ACADEMIC
ACHIEVEMENT IN CHARTER SCHOOLS: EVIDENCE FROM NORTH CAROLINA
Introduction
Since charter school legislation was first passed in 1991, charter schools have become a popular alternative to traditional public schools (TPSs). Currently, 42 states and the District of Columbia have adopted charter school legislation. From 1999 to 2013, the percent of students attending charter schools increased from .7 percent to 6.2 percent while the number of operating charter schools grew from approximately 1,500 to 6,100 (NCES, 2015). These rates continue to increase each year.
Despite their popularity, charter schools’ effects on student achievement remain
inconclusive. Some studies conclude that charter schools decrease student achievement (Bifulco & Ladd, 2006; Carruthers, 2012; Hanushek et al., 2007; Imberman, 2011; Lauen, Fuller, & Dauter, 2015; Lavertu & Witte, 2009). In contrast, other studies find that charter schools increase student achievement. (Abdulkadiroglu et al, 2009; Berends, Mendiburo, & Nicotera, 2008; Booker et al., 2007; Hoxby & Rockoff, 2005; Hoxby & Murarka, 2009; Solmon & Goldschmidt, 2004; Solmon, Paark, & Garcia, 2001). Other researchers have reported that charter schools had no significant impact on student test scores (Witte et al., 2007; Zimmer et al., 2009).
This study estimates the effects of attending a charter school on North Carolina
estimating a simple form of the education production function using a pooled Ordinary Least Squares (OLS) model, which allows me to control for potentially confounding student background characteristics. However, this model incorrectly assumes that the error term is independent across student observations. I build upon this model by employing a student fixed effects model, which is a commonly favored model when estimating charter school effects from observational, longitudinal data. Student fixed effects models provide the most internally valid estimates (except for experimental estimates) because they are based solely on within student variation. In other words, both observable and unobservable time-invariant characteristics are controlled. Its estimates, however, represent only a small, unique subgroup of the charter school population. Consequently, I employ student random effects and multilevel growth models (time nested within student), which take advantage of the longitudinal qualities of my data and take into account the correlation among students over time. These models base estimates on the entire TPS and charter school student samples. The growth models provide dramatically different findings from the student fixed effects models. Examining the descriptive characteristics of the different charter school subpopulations helps to explain these conflicting estimates. Using graphical interpretations of these models to compare subsamples of charter school students and TPS students demonstrates the inherent challenges faced when attempting to estimate the true effect of charter schools on student achievement.
Background
Theoretical Considerations
Charter schools are one of the many forms of school choice that decentralize public education. Unlike TPSs, students at charter schools do not have to reside in a certain district or neighborhood to be eligible to attend and are not subject to the same rules and regulations as TPSs, but the schools still receive public funding. Additionally, these schools can receive financial support from donors or other charitable organizations. Of course, charter schools must still follow some basic regulations in order to ensure that they increase student achievement (Henig, 2008).
Market theory, in contrast, posits that competition for clients drives organizations to provide quality products. When applied to the education system, market theory suggests that charter schools compete for students by providing a quality education since they cannot compete on price. Supporters of this theory propose that poor student performance results from forcing schools to be democratic, noncompetitive organizations (Chubb & Moe, 1990). In other words, the government’s restrictive rules and regulations governing schools make them ineffective in providing a quality education. As a form of school choice, charter schools “stimulate the
development and improvement” of schools through market competition (Friedman, 1962; Chubb & Moe, 1990). Again, this theory relies on the assumption that parents and other interested parties are receiving free and reliable information on the relative quality of schools.
Background on North Carolina Charter Schools
North Carolina adopted charter school legislation in 1996, with the first 34 charter schools opening for the 1997-1998 school year. After lifting the 100 charter school cap in 2011, the number of charter schools operating in North Carolina grew to 148 for the 2014-2015 school year. Additionally, charter school enrollment continues to increase each year while an additional 32,000 students remain waitlisted (NCDPI, 2015; NCAlliance, 2015).
including additional funding for special needs and LEP students. However, charter schools are not eligible to receive capital funding and cannot use state funds to buy real property (Office of Charter Schools, 2015).
Past Literature on Charter School Student Achievement
Several studies have examined the effect of charter schools on student achievement, at the local, state, and national level. Results have, overall, been inconclusive. At the national level, one study including data from 26 states found that most charter schools did not significantly affect students’ math achievement (40%) or reading achievement (56%), although two subgroups, LEP Latinos and black students from low socioeconomic backgrounds, greatly benefited from attending charter schools. Approximately equal numbers of charter school students had lower (31%) and higher (29%) test scores in math. Slightly more charter school students had lower test scores in reading (25% vs. 19%; CREDO, 2013).
Studies using lottery systems to estimate charter school effects in Chicago, New York City, and Boston have, overall, shown improvement in student test scores (Abdulkadiroglu et al., 2011; Hoxby & Murarka, 2009; Hoxby & Rockoff, 2005). When charter schools are
oversubscribed, schools accept students based on a randomized lottery system. Using a lottery system provides strong internally valid results since students will be more adequately matched in terms of unobservable confounds. However, external validity is weakened since estimates are based only on students who want to attend charter schools (as opposed to all other students in TPSs).
be considered causal, assuming that time-variant observables are included in the model, since the need to control for time-invariant observables and unobservables is eliminated. External validity, however, is a key issue since student fixed effects estimates are based solely on switchers, or students who switch from charter schools to TPSs and vice versa.
Among studies using student fixed effects models, results have been mixed. In Florida, Sass (2006) showed that charter schools have a negative effect on achievement. However, after their fifth year of operation, there was a significant positive effect on reading test scores. In
Wisconsin, the opposite results were found using student fixed effects: charter schools had no effect on reading achievement but a positive effect on math achievement (Lavertu & Witte, 2009). These differences suggest that effects of charter schools may vary across school systems and states.
Recently, charter school studies have started using multilevel growth models, a type of student random effects model to estimate test score growth (Berends et al., 2009; Lauen, Fuller, & Dauter, 2015; Zimmer at al., 2009). These models allow for estimates to be based on the entire charter school and TPS student samples and build on student random effects models by
permitting both random slopes and intercepts. At the same time, these studies continue to face non-random assignment issues and must control for both student time-variant and time-invariant confounds.
Past Literature on North Carolina Charter Schools Student Achievement
Two studies conducted in North Carolina found that charter schools on average lower student math and reading test scores. (Bifulco & Ladd, 2006; Carruthers, 2012). Bifulco and Ladd (2006) used data on students in North Carolina’s public school system between the years of 1996 and 2002 in grades 3 through 8. Using levels, gains, and student fixed effects models, Bifulco and Ladd (2006) showed that charter school students’ achievement was significantly lower than TPS student achievement. Charter school students’ reading and math test scores were .095 and .160 of a standard deviation lower than TPSs when estimated using student fixed effects. Bifulco and Ladd (2006) suggest that their estimates using student fixed effects are representative of the larger charter school population by comparing students observed in both charter and TPSs to students observed at least once in a charter school and showing that they were demographically similar groups in terms of race and parent education.
Carruthers (2012) analyzed charter school effects in North Carolina from 1996 to 2002 in grades 7 and 8. Carruthers (2012) employed two versions of the student fixed effects model. In the first version, the outcome variable was students’ standardized test scores, otherwise known as a levels dependent variable. This model determined that charter schools had a positive effect on both math and reading student test scores. The other version used a gains dependent variable, which represents the difference in students’ test scores from one year to the next. In contrast to the levels model, the gains model shows a negative effect from charter schools on math
analysis to a small sample of the data since students must have at least three lagged test scores to be included in the DPD model. Results show that math test scores are .016 of a standard
deviation lower while reading test scores are .001 of a standard deviation higher in charter schools.
Data and Measures
Data
My sample includes elementary school and middle school TPS and charter school students in grades 4-8 between the years of 2004 and 2011. Approximately 3.9 million
observations of 1.3 million students, including 44,000 charter school students, were included in my analytic sample.1 My analysis focuses on the most recent data available in North Carolina. Previous research on North Carolina’s charter schools used data up to 2002 (Bifulco & Ladd, 2006) and 2007 (Carruthers, 2012).
I used data from the North Carolina Department of Public Instruction (NCDPI) administrative records. These data are maintained by the North Carolina Education Research Data Center and includes information on all TPS and charter school students in grade 3 through 12 in North Carolina. Information on teachers, classrooms, schools, and districts are also available. Students are longitudinally linked and therefore can be followed from year to year.
To increase the internal validity of my results, the scores of students whose tests were incorrectly administered were omitted from analysis and replaced with their correctly
control for prior educational inputs. Therefore, students in grade 3 were omitted. Students with missing data on dependent or independent variables were dropped.
Measures
Achievement. My dependent variables of interest were students’ end-of-grade (EOG)
math and reading tests scores. From grades 3 to 8, all students are required to take math and reading multiple choice tests at the end of the school year to evaluate their academic
competencies as described in the North Carolina Standard Course of Study. Scores should
increase as students move through each grade. If students’ scores do not improve, charter schools risk being shut down. To make scores comparable, students’ raw scores are standardized (i.e. the mean becomes 0 and the standard deviation becomes 1) for each year and grade combination. Other indicators of achievement, such as college enrollment, are less suitable since it may not be one of the charter school’s primary objectives.
Charter School Indicator. My main covariate of interest indicated if a student attended a
charter school and is time-varying (1=yes, 0=no).
Additional Controls. Time-variant and -invariant covariates were included in my analysis.
Time-invariant covariates included race and gender (male=0, female=1). Race consisted of five categories including black, Asian, Hispanic, Native American, and multiracial, with white being the reference category.
defined as a situation in which a student and at least 30 percent of those in his or her same grade and school move together to another school (Carruthers, 2012; Sass, 2006). In other words, a structural move is made if a student moves from elementary school to middle school. A non-structural move indicates if a student changed schools during elementary or during middle school. Lastly, models included grade and grade squared to control for time.
Methods
I begin my analysis by estimating a simple valued-added model (VAM) of the education production function. VAMs assume that prior inputs can be summarized by students’ lagged test scores (Todd & Wolpin, 2003; Todd & Wolpin, 2007). This inherently introduces endogeneity bias into the model since prior inputs most likely influence current inputs.
The general model includes a once lagged test score, Yti-1, on the right hand side of the
equation and is used instead of a gains score model, which places the lagged test score on the left hand side. Gains score models assume that the coefficient on lagged test scores is equal to one. In other words, this assumes that the lagged test score is a perfect representation of students’ prior inputs and achievement and that there is no decay effect (Todd & Wolpin, 2003).
Using ordinary least squares (OLS), my model is:
(1) Yti= β0 + β1Yti-1 + β2Charterti+ β3Gradeti + β4Grade2ti + β5XTti + β6Xi + ti.
model assumes that all potentially confounding time-variant and time-invariant variables
between the charter school indicator and the outcome variable, standardized math or reading test score, are included.
Student Fixed Effects Model
In most models estimating charter school effects, the main problem encountered is
controlling for unobservable student confounds. Consequently, student fixed effects models are commonly employed, which controls for time-invariant unobservables, such as innate ability, and time-invariant observables:
(2) Yti= β0 + β1Yti-1 + β2Charterti+ β3Gradeti + β4Grade2ti + β5XTti + i + ti
Student fixed effects allow each student to have his or her own deviation, i, from the mean
intercept, β0; therefore, students are compared only to their own baseline. Using student fixed effects accounts for all student time-invariant confounds, such as innate ability and prior inputs, since only within student estimates are computed. Consequently, there is no need to control for both observed and unobserved time-invariant student confounds since students are only being compared to themselves. Unlike equation (1), equation (2) does not require a vector of time-invariant covariates, Xi. These estimates, however, may still be biased due to time-variant
covariates (XTti), which continue to be included in the model.
Student Random Effects
When using longitudinal data, OLS is found to be inefficient and biased. To take advantage of the longitudinal aspects of this data, I employ the more efficient student random effects model which allows for within unit correlations or the clustering of students’ errors. Random effects models use precision-weighted least-squares estimates that compute both between effects and fixed effects and provide the weighted average of these two results:
(3) Yti= β0 + β1Yti-1 + β2Charterti+ β3Gradeti + β4Grade2ti + β5XTti + β6Xi + ti + u0i.
In this model, the additional term, u0i, estimates a student’s time-invariant error term while ti
accounts for a student’s time-varying residual. In contrast to pooled OLS, student random effects allows each individual to have his or her own random intercept. Similar to the pooled OLS model, to obtain accurate estimates, all potentially confounding variant (XT) and time-invariant (X) covariates must be controlled.
Multilevel Growth Models
Lastly, non-linear multilevel (time nested within student) growth models, a type of
random effects model, are estimated. Like other random effects models, both between and within variance are used to estimate effects which make this model more efficient than fixed effects models that only use within variance to estimate coefficients. Additionally, these models allow estimates for non-linear growth trajectories:
Both time-variant (XTti) and time-invariant (XTi)covariates are included. Unlike the previously
mentioned random effects model used, this multilevel growth model allows both slopes and intercepts to vary randomly. The time variable, Gradeti (and consequently, Grade2ti), are set to 0
(instead of grade 4) to define initial status. β6 is the coefficient of interest and demonstrates the average effect of attending a charter school on students’ tests scores across all grade levels. I also include a squared time variable, Grade2
ti, which allows the effects to be non-linear. By including
this covariate, there is no assumption made that the average effect of attending a charter school must be the same across all grade levels.
Estimates are unbiased and efficient if the covariates are uncorrelated with attending a charter school; in other words, all possibly confounding variables are controlled so that attending a charter school is exogenously determined.
Results
In general, charter schools seem to have slightly better characteristics than TPSs (Table 2.1). Charter schools enroll fewer students (352 vs. 545), have less crime per 100 students (.26 vs. .63), and are less likely to be a Title I School (42% vs. 62%). Similar proportions of white students (54%) attend each school type although a higher proportion of black students attend charter schools (37% vs. 31%) while a higher proportion of Latinos attend TPSs (10% vs. 4%). Finally, most charter schools are situated in urban areas (39%) while most TPSs are located in rural areas (48%).
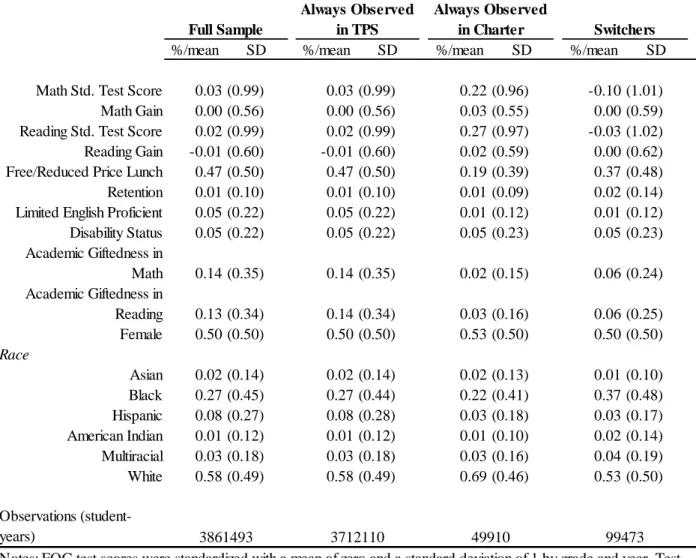
Examining the descriptive statistics of my student sample among students observed only in TPSs, those observed only in charter schools, and switchers illustrates that students observed only in charter schools appear to have better more affluent characteristics compared to switchers (Table 2.2). Demographically, charter school students are more likely to be white (69% vs. 50%) and less likely to enroll in free or reduced price lunch programs (19% vs. 37%) than switchers. Switchers are more likely to be black (37% vs. 22%) and are more likely to be retained (2% vs. 1%). Switchers do not appear to represent the majority of charter school students.
Even among switchers, a few distinct trends differentiate students that switch into charter schools, switch out of charter schools, and switch multiple times (Table 2.3). Those who switch into charter schools are more likely to be white (61%). Multiple switchers and those switching out are more likely to enroll in a free or reduced price lunch program (50% and 40%,
The student fixed effects model estimates that charter schools have a large and
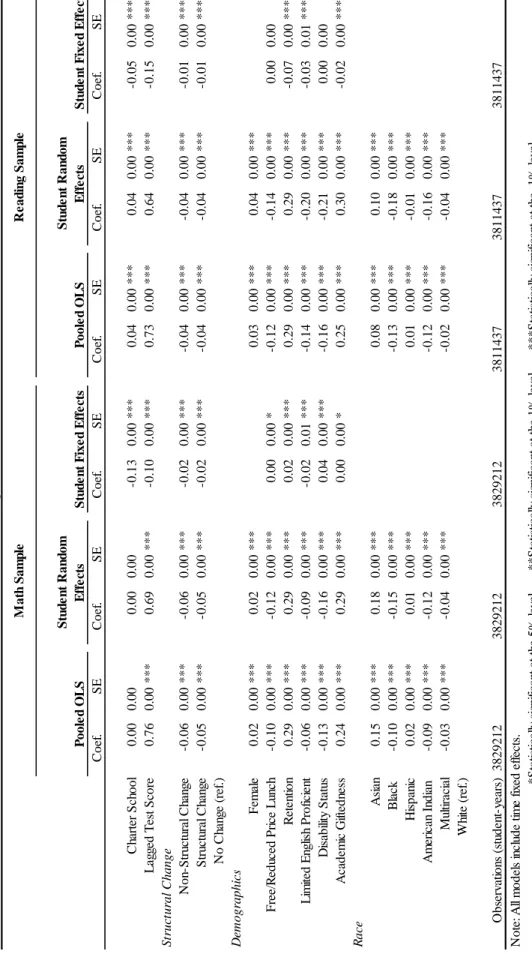
statistically significant negative effect on math and reading test scores (Table 2.4).2 Attending a charter school is associated with a .13 decrease in students’ standardized math test scores and a .05 decrease in students’ reading standardized test scores compared to TPS students. However, student fixed effects models only use switchers to compute estimates, and switchers represent approximately 2% of students and do not represent the majority of charter schools students.
For both the math and reading outcomes, the pooled OLS and student random effects models provide similar estimates (Table 2.4). For the math sample, charter schools have no significant effect on achievement in either the pooled OLS or student random effects model. For the reading sample, charter schools have the same positive and statistically significant effect on student test scores compared to TPSs in the pooled OLS and student random effects models. Attending a charter school is associated with, on average, a .04 increase in a student’s standardized reading test score compared to a TPS student.
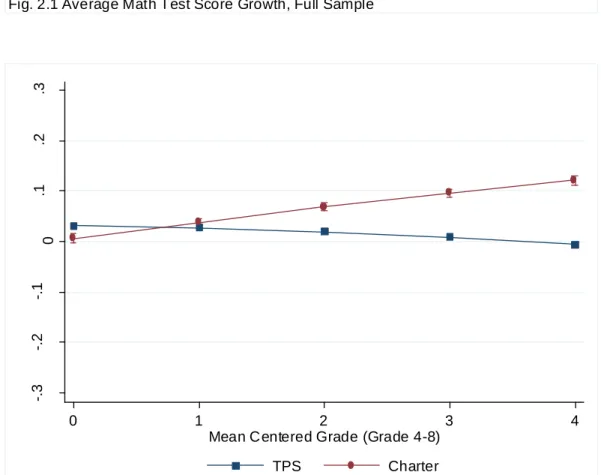
The non-linear time-nested within-student random coefficient growth models provide a more optimistic picture of student achievement in charter schools and start to provide some explanation for the conflicting results discussed above (Table 2.5).3 Charter school students in 4th grade start behind their TPS peers in both math and reading, as shown by the negative and statistically significant charter school coefficient. However, the interaction effect between charter school and grade shows that charter school students’ positive trajectory is significantly larger compared to TPS students; students in charter schools have on average a .07 increase in their
2Including grade-year fixed effects models provided similar results to the quadratic time models.
3Linear growth models were also run and provided similar results to non-linear models (see Appendix Table A1).
math standardized test scores and .04 increase in the growth of their reading standardized test scores compared to TPS students. The effect of charter schools slightly decreases when including the interaction effect between grade squared and charter for the math sample, although not enough to negate the overall positive trajectory of charter school test score growth. The interaction term of grade squared and charter has no effect on reading achievement.
The results from the multilevel growth model are best understood by examining test score growth trajectories graphically (Figure 2.1 and 2.2). For both math and reading, charter school students have a positive growth trajectory, while TPS student growth is relatively constant. In both the math and reading samples, charter school student achievement eventually surpasses TPS student achievement.
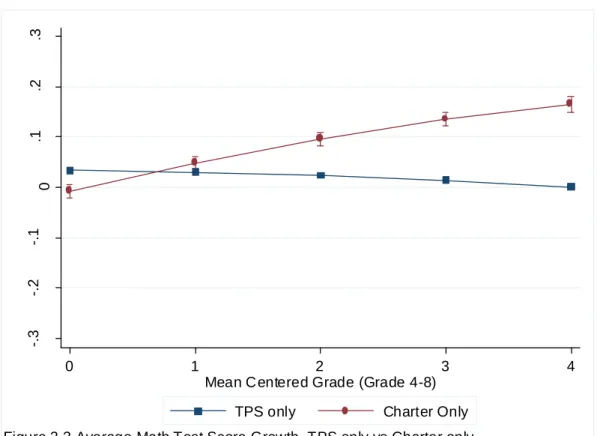
Results by Switcher Type
school students have, in general, positive growth trajectories although these trajectories still vary depending on the subgroup.4
Discussion
My study makes several contributions to the existing literature on charter schools
including explaining how past research on charter school student achievement has drawn such a wide range of conclusions. Additionally, my present findings challenge previous literature in North Carolina that employed student fixed effects models and found that charter schools decreased student achievement. Specifically, I show that these results were based solely on a small, unique subpopulation of charter school students. Compared to charter school only students, switchers were from less advantaged backgrounds. While these results have strong internal validity, switchers did not appear to be representative of charter school students in general. These results potentially suggest a story of causal heterogeneity, which was further confirmed by the results from the student random effect models. The random effects model provided substantially different findings. Attending charter schools did not significantly increase students’ math test scores compared to students attending a TPS. Charter schools were associated with an increase in reading standardized tests scores. Random effects models account for the whole student population and provide vastly different results from the student fixed effects models. Combined with the student fixed effects model results, these findings are indicative of causal heterogeneity.
Growth models, my preferred model, show that charter schools are actually associated with a positive trajectory in students’ math and reading achievement. Further analysis with these models shows that, in general, the positive trajectories of the subgroups of charter school
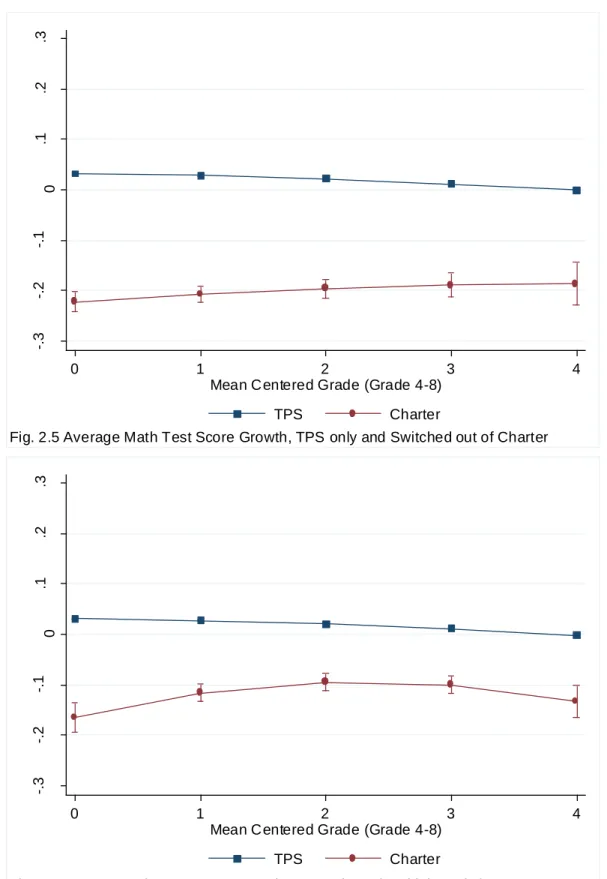
students still substantially vary. For example, charter school only students from more affluent backgrounds had the largest positive trajectories in student achievement. In contrast, student from the poorest backgrounds such as students who switched schools multiple times and those who switched out of charter schools still benefitted from charter schools but to a lesser degree. Students who switched out of charter schools have a much gentler upward slope whereas
multiple switchers initially benefit from attending a charter school but eventually regress. These findings suggest that student fixed effects and random effects models are not capturing the true effect of charter schools; instead, causal heterogeneity may be the driving force behind these different estimations. Consequently, causal claims on effect of charter schools on student
achievement should be interpreted cautiously; estimations appear to be dependent on the specific population of charter school students on which parameters are being estimated.
This study is not without its limitations. First, my results are based on the student population in North Carolina and therefore limits the generalizability of my findings, especially since the rules and policies regarding charter schools varies from one state to the next. Second, as with any study on charter school student achievement, omitted variable bias is always a potential concern. However, the research design used in this study substantially reduces bias from time-variant and time-intime-variant covariates. Future work should continue to hypothesize and quantify covariates that may predict students’ standardized test scores.
Despite the large number of studies evaluating charter school student achievement, more research is needed to garner the true effects of charter schools. These effects cannot be
REFERENCES
Abdulkadiroglu, A., Angrist, J.D., Dynarski, S.M., Kane, T.J., & Pathak, P.A. (2011).
Accountability and flexibility in public schools: Evidence from Boston’s charters and pilots. The Quarterly Journal of Economics, 126(2), 699-748.
Berends, M., Goldring, E., Stein, M., & Cravens, X. (2010). Instructional conditions in charter schools and students’ mathematics achievement gains. American Journal of Education, 116, 303-335.
Berends, M., Mendiburo, M., & Nicotera, A. (2008, March). Charter school effects in an urban school district: An analysis of student achievement growth. Paper presented at the annual meeting of the American Educational Research Association, New York, NY.
Bifulco, R., & Ladd, H. (2006). The impacts of charter schools on student achievement: Evidence from North Carolina. Education Finance and Policy, 1, 50-90.
Booker, K., Gilpatric, S.M., Gronberg, T., Jansen, D. (2007). The impact of charter school attendance on student performance. Journal of Public Economics, 91(5), 849-876. Carruthers, C.K. (2012). New schools, new students, new teachers: Evaluating the effectiveness
of charter schools. Economics of Education Review, 31, 280-292.
Center for Research on Education Outcomes (CREDO). (2013). National charter school study 2013. Palo Alto, CA: Stanford. Retrieved from
https://credo.stanford.edu/documents/NCSS%202013%20Final%20Draft.pdf
Chubb, J. & Moe, T. (1990). Politics, markets, and America’s schools. Washington, D.C.: Brookings Institution.
Friedman, M. (1962). Capitalism and freedom. Chicago, IL: University of Chicago Press. Fuller, B., Gawlik, M., Gonzales, E.K., & Park, S. (2004). Localized ideas of fairness: Inequality
among charter schools. In Bulkley, K. & Wohlstetter, P. (Eds.), Taking account of charter schools (pp.93-120). New York, NY: Teachers College Press.
Hanushek, E.A., Kain, J.F., Rivkin, S.G., & Branch, G.F. (2007). Charter school quality and parental decision making with school choice. Journal of Public Economics, 91(5-6), 823-848.
Henig, J.R. (2008). Spin cycle: How research is used in policy debates: the case of charter schools. New York, NY: Russel Sage Foundation.
Hoxby, C., & Murarka, S. (2009). Charter schools in New York City: Who enrolls and how they affect their students’ achievement. NBER Working Paper No. 14852. Cambridge, MA: National Bureau of Education Research.
Hoxby, C., & Rockoff, J. (2005). The impact of charter schools on student achievement. Working Paper, Harvard University.
Imberman, S. (2011). Achievement and behavior in charter schools. Drawing a more complete picture. Review of Economics and Statistics, 93(2), 416-435.
Lauen, D., Fuller, B., & Dauter, L. (2015). Positioning charter schools in Los Angeles: Diversity of form and homogeneity of effects. American Journal of Education, 121, 213-239. Lavertu, S. & Witte, J. (2009). The impact of Milwaukee charter schools on student achievement
(Issues in Governance Studies No. 23). Retrieved from Brookings Institution website: http://www.brookings.edu/~/media/Files/rc/papers/2009/ 03_charter_lavertu_witte/0 3_charter_lavertu_witte.pdf
Lubienski, C. (2003). Innovation in education markets: Theory and evidence on the impact of competition and choice in charter schools. American Educational Research Journal, 40(2), 395-443
National Center for Education Statistics (NCES). (2015). The Condition of Education 2015: Charter School Enrollment.
NC Alliance for Public Charter Schools (NCAlliance). (2015). North Carolina charter school fast facts 2013-2014. Retrieved October 15, 2015, from http://www.nccharters.org/.
North Carolina Department of Public Instruction (NCDPI). (2015). Charter school membership by LEA – Survey results: 2014-2015 Summary and results by region. Retrieved Oct 15, 2015, from http://www.ncpublicschools.org/fbs/resources/data/.
Office of Charter Schools. (2015). Legislation. Retrieved October 15, 2015, from
http://www.ncpublicschools.org/charterschools/policy/legislation/.
Sass, T.R., (2006). Charter schools and achievement in Florida. Education Finance and Policy, 1, 91-122.
Solmon, L. & Goldschmidt, P. (2004). Comparison of traditional public schools and charter schools on retention, school switching, and achievement growth. Goldwater Institute Policy Report.
Todd, P.E.. & Wolpin, K.I. (2003). On the specification and estimation of the production function for cognitive achievement. The Economic Journal, 113(485), F3-F33.
Todd, P.E.. & Wolpin, K.I. (2007). The production of cognitive achievement in children: Home, school, and racial test score gaps. Journal of Human Capital, 1(1), 91-136.
Witte, J., Weimer, D., Shober, A., & Schlomer, P. (2007). The performance of charter schools in Wisconsin. Journal of Policy Analysis and Management, 26, 557-573.
-.
3
-.
2
-.
1
0
.1
.2
.3
S
td
.
M
a
th
T
e
s
t
S
c
o
re
0 1 2 3 4
Mean Centered Grade (Grade 4-8)
TPS Charter
Fig. 2.1 Average Math Test Score Growth, Full Sample
-.
3
-.
2
-.
1
0
.1
.2
.3
S
td
.
R
e
a
d
in
g
T
e
s
t
S
c
o
re
0 1 2 3 4
Mean Centered Grade (Grade 4-8)
TPS Charter
-.
3
-.
2
-.
1
0
.1
.2
.3
S
td
.
M
a
th
T
e
s
t
S
c
o
re
0 1 2 3 4
Mean Centered Grade (Grade 4-8)
TPS only Charter Only
Figure 2.3 Average Math Test Score Growth, TPS only vs Charter only
-.
3
-.
2
-.
1
0
.1
.2
.3
S
td
.
M
a
th
T
e
s
t
S
c
o
re
0 1 2 3 4
Mean Centered Grade (Grade 4-8)
TPS Charter
-.
3
-.
2
-.
1
0
.1
.2
.3
S
td
.
M
a
th
T
e
s
t
S
c
o
re
0 1 2 3 4
Mean Centered Grade (Grade 4-8)
TPS Charter
Fig. 2.5 Average Math Test Score Growth, TPS only and Switched out of Charter
-.
3
-.
2
-.
1
0
.1
.2
.3
S
td
.
M
a
th
T
e
s
t
S
c
o
re
0 1 2 3 4
Mean Centered Grade (Grade 4-8)
TPS Charter
Table 2.1 North Carolina School Descriptives (2004-2011)
%/mean SD %/mean SD
Average Enrollment 545 262 352 270
% Female 48% 0.05 49% 0.05
Title I School 64% 0.48 42% 0.49
Crimes per 100 Students 0.63 1.98 0.26 1.10
Ethnic Composition
% Black 31% 0.25 37% 0.36
% Latino 10% 0.10 4% 0.06
% White 54% 0.28 54% 0.36
Location
Urban 25% 0.43 39% 0.49
Suburban 15% 0.36 12% 0.32
Town 12% 0.33 16% 0.36
Rural 48% 0.50 33% 0.47
Observations (school-years) 14514 666
Traditional Public
Schools Charter Schools
%/mean SD %/mean SD %/mean SD %/mean SD
Math Std. Test Score 0.03 (0.99) 0.03 (0.99) 0.22 (0.96) -0.10 (1.01)
Math Gain 0.00 (0.56) 0.00 (0.56) 0.03 (0.55) 0.00 (0.59)
Reading Std. Test Score 0.02 (0.99) 0.02 (0.99) 0.27 (0.97) -0.03 (1.02)
Reading Gain -0.01 (0.60) -0.01 (0.60) 0.02 (0.59) 0.00 (0.62)
Free/Reduced Price Lunch 0.47 (0.50) 0.47 (0.50) 0.19 (0.39) 0.37 (0.48)
Retention 0.01 (0.10) 0.01 (0.10) 0.01 (0.09) 0.02 (0.14)
Limited English Proficient 0.05 (0.22) 0.05 (0.22) 0.01 (0.12) 0.01 (0.12)
Disability Status 0.05 (0.22) 0.05 (0.22) 0.05 (0.23) 0.05 (0.23)
Academic Giftedness in
Math 0.14 (0.35) 0.14 (0.35) 0.02 (0.15) 0.06 (0.24)
Academic Giftedness in
Reading 0.13 (0.34) 0.14 (0.34) 0.03 (0.16) 0.06 (0.25)
Female 0.50 (0.50) 0.50 (0.50) 0.53 (0.50) 0.50 (0.50)
Race
Asian 0.02 (0.14) 0.02 (0.14) 0.02 (0.13) 0.01 (0.10)
Black 0.27 (0.45) 0.27 (0.44) 0.22 (0.41) 0.37 (0.48)
Hispanic 0.08 (0.27) 0.08 (0.28) 0.03 (0.18) 0.03 (0.17)
American Indian 0.01 (0.12) 0.01 (0.12) 0.01 (0.10) 0.02 (0.14)
Multiracial 0.03 (0.18) 0.03 (0.18) 0.03 (0.16) 0.04 (0.19)
White 0.58 (0.49) 0.58 (0.49) 0.69 (0.46) 0.53 (0.50)
Observations (student-years)
Notes: EOG test scores were standardized with a mean of zero and a standard deviation of 1 by grade and year. Test scores refer to students' baseline test scores in 4th grade (N= 778799) for the math sample and (N=773874) for the reading sample. Student-years refers to the math sample although the means and standard deviations for reading standardized test score, reading gain, and academic giftedness in reading are from the reading sample (N=3843599).
Full Sample
3861493
Table 2.2 Descriptive Statistics of North Carolina Students (Grades 4-8, 2004-11)
Always Observed in TPS
Always Observed
in Charter Switchers
%/mean SD %/mean SD %/mean SD Math Std. Test Score 0.12 (1.00) -0.28 (0.98) -0.33 (0.97)
Math Gain -0.02 (0.57) 0.05 (0.60) -0.02 (0.61) Reading Std. Test Score 0.19 (0.96) -0.19 (1.00) -0.20 (0.98) Reading Gain -0.01 (0.60) 0.03 (0.64) -0.02 (0.65) Free/Reduced Price Lunch 0.29 (0.45) 0.40 (0.49) 0.50 (0.50) Retention 0.01 (0.12) 0.02 (0.15) 0.03 (0.17) Limited English Proficient 0.02 (0.13) 0.01 (0.12) 0.01 (0.11) Disability Status 0.05 (0.21) 0.06 (0.24) 0.06 (0.23) Academic Giftedness in Math 0.08 (0.27) 0.06 (0.24) 0.04 (0.20) Academic Giftedness in Reading 0.08 (0.27) 0.06 (0.24) 0.04 (0.20) Female 0.52 (0.50) 0.50 (0.50) 0.48 (0.50) Race
Asian 0.01 (0.12) 0.01 (0.10) 0.01 (0.08) Black 0.29 (0.45) 0.41 (0.49) 0.47 (0.50) Hispanic 0.03 (0.18) 0.03 (0.16) 0.03 (0.18) American Indian 0.02 (0.14) 0.01 (0.11) 0.03 (0.17) Multiracial 0.03 (0.18) 0.04 (0.19) 0.05 (0.21) White 0.61 (0.49) 0.51 (0.50) 0.41 (0.49) Observations (student-years)
Notes: EOG test scores were standardized with a mean of zero and a standard deviation of 1 by grade and year. Test scores refer to students' baseline test scores in 4th grade (N= 778799) for the math sample and (N=773874) for the reading sample. Student-years refers to the math sample although the means and standard deviations for reading standardized test score, reading gain, and academic giftedness in reading are from the reading sample (N=3843599). Indicates statistical differences (p<.05) between the sample means: a=conversion vs. TPS, b=start-up vs. TPS, and c=conversion vs. start-up.
32288
43695 23490
Table 2.3 Descriptive Statistics of Switchers (Grades 4-8, 2004-2011)
Switched In and Out of
Charter Switch In
Charter and Stayed In
Switched Out of Charter and
Coef. Coef.
Charter School -0.14 (0.00) *** -0.03 (0.00) *** Grade -0.01 (0.00) *** -0.02 (0.00) *** Charter School X Grade 0.07 (0.00) *** 0.04 (0.00) *** Grade X Grade 0.00 (0.00) * 0.00 (0.00) *** Charter School X Grade X Grade -0.01 (0.00) *** 0.00 (0.00) Structural Change
Non-Structural Change -0.05 (0.00) *** -0.03 (0.00) *** Structural Change -0.08 (0.00) *** -0.05 (0.00) ***
No Change (ref.) Demographics
Female -0.03 (0.00) *** 0.13 (0.00) *** Free/Reduced Price Lunch -0.17 (0.00) *** -0.19 (0.00) *** Retention 0.25 (0.01) *** 0.18 (0.01) *** Limited English Proficient -0.40 (0.00) *** -0.54 (0.00) *** Disability Status -0.27 (0.00) *** -0.45 (0.00) *** Academic Giftedness 0.55 (0.00) *** 0.52 (0.00) *** Race
Asian 0.32 (0.01) *** 0.10 (0.01) *** Black -0.66 (0.00) *** -0.60 (0.00) *** Hispanic -0.20 (0.00) *** -0.28 (0.00) *** American Indian -0.53 (0.01) *** -0.53 (0.01) *** Multiracial -0.24 (0.00) *** -0.21 (0.00) *** White (ref.)
Observations (student-years)
Note: Grade recentered at 0. Models include interactions between student demographic controls and grade and grade squared. Robust SEs in parentheses.
*Statistically significant at the 5% level **Statistically significant at the 1% level ***Statistically significant at the .1% level
Table 2.5 Non-Linear Multilevel Growth Models, 2004-2011
Math Standardized Test Score
Reading Standardized Test Score
SE SE
CHAPTER 3: THE EFFECT OF CHARTER SCHOOLS
ON BEHAVIORAL OUTCOMES: EVIDENCE FROM NORTH CAROLINA
Introduction
Since 1991, 42 states and the District of Columbia have adopted charter school legislation. Charter schools serve more than 2.5 million children (National Alliance for Public Charter Schools, 2015) in approximately 6,100 schools across the U.S. (NCES, 2015), and these rates increase annually. Additionally, charter schools continue to garner support from both parents and students (Barrett, 2003; Buckley & Schneider, 2009; Gleason et al., 2010; McCully & Malin, 2003). In a multi-state study, parents of charter school students were 33% more likely to rate their school as excellent compared to parents of traditional public school (TPS) students. However, charter schools’ high ratings were not necessarily due to increases in student achievement. Rather, parents cited the stricter and more disciplined environments of charter schools as one of the primary reasons that they were satisfied with their child’s charter school (Gleason et al., 2010).
even suggested that behavioral skills better explain differences in wages than cognitive skills (Bowles & Ginits, 1976; Bowles, Gintis, & Osborne, 2001; Carneiro, Heckman, & Masterov, 2005). These results suggest that the development of adolescents’ behavioral skills are just as essential, if not more so, than the development of their cognitive skills.
Using data from North Carolina, this study examines whether charter schools influence students’ behavioral outcomes. Few studies have looked at students’ behavioral and non-cognitive development (Dobbie & Fryer, 2013; Imberman, 2011). This study contributes to the existing literature on charter schools by examining a largely overlooked dimension of student outcomes on which to evaluate the success of charter schools. Benefits of charter schools on students’ behavioral outcomes may explain the positive externalities (i.e. non-cognitive skills) associated with charter schools as well as why more charter school students are graduating from high school and attending college (Angrist et al., 2013).
Theoretical Considerations
As one of the many forms of school choice, charter schools developed as a way to
decentralize public education. Both charter and TPSs receive public funding. However, charter schools can receive financial support from donors or other charitable organizations. Additionally, charter school students do not have to reside in a certain district or neighborhood to be eligible to attend and are not subject to the same rules and regulations as TPSs (Henig, 2005). In North Carolina, a charter school’s board of directors is in charge of the budget, curriculum, and other operational activities. For example, the school board is not required to provide transportation or meals to students, even students who qualify for free and reduced lunch programs.
competition and choice drive producers to offer higher quality products. Applying this logic to the U.S. education system, market theorists propose that allowing students to choose the school they want to attend and making schools compete for students leads to better, higher quality education (Betts & Loveless, 2005; Bulkley & Wohlstetter, 2004; Chubb & Moe, 1990). In contrast, highly regulated and systematized TPSs have little incentive to improve or maintain a certain standard of quality (Chubb & Moe, 1990). Allowing charter schools to be deregulated and decentralized provides them with the autonomy to improve student outcomes. Specifically, charter schools are able to rapidly respond to the needs and preferences of their community by adopting innovative practices (Bulkley & Wohlstetter, 2004; Vieteritti, 1999).
Milton Friedman and Gary Becker both claimed that choice and competition “would induce a fast rate of innovation” in schools (Becker, 1999, p. 2; Friedman, 1955; Chubb & Moe, 1990; Coulson, 1999; Friedman & Friedman, 1980; Gintis, 1995; Lubienski, 2005). Charter schools compete for students and consequently, stay focused on the needs of the consumers (i.e. students and families), facilitating a rapid rate of innovation in teaching and education. These instructional, curricular, and adminstrative changes are directed at improving students’ well-being (Lubienski, 2005).
Students’ well-being and ultimate success undoubtedly includes behavioral outcomes. Indeed, in Lubienski’s (2003) literature review of innovative standards adopted by charter schools, many new practices are related to organizational activities and not necessarily directly related to student achievement in the classroom. For example, several charter schools focus on instilling shared community values, such as the value of receiving an education (Strike, 2010).
are highly regulated and static (DiMaggio & Powell, 1983) due to the overwhelming influence of an organization’s history (North, 1990). Consequently, communities with strong values define what is considered to be a legitimate school. To be successful, new schools are strongly
incentivized to adopt similar norms and structures that validate and legitimize existing customs. Ultimately, this leads to organizational isomorphism (Meyer & Ramirez, 2000; Meyer & Rowan, 1977), and suggests that charter schools ultimately revert back to more traditional learning systems without innovative practices (Lubienski, 2005).
These theories provide conflicting hypotheses. According to market theory, innovative practices adopted by charter schools should ultimately lead to improving their students’
behavioral outcomes. In contrast, institutional theory posits that charter schools would actually adopt similar practices and norms of TPSs, and thus, charter school students’ behavioral outcomes would be unchanged.
Background
Behavioral outcomes
Research focusing on children’s behavior illustrates its importance on both short- and long-term student outcomes (Heckman et al., 2006; Heckman & Rubinstein, 2001). Heckman and his colleagues (2006) found that adolescent behavior and non-cognitive abilities influence their future degree attainment and wages. In studies comparing the wages of GED-holders to high school dropouts, results showed that dropouts actually earned higher wages than GED-holders after controlling for behaviorial outcomes. This wage differential, in fact, was due to the differences in these groups’ behavioral (Cameron & Heckman, 1993; Heckman, Hsse, &
18 percent when behaviorial measures are included in their analysis. Improvement in students’ behavioral outcomes leads to increases both students’ productivity and earnings by instilling students with the correct habits and skills to succeed in the workforce.
Many studies suggest that behavioral outcomes are reflective of non-cognitive skills. (Heckman et al., 2006) Consequently, previous studies have used attendance records and suspensions as proxies for measuring non-cognitive skills (Imberman, 2011; Jackson, 2012; Segal, 2013). In North Carolina, Jackson (2012) used absences, suspensions, grades, and on-time grade progression to measure students’ non-cognitive skill level, and showed that these measures were predictive of students’ future arrests, employment, and earnings.
Charter School Outcomes
Previous research on charter schools has been particularly focused on examining
improving test scores, about 19 percent and 31 percent still perform worse than TPSs in reading and math, respectively (CREDO, 2013).
While charter schools may not uniformly improve student test scores, studies evaluating other indicators of academic success such as educational attainment have provided more positive results (Booker et al., 2009; Booker et al., 2011; Furgeson et al., 2012; Angrist et al., 2013; McClure et al., 2005). In San Diego, charter school lottery winners were more likely to report plans to attend a 4-year college compared to lottery losers (McClure et al., 2005). Even after controlling for demographic characteristics, charter school students are more likely to graduate from high school and to attend college than their TPS peers (Booker et al., 2009). On average, attending a charter high school increased students’ likelihood of attending college by 8 to 10 percentage points while attending both a charter middle and high school increased students’ chances of going to college by 7 to 15 percentage points (Booker et al., 2011). In a study
examining charter management organizations, charter students were 21 to 23 percent more likely to enroll in college (Furgeson et al., 2012). While some studies have found no significant effects of charter schools on educational attainment, they have found positive effects on charter
students’ transition from a 2-year to 4-year college and on their SAT scores (Angrist et al., 2013). In general, students attending charter schools have higher educational attainment than those in TPSs.
that female and male students attending the Promise Academy (a charter school) were,
respectively, 12.1 percentage points less likely to become pregnant and 4.3 percentage points less likely to be incarcerated (Dobbie & Fryer, 2013). While there is limited research on charter students’ behavioral outcomes, the few studies conducted have shown positive results. I
contribute to this growing literature by looking specifically at schools in North Carolina, where most studies on charter school student achievement have found negative effects. Additionally, to date, I use the most comprehensive list of behavioral outcomes.
Data
Data and Sample
The North Carolina Department of Public Instruction (NCDPI) collects administrative data on all public and charter school students in the state. These data are maintained by the North Carolina Education Research Data Center and include information on students, teachers,
classrooms, schools, and districts in North Carolina. Students are longitudinally linked and therefore can be followed over time.
My sample includes all TPS and charter school students in grades 3 through 8 from 2006 to 2009. Approximately 2.6 million observations of 1.1 million students were included in my analytic sample. While data has been collected on student attendance and suspension rates up to 2011, there was a high amount of missing data during the latter years, and thus, these data were excluded from my analysis.5 Additionally, listwise deletion was employed on observations missing data on dependent or independent variables (Carruthers, 2012).
Measures
Dependent Variables
Absences. Measures of behavioral outcomes included absences, tardies, and suspensions.
Absences are measured using two separate indicators: 1) number of days absent and 2) number of days of unexcused absences. Parents or guardians are required to notify schools if their child is going to be absent and to provide a reason for the absence. Students receive excused absences for any of the following reasons: 1) illness or injury; 2) quarantine, 3) death in the immediate family, 4) medical or dental appointments, 5) court or administrative proceedings, 6) religious observance, 7) educational opportunity, 8) local school board policy, 9) absence related to deployment activities, and 10) child care. Any other reason for being absent is considered unexcused (NCDPI, 2014).
Tardies. Tardiness is measured by the number of days a student is late to school. Students
may be suspended for up to 2 days for “excessive tardiness” (NCDPI, 2014).
Suspensions. Students may incur out-of-school and in-school suspensions. Each type of
suspension is measured in two ways: 1) number of times a student was suspended and 2) number of days a student was suspended. Students may be suspended for violating the local education board’s Code of Student Conduct. In-school suspensions include assignments to alternative school programs for a short period of time (NCDPI, 2015).
Independent Variables
Charter School. Students were identified as attending a charter school or a TPS. This is
Years in Charter School. The number of consecutive years a student attended a charter
school was grouped into four categories: first year in a charter school, second year in a charter school, third year in a charter school, and fourth year or more in a charter school.
Additional Controls. Time-invariant covariates included race and gender. Race was
comprised of five categories including black, Asian, Hispanic, Native American, multiracial, and white. White was the referent category.
Time-variant covariates included dummy variables indicating limited English proficient status (LEP), disability status, free or reduced price lunch eligibility, academic giftedness, and Title 1 school. Indicators of structural change and non-structural change, with no change being the reference category, were also included. A structural move is defined as a situation in which a student and at least 30 percent of those in his or her same grade and school moved together to another school (Carruthers, 2012; Sass, 2006). In other words, a structural move is made if a student moves from elementary school to middle school. A non-structural move indicates if a student changed schools during elementary or middle school. Students were considered
academically gifted if they identified as gifted in either math or reading or both. Students were labeled as disabled if they had a learning disability in one or more of four areas: reading, writing, math, or other. Lastly, models included grade and grade squared.
Methods
Pooled OLS
I begin my analysis by estimating a pooled OLS model of the education production function. This model includes:
(1) Yti= β0 + β1Charterti+ β2Gradeti + β3Grade2ti + β4XTti + β5Xi + ti
where Y is the one of the behavioral dependent measures at time t for student i and is regressed on a charter indicator, grade, and grade squared. Vectors of time-variant covariates (XT) and time-invariant covariates (X) were also included.
There are two major assumptions that, if violated, would lead to biased estimates of the pooled OLS model. First, this model assumes that the error term, ti, is independent across
observations. Since my data is longitudinal, this assumption does not hold. Second, estimates from pooled OLS models are unbiased only if all possible confounding factors are included in the model. Previous literature was used to determine which confounding covariates were to be included in the present model. However, in any model, this assumption is typically violated since it is difficult to identify and measure all confounding covariates.
Student Random Effects Model
(2) Yti= β0 + β1Charterti+ β2Gradeti + β3Grade2ti + β4XTti + β5Xi + ti + u0i.
The key difference between the pooled OLS and random effects model is the random effects model allows for within-unit correlations. In other words, an individual student’s error term (u0i) is clustered across time while ti still accounts for the student’s time-varying residual. Similar to
the pooled OLS model, both time-invariant and time-variant covariates are included to ensure the least biased estimates.6
Student Fixed Effects Model
The final model analyzed was the student fixed effects model. This model includes:
(3) Yti= β0 + β1Charterti+ β2Gradeti + β3Grade2ti + β4XTti + i + ti
where each student is allowed his or her own deviation, i , from the mean intercept (β0). The main advantage of using a student fixed effects model is that students are only being compared to themselves, and thus, time-invariant observable and unobservable covariates are not included as possible confounders. However, student fixed effects model estimates are based solely on switchers, i.e. students who switch from charter schools to TPSs or vice versa. Consequently, these estimates may not apply to students who are only observed in charter schools. To
determine the validity of this model, researchers must determine if switchers are representative of the entire charter school population. Unlike equations (1) and (2), equation (3) only includes time-varying covariates (XTti) as possible confounders.
6Linear and non-linear growth models, variations of student random effects models were also analyzed. These are a
Other Models
Other models considered included a hurdle regression model. This model is similar to a 2-part model and is used when there is zero-inflation of the dependent variable. The first part of the model includes a logit or probit binary model with a dummy variable indicating whether the actual count is greater than zero. The second part of the model includes a zero-truncated count model, such as a Poisson or negative binomial model that is run on non-zero counts only. The hurdle model was not used for two reasons. First, these models have limited interpretation when fixed effects are included. Second, because nonrandom assignment is an overwhelming concern when estimating charter school effects, these models would provide biased estimates without taking into account the longitudinal nature of the data.
Sensitivity Analyses
To determine the robustness of the models used in this study, two alternative
specifications were also examined. First, VAMs were estimated. VAMs assume that prior inputs can be summarized by a student’s lagged outcome variable (Todd & Wolpin, 2003; Todd & Wolpin, 2007). However, this model also induces endogeneity since prior inputs most likely influence current inputs. Second, there may be effects that are grade and year specific. To test this issue, I also examined models in which grade and grade squared were replaced with grade-year indicators. Results from both of these model specifications were similar to those presented below.
Results
100 students (.17 vs. .61), lower school enrollment rates (252 vs. 547), and are less likely to be Title I schools (19% vs. 58%). Charter schools have slightly higher proportions of black students than TPSs (37% vs. 31%) but similar percentages of white students (53% vs. 54%). Overall, charter schools may produce better learning environments compared to TPSs.
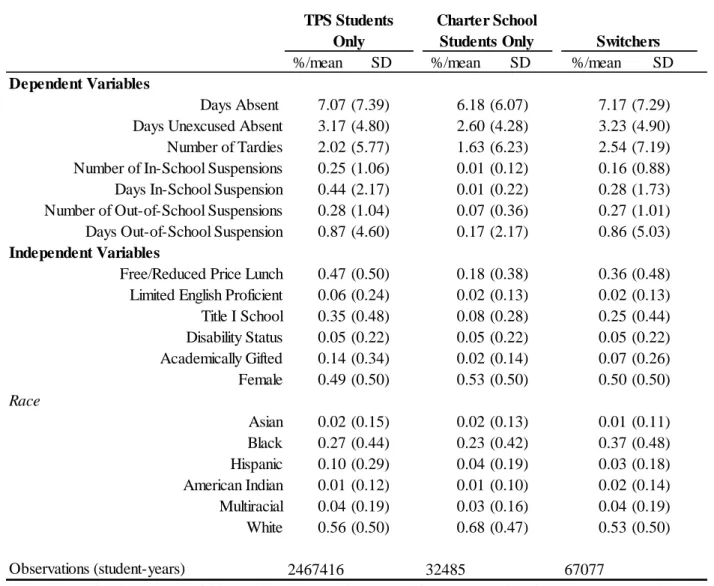
Examining the differences in the characteristics of charter school only students, TPS only students and switchers illustrated that, overall, switchers appear to be negatively selected
compared to charter school only students (Table 3.2). Switchers are more likely to be absent, tardy, and suspended than charter school only students. Additionally, switchers are more likely to be eligible for free or reduced price lunch (36% vs. 18%), to attend a Title I school7 (25% vs. 8%) and to be black (37% vs. 23%) than charter school only students. The majority of charter school only students are white (68%). Similar shares of disabled (5%) and LEP students (2%) were switchers and charter school only students. Due to switchers being negatively selected, the results from the student fixed effects model will most likely underestimate the effect of charter schools on students’ behavioral outcomes.
Among absences, unexcused absences, and tardies, the effect of charter schools varied (Table 3.3). For the outcome, days absent, charter schools are associated with a statistically significant decrease in the number of days absent in all model specifications. Using the student fixed effects model, a charter school student misses .28 days less than a TPS student. Therefore, attending a charter school is associated with a modest decrease in the average number of days a student is absent. The effect of charter schools on the number of unexcused absences varies depending on the model specification; the pooled OLS and student random effects models show that charter school students have fewer unexcused absences compared to TPS students. However,
7Similar to TPSs, public charter schools can receive Title I funds and are still held accountable for making adequate
using the student fixed effects model, charter school students have .17 more days of unexcused absences compared to TPS students. In other words, switchers, or students with worse
background characteristics, have fewer unexcused absences. Finally, charter schools have no statistically significant effect on the number of days a student is tardy.
In all model specifications, charter school students had fewer and shorter in-school and out-of-school suspensions compared to TPS students (Table 3.4). Both the student random and fixed effects models on the days of in-school suspensions show that charter school students have shorter in-school suspensions, equating to about half a day, compared to TPS students. Using student random effects, charter school students' out-of-school suspensions are a little more than half a day (.62) shorter compared to TPS's out-of-school suspensions. The student fixed effects model shows that charter school students out-of-school suspensions are about one day (.92) shorter compared to those in TPSs.