On the Feasibility of Quantifying Fibrous Cap Thickness with
Acoustic Radiation Force Impulse (ARFI) Ultrasound
Tomasz J. Czernuszewicz and
Joint Department of Biomedical Engineering, University of North Carolina and North Carolina State University, Chapel Hill, NC, USA
Caterina M. Gallippi
Joint Department of Biomedical Engineering, University of North Carolina and North Carolina State University, Chapel Hill, NC, USA. Department of Electrical and Computer Engineering, North Carolina State University, Raleigh, NC, USA
Caterina M. Gallippi: [email protected]
Abstract
Acute cerebrovascular accidents are associated with the rupture of vulnerable atherosclerotic plaques in the carotid arteries. Fibrous cap thickness has been shown to be an important predictor of plaque rupture, but has been challenging to measure accurately with clinical noninvasive imaging modalities. The goals of this investigation were first, to evaluate the feasibility of using transcutaneous acoustic radiation force impulse (ARFI) ultrasound to quantify fibrous cap thickness and second, to optimize both imaging and motion tracking parameters to support such measurements. Fibrous caps with varying thickness (0.1 – 1.0 mm) were simulated using a simple layered geometry, and their mechanical response to an impulse of radiation force was solved using finite element method (FEM) modeling. Ultrasound tracking of FEM displacements was
performed in Field II utilizing three center frequencies (6, 9, and 12 MHz) and eight motion tracking kernel lengths (0.5λ – 4λ). Additionally, fibrous cap thickness in two carotid plaques imaged in vivo was measured with ARFI and compared to matched histology. The results of this study demonstrate that 1) tracking pulse frequencies around 12 MHz are necessary to resolve caps around 0.2 mm, 2) large motion-tracking kernel sizes introduce bias into thickness measurements and overestimate the true cap thickness, and 3) color saturation settings on ARFI peak
displacement images can impact thickness measurement accuracy substantially.
Index Terms
ARFI; acoustic radiation force; fibrous cap; atherosclerosis; vulnerable plaque; FEM; resolution
I. Introduction
Ischemic stroke is one of the leading causes of death and long-term disability in the United States [1]. A significant proportion of ischemic strokes are the downstream effect of atherosclerotic plaque rupture in the carotid distribution, and are prophylactically treated by surgical interventions such as carotid endarterectomy (CEA) to remove the source of emboli. CEA is commonly performed on the basis of carotid stenosis; however, patients must also be
HHS Public Access
Author manuscript
IEEE Trans Ultrason Ferroelectr Freq Control
. Author manuscript; available in PMC 2017 September 01.Published in final edited form as:
IEEE Trans Ultrason Ferroelectr Freq Control. 2016 September ; 63(9): 1262–1275. doi:10.1109/TUFFC. 2016.2535440.
A
uthor Man
uscr
ipt
A
uthor Man
uscr
ipt
A
uthor Man
uscr
ipt
A
uthor Man
uscr
experiencing symptoms in order for CEA to be most effective [2], although in many cases strokes can occur without any prior symptoms. In asymptomatic patients, even with high degrees of stenosis (>70%), CEA is only moderately successful at preventing future stroke [3], with some calling its use into question given advancements in pharmaceutical
management of atherosclerosis [4]. Extensive studies in the coronary arteries have
demonstrated that plaques producing non-flow-limiting stenoses (typically <70%, but often <50%) account for more cases of plaque rupture and thrombosis than plaques with more severe stenoses [5]. Based on these trends, many have concluded that stenosis alone is an inadequate biomarker for grading plaque vulnerability and instead have proposed stratifying risk on plaque morphology and composition [6].
Previous studies have shown that a major determinant of carotid plaque vulnerability is fibrous cap (FC) thickness [7], [8]. In the Oxford Plaque Study [7], one of the largest histological studies done on carotid plaque, the authors reported that a minimum FC thickness of <0.2 mm and a representative FC thickness of <0.5 mm were associated with plaque rupture [8]. Therefore, an ideal noninvasive carotid plaque imaging system should be able to resolve mean FC thickness of 0.5 mm or less in order to detect plaques that may be vulnerable to rupture.
Among noninvasive imaging technologies, magnetic resonance imaging (MRI) was the first to report direct measurement of FC thickness in vivo with resolution down to 0.25 mm [9]– [11]. Subsequent prospective MRI studies demonstrated that the presence of a thin/ruptured FC carried the highest hazard ratio (HR: 17.0) for future cerebrovascular event compared to all other plaque features [12]. High-resolution computed tomography (CT) has also been shown to be sensitive to FC thickness in small sample patient studies [13]. However, wide-scale implementation of MRI and CT technology may be precluded due to the high monetary cost of both modalities, ionizing radiation in the case of CT, and specialized surface coils in the case of MRI that are necessary to achieve the appropriate resolution for FC thickness measurement.
Given the relevance of FC thickness to predicting future ischemic event [12], implementing a cost-effective, ultrasound-based imaging solution to noninvasively quantify FC thickness may be highly impactful and could revolutionize plaque risk stratification. Indeed, high-resolution B-mode assessment of FC thickness was proposed a decade ago by Devuyst et al. [14], with the authors demonstrating that thicknesses of <0.65 mm were associated with cerebrovascular symptoms. However, despite these promising initial results, there has been a notable lack of publications on the topic, and measuring FC thickness has not seemed to translate into the clinic. One explanation could be that ultrasound does not have the resolution capability to measure fibrous cap thickness; indeed, in Devuyst et al. [14], the axial and lateral resolutions of the transducer were 0.3 mm and 0.4 mm, respectively, which are only slightly better than the <0.5 mm mean critical cap thickness proposed by Redgrave et al [8]. Additionally, studies have shown that the inherent contrast in echogenicity between fibrous and necrotic components is highly variable, which leads to conflicting performance results when utilizing echogenicity outside of a highly-controlled research setting [15]. Therefore, ultrasound FC thickness measurement may be improved with ultrasound methods that do not strictly rely on echogenicity, in addition to the use of higher resolution probes.
A
uthor Man
uscr
ipt
A
uthor Man
uscr
ipt
A
uthor Man
uscr
ipt
A
uthor Man
uscr
One alternative ultrasonic method that has been proposed for plaque characterization is acoustic radiation force impulse (ARFI) ultrasound [16]. In ARFI, long-duration ultrasound pulses (~100 μs) are used to induce μm-order displacements in tissue to qualitatively infer tissue stiffness. The literature supporting the use of ARFI for vascular and atherosclerosis applications has been growing rapidly [17]–[27]. These studies suggest that ARFI can discriminate necrotic/lipid from fibrous/calcified regions, which appear as areas of relatively-high displacement and relatively-low displacement, respectively. Anecdotally, some of these studies have shown that ARFI can visualize a FC in vivo as an area of low-displacement covering an area of high-low-displacement [26], however, the capability to quantify FC thickness has yet to be rigorously explored.
The objective of this study was to analyze the feasibility of ARFI imaging for
transcutaneous measurement of FC thickness by using finite element method (FEM) and Field II-based simulations [28], [29] and by analysis of in vivo performance. A simple FEM mesh with multiple layers representing lumen, FC, and necrotic core (NC) is developed and ARFI is simulated for a range of FC thicknesses. Various imaging and signal processing parameters are investigated to determine their impact on thickness measurement. Based on work previously done in compressive elastography [30] and time-delay estimation
simulations [31], it is hypothesized that the resolution of ARFI for detecting FC thickness will be mainly dictated by the imaging pulse center frequency, and the length of the motion tracking kernel size. Additionally, we hypothesize that mechanical interaction between the FC and NC and ARFI displacement underestimation may influence FC measurement performance. These hypotheses are first tested in silico and then demonstrated clinically for two fibroatheromatous carotid plaques with validation by spatially-matched histology [26]. Overall, this study serves as a first evaluation of transcutaneous ARFI’s ability to quantify FC thickness.
II. Methods
A. Finite Element Method Simulations
Soft tissue dynamics in response to an impulse of acoustic radiation force were simulated using previously developed finite element method (FEM) models [29] utilizing LS-DYNA (Livermore Software Technology Corporation, Livermore, CA), a commercially-available multi-physics solver. A fibrous cap covering a necrotic core was abstracted as a thin layer of stiff material covering a layer of soft material (Figure 1). Ten FEM models were generated with FC thicknesses of 0.1 mm to 1 mm, all covering a soft NC region with thickness of 1 mm. The models implemented a rectangular mesh with 131,712 elements with variable node spacing and quarter-symmetry boundary conditions about the transducer’s axis of symmetry. The non-symmetry faces as well as the bottom face of the mesh were fully constrained, while the top face of the mesh (representing the lumen/FC border) was left unconstrained. From the axis of symmetry, the mesh extended 5.5 mm in the lateral dimension and 5.5 mm in the elevational dimension, and 20 mm in the axial dimension (with a 20 mm offset from the transducer face). Nodal spacing in the region of the FC and NC was set to 0.02 mm, while the rest of the mesh was 0.25 mm. The fine nodal spacing the region of the FC was necessary in order to have multiple elements in the thinnest simulated FC (0.1 mm)
A
uthor Man
uscr
ipt
A
uthor Man
uscr
ipt
A
uthor Man
uscr
ipt
A
uthor Man
uscr
Following the methods of Ohayon et al. [32], fibrosis was modeled as stiff transversely-isotropic material, while NC was modeled as soft transversely-isotropic material using predefined material models in LS-DYNA. For FC, LS-DYNA material model *MAT_002 (a linear, orthotropic, elastic model) was implemented with the same mechanical properties in the circumferential (θ) and longitudinal (z) directions and different ones in the radial (r) direction, while NC was implemented with *MAT_001 (a linear, isotropic, elastic model). The mesh was oriented such that the radial direction corresponded to the axial direction of the ultrasound transducer, while longitudinal and circumferential directions corresponded to lateral and elevational directions, respectively. Specific material parameters for both material models are given in Table I. A perfect matching layer (PML), six elements wide, was defined around the mesh to simulate an infinite medium and remove spurious wave reflections from the boundaries of the model. The PML was implemented using the built-in PML models *MAT_230 (isotropic elastic) and *MAT_245 (orthotropic elastic) and matched to the material parameters of the NC and FC, respectively.
As described in [29], the ARF field was simulated by first computing the acoustic intensity at each nodal location using Field II, a linear acoustics modeling package [33], [34]. A transducer was simulated using xdc_focused_array with a transmitting frequency of 4.2 MHz and focal configuration of F/1.5. Field II-derived intensity values were converted to point-load forces (F⃗) using the expression [28]:
(1)
where α is the absorption coefficient of the medium (assumed to be 0.5 dB/cm/MHz), I⃗ is the temporal-average beam intensity, and c is the speed of the sound through the medium (assumed to be 1540 m/s). Point loads were then superimposed on the FEM mesh, and a load curve was defined to simulate a 70-μs ARF burst starting at 0.2 msec. The simulation was allowed to run for 4 ms total, and data were sampled every 0.1 ms, approximating a conventional ARFI ensemble with 10 kHz pulse repetition frequency (PRF). Note that luminal blood was not simulated with the FEM model, but implemented within the ultrasound simulation described below.
B. Ultrasound Simulation
The method of simulating ultrasound imaging of ARF-induced dynamics and luminal blood flow was adapted from those described by Palmeri et al. [28]. First, a three-dimensional Field II scatterer phantom with fully-developed speckle (11 scatterers per resolution cell) was defined to span a volume of 11 mm × 11 mm × 40 mm (lateral × elevation × axial). Nodal displacements output by LS-DYNA were loaded into MATLAB (Mathworks Inc., Natick, MA) and used to linearly-interpolate scatterer positions for every time step in the ARFI ensemble. To simulate a lumen, a wall-less, 3-mm radius tube of scatterers running parallel to the transducer face (i.e. in the lateral direction) was defined above the FC (which was positioned at 20 mm in the Field phantom). The lumen scatterers were translated at 100 cm/s with a parabolic flow profile to simulate carotid blood flow, and were assigned
A
uthor Man
uscr
ipt
A
uthor Man
uscr
ipt
A
uthor Man
uscr
ipt
A
uthor Man
uscr
amplitudes 10 times less (−20 dB) than scatterers in the FC and NC. A percentage of scatterers in the lumen (10%) were kept stationary with full backscatter amplitude to represent clutter that is typically present in vascular ultrasound imaging. Overall, 20 unique phantoms with independent speckle realizations were generated.
Three imaging transducers with varying center frequencies (6 MHz, 9 MHz, and 12 MHz) were defined in Field II using xdc_focused_array to investigate the impact of tracking frequency on FC thickness measurement. All other relevant transducer parameters are given in Table II. Two-dimensional ARFI acquisitions were simulated by translating each scatterer phantom laterally from −2.1 mm to 2.1 mm in steps of 0.35 mm. At each lateral position, RF data from each time step in the ARFI ensemble was calculated with Field II.
C. Processing of Tracked Data
After generating all the RF data, white Gaussian noise was added to each RF line in the ensemble prior to motion tracking using the awgn function in MATLAB to simulate 40 dB electronic signal-to-noise ratio (SNR). This SNR was chosen to represent the empirically-measured SNR of a Siemens Acuson Antares with VF7-3 linear array imaging at a focal depth of 20 mm. Ensembles were motion tracked with one-dimensional normalized cross-correlation with parabolic interpolation using kernel lengths ranging from 0.5λ to 4λ [31]. Two-dimensional peak displacement (PD) images were then rendered by taking the maximum displacement at each axial position, resulting in 4,800 images for analysis (3 frequencies × 8 kernel sizes × 20 speckle realizations × 10 FC thicknesses).
D. Fibrous Cap Thickness Measurement
Due to the large number of images in the data set, a semi-automatic FC thickness
measurement algorithm was developed that utilized simple k-means clustering (Figure 2). First a 2D ARFI PD image was loaded and cropped between axial depths 19 and 24 mm, which approximated the ARFI depth-of-field for the simulated ultrasonic parameters. Next the image was saturated to an ideal color scaling based on the FEM simulated
displacements. Because PD was variable with various thicknesses of FC, a different color scaling was chosen for each thickness, and was calculated as a percentage of the distance between the FEM-measured PD in the FC and NC using a simple formula,
(2)
where PDmax is the upper-limit of the PD dynamic range, PDn and PDf are the FEM-measured peak displacements in the NC and FC respectively, and β represents a fractional multiplier (0 ≤ β< 1). A β-value of 0 represents the case where the image is scaled based on the maximum displacement of the NC. A β-value greater than 0 represents an increasing amount of color saturation, which ultimately decreases the dynamic range of the PD image. The importance of color scaling is discussed in more detail in the following sections.
Next, the saturated image was passed into the kmeans function in MATLAB with the following parameters: cluster size of 4, uniform selection of initial cluster centroid positions,
A
uthor Man
uscr
ipt
A
uthor Man
uscr
ipt
A
uthor Man
uscr
ipt
A
uthor Man
uscr
and 60 replicates. After clustering was complete, the cluster number corresponding to the FC had to be identified. This was done by taking the mode of the cluster map of all lateral locations at the axial position corresponding to the midpoint of the fibrous cap. With the FC cluster number identified, the largest contiguous cluster in this grouping was identified using bwlabel, and average thickness was measured by determining the top and bottom pixel of the cluster at each lateral location and calculating the median top/bottom across each image. If the largest contiguous cluster did not span the entire lateral extent of the ARFI image, this indicated that the FC was not identified correctly or was otherwise not identifiable under the given imaging conditions and was assigned a value of NaN. This process was then repeated for every 2D ARFI image in the data set. An example of clustering and FC thickness measurement for a 0.5 mm FC thickness imaged at 9 MHz with a 1.5λ tracking kernel is given in Figure 3.
Finally, a simple outlier rejection algorithm [35] was implemented to remove faulty clustering and spurious FC thickness measurements. For each simulated FC thickness, 20 measurements were taken representing one measurement from each speckle realization. Outliers were defined as any measurements that exceeded 3-times the median absolute deviation (MAD) of the given sample [35]. These data sets were rejected from the final analysis.
E. Additional Performance Metrics
In addition to measuring FC thickness, a number of metrics were computed across the simulations to characterize FC measurement performance. These metrics included contrast (C) and contrast-to-noise ratio (CNR) of the FC and NC, and were calculated using the following equations [36]:
(3)
(4)
where μf and μn are the mean PD in the FC and NC, respectively, and σf and σn are the standard deviations of PD in the FC and NC, respectively. Contrast and CNR were computed for both saturated and unsaturated ARFI images.
F. Comparison with In Vivo Data
To validate simulation results, data were compared against two in vivo examples of carotid plaque with histologically-verified fibrous caps [26]. As was done in the simulation study, in vivo data were motion tracked with eight kernel sizes whose length was determined with respect to the center frequency of the tracking pulses (6.15 MHz). To analyze the impact of color scaling, in vivo images were scaled using an adaptive algorithm that was previously
A
uthor Man
uscr
ipt
A
uthor Man
uscr
ipt
A
uthor Man
uscr
ipt
A
uthor Man
uscr
described in our ex vivo ARFI study [25]. Plaque outlines were first segmented by hand, and then the upper bound of the dynamic range of the ARFI image was set to the median + 2*MAD peak displacement calculated from the plaque outline. For additional test cases, images were also scaled to median + 4*MAD, and also scaled to the maximum PD within the necrotic core (representing an “unsaturated” image, similar to the β = 0 case described for the simulations). From these data sets, average fibrous cap thickness was measured from images by hand by drawing multiple lines using the imdistline tool in MATLAB.
Additionally, contrast and CNR were calculated between the FC and NC by drawing regions of interest around each respective feature and using the equations described above.
III. Results
To demonstrate the similarity between in silico and in vivo imaging scenarios, individual simulated ARFI lines were first compared against a clinical ARFI image of a carotid plaque [26]. Figure 4a) shows a plot of PD versus axial depth (oriented such that axial depth is on the Y-axis) taken from the 31st lateral location (3.63 mm) of the ARFI image shown in Figure 1. Figure 4(b) shows a corresponding simulation data set for an FC thickness of approximately the same size (~1 mm). Data in the in vivo image was tracked with 6.15 MHz and 1.5λ kernel, and is compared against a simulated data set at 6 MHz and 1.5λ kernel. In the in vivo example, PD in the FC (axial positions 24.5 mm to 25.5 mm) was approximately 1 μm while PD in the NC (axial positions 25.7 mm to 27.2 mm) reached as high as 13 μm. Similarly, the simulation predicted low displacement in the FC (axial positions 20 mm to 21 mm) of approximately 2 μm, and high displacement in the NC (axial positions 21 mm to 22 mm) of approximately 10 μm. Ultrasonic tracking of PD in the region of the NC
underestimated the true PD by approximately 4 μm. This example suggests there was acceptable agreement between the FEM-simulations and data taken in vivo in a real carotid plaque.
Figure 5 shows the FEM-predicted PD profiles for all ten FC thicknesses simulated in this study, as well as a comparison of FEM-derived FC thickness measured as the full-width half-max (FWHM) between the FC and NC. The top row of images shows the results with no PD saturation (β = 0), while the bottom row of images shows the results with substantial PD saturation (β = 0.75). These simulations demonstrate that PD in the NC decreases as a function of FC thickness, suggesting that plaques with thin FCs may appear “softer” in ARFI images. Interestingly though, Figure 5(a) and (b) suggest that FC thickness measurements made with ARFI may experience a substantial positive bias (0.19 ± 0.01 mm), particularly if the full dynamic range of PD is utilized. This bias arises not from ultrasonic imaging parameters, but rather from mechanical coupling between the stiff FC and soft NC. Coupling between these regions produces a gradient of PD at the interface between the layers, which changes the perceived location of the FC/NC edge. As
demonstrated in Figure 5(c) and (d), the positive bias can be reduced substantially to 0.06 (± 0.016) mm if PD saturation is employed to reduce the dynamic range; however, no amount of saturation can remove it completely. This is depicted graphically in Figure 6, which shows the reduction of bias as a function of image saturation level.
A
uthor Man
uscr
ipt
A
uthor Man
uscr
ipt
A
uthor Man
uscr
ipt
A
uthor Man
uscr
Figure 7 and Figure 8 show examples of 2D simulated ARFI images for all ten FC thicknesses taken at 6 MHz and 12 MHz, respectively, with adaptive color scaling. The absolute motion tracking kernel length was kept constant (0.257 mm) for both tracking frequencies, using a 1λ kernel at 6 MHz and 2λ kernel at 12 MHz. In these images, the FC is denoted as a region of relatively low displacement (located between axial positions 20 mm and 21 mm), with the NC appearing as a region of high displacement directly below the FC regions. As expected based on the motion-tracking kernel size, the stiff FC layer is difficult to resolve when is it 0.1 – 0.2 mm thick; however, at 0.3 mm it becomes readily identifiable, particularly at the 12 MHz frequency. Qualitatively, the images at 6 MHz appear notably worse (layer edges are less distinct, contrast is poorer, etc.) than at 12 MHz, despite having identical motion tracking kernel lengths, suggesting that higher frequency tracking is critical to FC thickness measurement performance.
These qualitative observations are confirmed in Figure 9, which compares the ARFI-derived FC thickness to the true simulated thickness. Figure 9 depicts the results with respect to relative wavelength-based kernel sizes. In each of these graphs, the dotted line represents the line of equivalency. Cases where the algorithm failed to measure a FC thickness (i.e. values assigned as NaN) are not depicted and serve as a lower limit for FC resolution for a given frequency and kernel size. A number of observations can be made from these results: 1) no combination of imaging parameters were able to resolve FC thicknesses of 0.1 mm, 2) the smallest resolvable FC with 6 MHz was 0.3 mm, while the smallest with 9 and 12 MHz was 0.2 mm, 3) positive bias and variance of FC measurement are inversely proportional to tracking frequency and directly proportional to kernel size. Figure 10 summarizes the results of FC detection accuracy by depicting bias as a function of kernel size and frequency, averaged across all thickness simulations. The lowest mean bias was achieved by a 0.064 mm (0.5λ) kernel at 12 MHz, however the variance on the estimates was higher compared to the next best performing kernel (0.128 mm kernel, or 1λ, at 12 MHz).
The results for contrast are shown in Figure 11. In general, contrast increased as a function of frequency and FC thickness, and decreased as a function of kernel size and saturation level. The mean improvement in contrast between 6 MHz and 12 MHz was 1.8 (± 0.14) dB, however 12 MHz still underestimated the true tissue contrast by 2.1 (± 0.39) dB when saturation was not employed, which can be explained by displacement underestimation due to shearing [28], [37]. As PD saturation level increased, the inherent contrast in PD between the FC and NC was reduced proportionally, but the reduction in contrast due to displacement underestimation was mitigated. At significant levels of saturation (β = 0.75), the contrast achieved by 9 MHz and 12 MHz tracking was nearly identical. Regarding kernel length, both very small and very large kernel sizes tended to have poorer contrast, compared to intermediate kernel sizes. Specifically, in the 9 MHz and 12 MHz cases, there is a clear inflection point that occurs around the 1λ kernel size, where the contrast is maximized. Interestingly, at high levels of image saturation, the difference in contrast between small and large kernels was not as pronounced.
The results for CNR are shown in Figure 12. Like contrast, CNR increased as a function of frequency and FC thickness, and decreased as a function of kernel size. However, unlike contrast, which decreased as function of saturation level, CNR increased as a function of
A
uthor Man
uscr
ipt
A
uthor Man
uscr
ipt
A
uthor Man
uscr
ipt
A
uthor Man
uscr
saturation level. The mean improvement in CNR between 6 MHz and 12 MHz was 0.36 (± 0.05) with no color saturation, and increased to 0.66 (± 0.20) with the highest level of saturation (β = 0.75). Interestingly, the kernel size that maximized CNR actually changed as a function of FC thickness. This trend was different from that seen with contrast, which was typically maximized with small kernel sizes (i.e. 1λ) regardless of FC thickness
Figure 13, shows FC thicknesses measured from two carotid ARFI images taken in vivo [26]. Panels A and B (example 1) show the PD image and histology (combined Masson elastin stain; collagen in green) for a Type Va plaque in the common carotid of a symptomatic 57-year-old male. Panels C and D (example 2) show the PD image and histology (Lillie’s-modified Masson’s trichrome stain; collagen in blue) for a Type Va plaque in the internal carotid artery of a 53-year-old symptomatic female. In example 1, mean ARFI-derived FC thickness was 1.31 (± 0.07) mm and histology-derived mean thickness was 1.18 (± 0.30) mm, representing an 11.0% overestimation by ARFI. In example 2, mean ARFI-derived FC thickness was 0.92 (± 0.13) mm and histology-derived mean thickness was 0.88 (± 0.26) mm, representing a 4.6% overestimation by ARFI. Both images were captured with a tracking frequency of 6.15 MHz and processed with a 0.25 mm (1λ) kernel.
Figure 14 depicts the impact of kernel size and dynamic range on the two in vivo examples. ARFI images from example 1 are shown with four different kernel sizes (0.5λ, 1.5λ, 2.5λ, and 3.5λ) and two different dynamic ranges (maximum PD values set to 2.7 μm
corresponding to median + 2*MAD and 4.2 μm corresponding to median + 4*MAD). FC measurements are illustrated on the ARFI images as white lines, and average FC thickness for all eight kernel sizes and two dynamic range settings are quantified in the plot on the right. As predicted from the simulation results, higher kernel sizes introduced higher positive bias into the FC measurements. The magnitude of bias from kernel size in the in vivo examples (~0.4 mm with a 4λ kernel) was moderately larger than predicted by simulation (~0.25 mm). Additionally, larger dynamic range (akin to lower β values) also resulted in higher positive bias, again mirroring the simulations results.
Finally, in vivo results for contrast and CNR are shown in Figure 15. In this figure, data from the dynamic range with the lowest positive bias (i.e. median + 2*MAD) is graphed alongside data from an “unsaturated” dynamic range (i.e. the maximum PD in the necrotic core). As predicted from the simulations (Figure 11(c, f) and Figure 12(c, f)), saturation decreased contrast but increased CNR. The magnitude of decrease and increase varied between examples, with example 1 demonstrating the largest decrease in contrast (~6 dB) and increase in CNR (~0.5) with saturation. Interestingly, the overall magnitude of CNR in the in vivo examples was moderately lower than in simulation. For example, in simulations with 1.0 mm FCs and utilizing color saturation, the CNR values exceeded 1.5, however in vivo the color-saturated CNRs were closer to 1.0.
IV. Discussion
In this study, a simulation framework for testing the capability of ARFI imaging to quantify the thickness of thin, mechanically-stiff layers, representing atherosclerotic fibrous caps, was
A
uthor Man
uscr
ipt
A
uthor Man
uscr
ipt
A
uthor Man
uscr
ipt
A
uthor Man
uscr
presented. As mentioned previously, to be clinically relevant for vulnerable carotid plaque characterization, an ARFI system should be capable of accurately detecting plaques with an average FC thickness of <0.5 mm and/or a minimum thickness of <0.2 mm. The results of this simulation study suggest that 0.2 mm is the lower limit of ARFI’s detection potential even with optimal imaging parameters, so while measuring caps less than 0.2 mm may be challenging, measuring caps around 0.5 mm should be feasible.
Three specific imaging parameters were explored in this study in detail – center frequency, kernel size, and image saturation level. Center frequency and kernel size can be considered to have directly physical effects on the ARFI PD parameter. For example, center frequency defines the size of the imaging point spread function (PSF), and all displacements
underneath the spatial extent of the PSF will be averaged into one measurement. If the PSF spans a region that includes both soft and stiff tissue with variable displacement, the resulting PD measurement will be an average of the two (i.e. a spatial low-pass filter). It is well known that increasing center frequency improves the resolution of ultrasonic imaging, and, specifically in the context of ARFI imaging, has the added benefits of reducing motion tracking jitter [38] and increasing contrast by mitigating displacement underestimation from shearing [28]. Although the results shown in Figure 9 suggest that both the 9 MHz and 12 MHz tracking pulses performed similarly in terms of the smallest detectable FC (0.2 mm), the 12 MHz tracking pulses attained the lowest amount of positive bias (Figure 10), the highest contrast values (Figure 11), and the highest CNR values (Figure 12). This was mostly likely due to the shortened pulse length at higher frequencies (fractional bandwidth for each simulated transducer was held constant at 60%).
To date, ARFI plaque characterization in clinical studies has been implemented with 6 MHz [26] and 9 MHz [27] tracking pulses, but 12 MHz sequences have yet to be tested in vivo. At such high frequencies, depth of penetration may be an issue, however 12 MHz B-mode is currently the upper limit that is utilized in the clinic for carotid imaging [39], suggesting this frequency may be relevant in an ARFI setting as well. Another practical challenge for implementing ARFI with a 12 MHz tracking pulse is the requirement of increased transducer bandwidth in order to maintain a low center frequency for the ARFI pushing pulses. In this simulation study, the pushing pulse was kept constant at 4 MHz, which has typically been used in carotid ARFI studies done in vivo. Therefore, a transducer that can push at 4 MHz and track at 12 MHz would require a center frequency of 8 MHz and a minimum fractional bandwidth of 100% (or alternatively, a transducer centered at 12 MHz with fractional bandwidth of 67%). While this bandwidth requirement is high, advancements in transducer materials and design have demonstrated the capability of operating at greater than 100% bandwidth [40] suggesting this hurdle may be overcome as well.
In regards to kernel size, smaller kernel sizes were necessary to achieve more accurate measurement of the FC. As with frequency, kernel size has a direct physical effect on ARFI PD measurements. As kernel size increases, it becomes more difficult to separate focal areas of high or low displacement that fall underneath the spatial extent of the kernel and
averaging/blurring occurs. For each center frequency that was tested, the smallest kernel size (0.5λ) resulted in the lowest positive bias (Figure 10). However, these kernel sizes also yielded lower CNR values (Figure 12) when compared to larger kernel sizes (e.g. 1λ or
A
uthor Man
uscr
ipt
A
uthor Man
uscr
ipt
A
uthor Man
uscr
ipt
A
uthor Man
uscr
1.5λ), indicating higher variance (i.e. jitter) in motion tracking. These results are consistent with previous studies [31] that reported a tradeoff between bias and jitter when utilizing small, sub-wavelength kernel sizes. When kernel sizes become too small, corruptive jitter dominates the measurements and obviates the marginal improvement in bias. Notably, using large kernel sizes (e.g. 3λ or 4λ) also resulted in poor FC thickness measurement
performance, as seen by the increased positive bias (Figure 10 and Figure 14), reduced contrast (Figure 11 and Figure 15), and even a reduction of CNR in some cases (Figure 12 and Figure 15). The benefits of using a large kernel are mainly related to the reduction in jitter; however, due to the thin size of the feature being measured, large kernel sizes quickly exceed the size of the FC and cause undesirable averaging and smoothing to occur, making their implementation impractical in this application of ARFI. Therefore, based on the simulations and preliminary in vivo results, a kernel size of 1λ or 1.5λ is recommended for clinical implementation of FC thickness measurement.
Lastly, image color saturation was determined to be highly important for accurate
measurement of the FC. Unlike frequency and kernel size, which are implemented prior to computing PD, color saturation is applied after calculation of PD and controls the
visualization of the FC. As seen in Figure 5 and Figure 6, the ideal saturation level (i.e. the saturation level that gives the most accurate FC thickness measurement) occurs when the maximum PD in the image is capped to a certain percentage above the PD in the FC. By saturating the image, the inherent contrast in PD between the FC and NC is reduced (Figure 11) in order to improve bias. Interestingly, high levels of saturation can obviate the impact of displacement underestimation, which substantially reduces the PD measured in the soft NC and ultimately reduces contrast from the FC. This effect can be observed in Figure 11(d,e,f) where the ARFI-measured contrast nearly matches the FEM- measured contrast after saturation. Further, saturation improves the CNR metric, as seen in Figure 12(d,e,f), due to the reduction in PD variance in the NC.
In the simulations, the image saturation level was chosen adaptively based on the known FEM displacements in the regions of FC and NC. In practice, these PD values are not known a priori, making adaptive color saturation one of the most significant challenges for ARFI in this application. In order for ARFI to be able to consistently quantify FC thickness, a standardized color scaling algorithm will need to be developed. Our group has previously proposed setting the color scaling based on the median PD measured within ex vivo plaque samples [25], and was utilized for the two clinical examples presented in Figure 13. In both cases, the chosen color scaling demonstrated good contrast between the NC and the FC, and the positive bias in the ARFI-derived thickness measurements (0.13 mm and 0.04 mm) agreed with the predicted bias of 0.13 (± 0.05) mm for the corresponding frequency and kernel size (Figure 10) suggesting appropriate color scaling was used. However, due to the limited number of in vivo cases, further studies are necessary to determine if this color scaling algorithm is relevant for wide-scale application to carotid ARFI images.
There were a number of potential limitations in this study. First, all simulated FCs were highly idealized, oriented perfectly orthogonal to the axial direction of the transducer, and were of homogeneous thickness and stiffness across the lateral dimension. In reality, as seen in Figure 13, plaques may have curvature, may be imaged at non-90° angles relative to the
A
uthor Man
uscr
ipt
A
uthor Man
uscr
ipt
A
uthor Man
uscr
ipt
A
uthor Man
uscr
transducer due to patient anatomy, may have variable thickness across the lateral field of view, and may have local points of weakness due to macrophage degradation of the collagen matrix. When the plaque is at an oblique angle to the transducer, the lateral resolution will become an important factor in FC thickness measurement performance. As with
conventional ultrasound, the lateral resolution of an ARFI system is expected to be worse than the axial resolution, and displacements may experience more averaging bias due to side lobes of the tracking point spread function, which may explain the increased kernel bias observed in the in vivo data set as compared to the simulation (Figure 14). Therefore, it is predicted that utilizing the highest tracking frequency may be even more beneficial to making FC thickness measurements in vivo than shown in this manuscript.
A second limitation to this study was in the modeling of the layer interfaces, specifically the lumen/FC interface and the FC/NC interface. The lumen/FC interface was not simulated with FEM, meaning that the mechanical interaction between lumen and the FC was not evaluated in this study. Furthermore, the effect of blood pressure was also not evaluated. It is likely that the forces exerted on the FC by pulsating blood may impact displacements measured with ARFI and potentially affect the contrast between the necrotic core and fibrous cap. The similarity between simulation and in vivo data (captured during diastole) though, suggest that the stiffnesses of the various plaque components were representative of actual plaques. The effects of blood pressure will be considered in future studies.
Regarding the FC/NC interface, as shown in Figure 5, mechanical coupling between the FC and NC layers significantly impacted bias in layer thickness measurement. It is unclear whether this coupling accurately modelled the mechanical interaction between the two features in vivo. Indeed, NCs have sometimes been described as “semi-solid” [41], and previous studies have shown that atheroma lipids can exist in any of three states; liquid, liquid crystalline, or crystalline [42], suggesting the mechanical coupling between the FC and NC may be more complicated, e.g. as a fluid-solid interaction. Anecdotal evidence from our two in vivo examples suggests sharper transitions between the FC and NC, which could indicate a weaker mechanical coupling than was modelled in this study; however, more data need to be collected before this observation can be confirmed.
Lastly, although the k-means clustering algorithm presented in this manuscript was mainly developed in order to standardize the FC thickness measurement, it may have potential to be extended to in vivo data as well. For this simulation study, four clusters adequately
delineated the various components of the simulated ARFI images. However, in practice, it is expected that more clusters will be necessary to adequately capture the multiple tissue types and stiffnesses present in a real plaque (e.g. calcium, which was not simulated in this study). Our group has previously explored utilizing k-means clustering, in addition to principal component analysis, for robust plaque segmentation in porcine atherosclerosis [43], and found that six clusters were necessary for adequate separation. Additionally, because plaques may have curvature or be imaged at oblique angles, the simple thickness measurement from the FC cluster will not be applicable to in vivo data. Measuring thickness after clustering will most likely require sophisticated signal processing approaches, such as active contour modelling [14], to identify the luminal and necrotic core edges within the FC cluster.
A
uthor Man
uscr
ipt
A
uthor Man
uscr
ipt
A
uthor Man
uscr
ipt
A
uthor Man
uscr
V. Conclusion
Overall, this study has demonstrated the feasibility of quantifying the thickness of thin, stiff layers with transcutaneous ARFI imaging and provides insight into the factors impacting ARFI’s ability to quantify fibrous cap thickness in carotid plaques. The FEM results revealed that mechanical coupling between the stiff and soft layer may introduce substantial positive bias into the ARFI measurements. To counteract this positive bias, image contrast saturation can be utilized to reduce the dynamic range of the ARFI image and improve the thickness measurement. Regarding ultrasonic tracking parameters, the results suggest that utilizing high center frequency tracking pulses (12 MHz) achieve the best thickness measurements as seen by the lower bias, higher contrast, and higher CNR. The results also demonstrated that motion-tracking kernel size can have a large impact in thickness
measurements performance; setting the kernel too small will cause large amount of jitter and decrease CNR, while setting the kernel too high will introduce large amounts of positive bias. In each case, using a kernel size of approximately one wavelength gave the optimal balance between bias, contrast, and CNR. In two in vivo clinical examples, one with a 0.88 mm cap and the other with a 1.18 mm cap, ARFI was able to measure average FC thickness to within 11% error of the histologically-verified thickness. Given appropriate imaging parameters, these simulations suggest that transcutaneous ARFI may be capable of measuring average carotid fibrous cap thickness of 0.2 – 0.3 mm, which could aid in the stratification of plaque vulnerability for rupture and future ischemic event.
Acknowledgments
This work was supported by the National Institutes of Health grants R01HL092944, T32HL069768 and K02HL105659 from the National Heart, Lung, and Blood Institute (NHLBI).
We thank Dr. M. L. Palmeri for providing code for the simulation methods presented in this manuscript. We would also like to thank the staff of ITS Research Computing Center (University of North Carolina at Chapel Hill) for guidance and technical support using the KillDevil supercomputing cluster. Finally, we thank Siemens Medical, USA Inc. Ultrasound Division for technical support.
References
1. Go AS, Mozaffarian D, Roger VL, Benjamin EJ, Berry JD, Blaha MJ, Dai S, Ford ES, Fox CS, Franco S, Fullerton HJ, Gillespie C, Hailpern SM, Heit Ja, Howard VJ, Huffman MD, Judd SE, Kissela BM, Kittner SJ, Lackland DT, Lichtman JH, Lisabeth LD, Mackey RH, Magid DJ, Marcus GM, Marelli A, Matchar DB, McGuire DK, Mohler ER, Moy CS, Mussolino ME, Neumar RW, Nichol G, Pandey DK, Paynter NP, Reeves MJ, Sorlie PD, Stein J, Towfighi A, Turan TN, Virani SS, Wong ND, Woo D, Turner MB. Heart disease and stroke statistics--2014 update: a report from the American Heart Association. Circulation. Jan; 2014 129(3):e28–e292. [PubMed: 24352519] 2. Rothwell PM, Eliasziw M, Gutnikov Sa, Fox aJ, Taylor DW, Mayberg MR, Warlow CP, Barnett
HJM. Analysis of pooled data from the randomised controlled trials of endarterectomy for symptomatic carotid stenosis. Lancet. Jan; 2003 361(9352):107–16. [PubMed: 12531577] 3. Halliday A, Harrison M, Hayter E, Kong X, Mansfield A, Marro J, Pan H, Peto R, Potter J, Rahimi
K, Rau A, Robertson S, Streifler J, Thomas D. 10-year stroke prevention after successful carotid endarterectomy for asymptomatic stenosis (ACST-1): a multicentre randomised trial. Lancet. Sep; 2010 376(9746):1074–84. [PubMed: 20870099]
4. Selim MH, Molina Ca. Medical versus surgical treatment of asymptomatic carotid stenosis: the ever-changing nature of evidence-based medicine. Stroke. Apr; 2011 42(4):1156–7. [PubMed:
21393594]
A
uthor Man
uscr
ipt
A
uthor Man
uscr
ipt
A
uthor Man
uscr
ipt
A
uthor Man
uscr
5. Shah PK. Mechanisms of plaque vulnerability and rupture. J Am Coll Cardiol. Feb; 2003 41(4 Suppl S):15S–22S. [PubMed: 12644336]
6. Moreno PR. Vulnerable plaque: definition, diagnosis, and treatment. Cardiol Clin. Feb; 2010 28(1): 1–30. [PubMed: 19962047]
7. Redgrave JNE, Lovett JK, Gallagher PJ, Rothwell PM. Histological assessment of 526 symptomatic carotid plaques in relation to the nature and timing of ischemic symptoms: the Oxford plaque study. Circulation. May; 2006 113(19):2320–8. [PubMed: 16651471]
8. Redgrave JN, Gallagher P, Lovett JK, Rothwell PM. Critical cap thickness and rupture in symptomatic carotid plaques: the oxford plaque study. Stroke. Jun; 2008 39(6):1722–9. [PubMed: 18403733]
9. Hatsukami TS, Ross R, Polissar NL, Yuan C. Visualization of fibrous cap thickness and rupture in human atherosclerotic carotid plaque in vivo with high-resolution magnetic resonance imaging. Circulation. Aug; 2000 102(9):959–64. [PubMed: 10961958]
10. Trivedi RA, U-King-Im J-M, Graves MJ, Horsley J, Goddard M, Kirkpatrick PJ, Gillard JH. MRI-derived measurements of fibrous-cap and lipid-core thickness: the potential for identifying vulnerable carotid plaques in vivo. Neuroradiology. Sep; 2004 46(9):738–43. [PubMed: 15309350] 11. Mitsumori LM, Hatsukami TS, Ferguson MS, Kerwin WS, Cai J, Yuan C. In vivo accuracy of
multisequence MR imaging for identifying unstable fibrous caps in advanced human carotid plaques. J Magn Reson Imaging. Apr; 2003 17(4):410–20. [PubMed: 12655579]
12. Takaya N, Yuan C, Chu B, Saam T, Underhill H, Cai J, Tran N, Polissar NL, Isaac C, Ferguson MS, Garden Ga, Cramer SC, Maravilla KR, Hashimoto B, Hatsukami TS. Association between carotid plaque characteristics and subsequent ischemic cerebrovascular events: a prospective assessment with MRI--initial results. Stroke. Mar; 2006 37(3):818–23. [PubMed: 16469957] 13. Wintermark M, Jawadi SS, Rapp JH, Tihan T, Tong E, Glidden DV, Abedin S, Schaeffer S,
Acevedo-Bolton G, Boudignon B, Orwoll B, Pan X, Saloner D. High-resolution CT imaging of carotid artery atherosclerotic plaques. AJNR Am J Neuroradiol. May; 2008 29(5):875–82. [PubMed: 18272562]
14. Devuyst G, Karapanayiotides T, Ruchat P, Pusztaszeri M, Lobrinus JA, Jonasson L, Cuisinaire O, Kalangos A, Despland PA, Thiran JP, Bogousslavsky J. Ultrasound measurement of the fibrous cap in symptomatic and asymptomatic atheromatous carotid plaques. Circulation. May; 2005 111(21): 2776–82. [PubMed: 15911699]
15. ten Kate GL, Sijbrands EJ, Staub D, Coll B, ten Cate FJ, Feinstein SB, Schinkel AFL. Noninvasive imaging of the vulnerable atherosclerotic plaque. Curr Probl Cardiol. Nov; 2010 35(11):556–91. [PubMed: 20974314]
16. Nightingale K, Soo MS, Nightingale R, Trahey G. Acoustic radiation force impulse imaging: in vivo demonstration of clinical feasibility. Ultrasound Med Biol. Feb; 2002 28(2):227–35. [PubMed: 11937286]
17. Trahey GE, Palmeri ML, Bentley RC, Nightingale KR. Acoustic radiation force impulse imaging of the mechanical properties of arteries: in vivo and ex vivo results. Ultrasound Med Biol. Sep; 2004 30(9):1163–71. [PubMed: 15550320]
18. Dumont D, Behler RH, Nichols TC, Merricks EP, Gallippi CM. ARFI imaging for noninvasive material characterization of atherosclerosis. Ultrasound Med Biol. Nov; 2006 32(11):1703–11. [PubMed: 17112956]
19. Dumont D, Dahl J, Miller E, Allen J, Fahey B, Trahey G. Lower-limb vascular imaging with acoustic radiation force elastography: demonstration of in vivo feasibility. IEEE Trans Ultrason Ferroelectr Freq Control. May; 2009 56(5):931–44. [PubMed: 19473912]
20. Behler RH, Nichols TC, Zhu H, Merricks EP, Gallippi CM. ARFI imaging for noninvasive material characterization of atherosclerosis. Part II: toward in vivo characterization. Ultrasound Med Biol. Feb; 2009 35(2):278–95. [PubMed: 19026483]
21. Dahl JJ, Dumont DM, Allen JD, Miller EM, Trahey GE. Acoustic radiation force impulse imaging for noninvasive characterization of carotid artery atherosclerotic plaques: a feasibility study. Ultrasound Med Biol. May; 2009 35(5):707–16. [PubMed: 19243877]
22. Allen JD, Ham KL, Dumont DM, Sileshi B, Trahey GE, Dahl JJ. The development and potential of acoustic radiation force impulse (ARFI) imaging for carotid artery plaque characterization. Vasc Med. Aug; 2011 16(4):302–11. [PubMed: 21447606]
23. Dumont DM, Doherty JR, Trahey GE. Noninvasive assessment of wall-shear rate and vascular elasticity using combined ARFI/SWEI/spectral Doppler imaging system. Ultrason Imaging. Jul; 2011 33(3):165–88. [PubMed: 21842581]
24. Doherty JR, Dumont DM, Trahey GE, Palmeri ML. Acoustic radiation force impulse imaging of vulnerable plaques: a finite element method parametric analysis. J Biomech. Jan; 2013 46(1):83– 90. [PubMed: 23122224]
25. Behler RH, Czernuszewicz TJ, Wu C, Nichols TC, Zhu H, Homeister JW, Merricks EP, Gallippi CM. Acoustic radiation force beam sequence performance for detection and material
characterization of atherosclerotic plaques: preclinical, ex vivo results. IEEE Trans Ultrason Ferroelectr Freq Control. Dec; 2013 60(12):2471–87. [PubMed: 24297014]
26. Czernuszewicz TJ, Homeister JW, Caughey MC, Farber MA, Fulton JJ, Ford PF, Marston WA, Vallabhaneni R, Nichols TC, Gallippi CM. Non-invasive in vivo characterization of human carotid plaques with acoustic radiation force impulse ultrasound: comparison with histology after endarterectomy. Ultrasound Med Biol. Mar; 2015 41(3):685–97. [PubMed: 25619778]
27. Doherty JR, Dahl JJ, Kranz PG, El Husseini N, Chang H-C, Chen N, Allen JD, Ham KL, Trahey GE. Comparison of Acoustic Radiation Force Impulse Imaging Derived Carotid Plaque Stiffness With Spatially Registered MRI Determined Composition. IEEE Trans Med Imaging. Nov; 2015 34(11):2354–65. [PubMed: 25974933]
28. Palmeri ML, McAleavey SA, Trahey GE, Nightingale KR. Ultrasonic tracking of acoustic radiation force-induced displacements in homogeneous media. IEEE Trans Ultrason Ferroelectr Freq Control. Jul; 2006 53(7):1300–1313. [PubMed: 16889337]
29. Palmeri ML, Sharma AC, Bouchard RR, Nightingale RW, Nightingale KR. A finite-element method model of soft tissue response to impulsive acoustic radiation force. IEEE Trans Ultrason Ferroelectr Freq Control. Oct; 2005 52(10):1699–712. [PubMed: 16382621]
30. Righetti R, Ophir J, Ktonas P. Axial resolution in elastography. Ultrasound Med Biol. Jan; 2002 28(1):101–13. [PubMed: 11879957]
31. Pinton GF, Dahl JJ, Trahey GE. Rapid tracking of small displacements with ultrasound. IEEE Trans Ultrason Ferroelectr Freq Control. Jun; 2006 53(6):1103–17. [PubMed: 16846143] 32. Ohayon J, Finet G, Gharib AM, Herzka DA, Tracqui P, Heroux J, Rioufol G, Kotys MS, Elagha A,
Pettigrew RI. Necrotic core thickness and positive arterial remodeling index: emergent
biomechanical factors for evaluating the risk of plaque rupture. Am J Physiol Heart Circ Physiol. Aug; 2008 295(2):H717–27. [PubMed: 18586893]
33. Jensen JA, Svendsen NB. Calculation of pressure fields from arbitrarily shaped, apodized, and excited ultrasound transducers. IEEE Trans Ultrason Ferroelectr Freq Control. Jan; 1992 39(2): 262–7. [PubMed: 18263145]
34. Jensen JA. Field: A Program for Simulating Ultrasound Systems. 10th Nordic-Baltic Conference on Biomedical Imaging. 1996; 34:351–353.
35. Leys C, Ley C, Klein O, Bernard P, Licata L. Detecting outliers: Do not use standard deviation around the mean, use absolute deviation around the median. J Exp Soc Psychol. 2013; 49(4):764– 766.
36. Dahl JJ, Hyun D, Lediju M, Trahey GE. Lesion detectability in diagnostic ultrasound with short-lag spatial coherence imaging. Ultrason Imaging. Apr; 2011 33(2):119–33. [PubMed: 21710827] 37. Czernuszewicz TJ, Streeter JE, Dayton PA, Gallippi CM. Experimental validation of displacement
underestimation in ARFI ultrasound. Ultrason Imaging. Jul; 2013 35(3):196–213. [PubMed: 23858054]
38. Walker WF, Trahey GE. A Fundamental Limit on Delay Estimation Using Partially Correlated Speckle Signals. IEEE Trans Ultrason Ferroelectr Freq Control. 1995; 42(2):301–308. 39. Zierler, RE.; Dawson, DL. Strandness’s Duplex Scanning in Vascular Disorders. 5. Lippincott
Williams & Wilkins; 2015.
40. Hoskins, PR.; Martin, K.; Thrush, A. Diagnostic Ultrasound: Physics and Equipment. Cambridge University Press; 2010.
41. Frink, RJ. Inflammatory Atherosclerosis: Characteristics of the Injurious Agent. Sacramento, CA: Heart Research Foundation; 2002. Atheromas Are Caseous Abscesses.
42. Lundberg B. Chemical composition and physical state of lipid deposits in atherosclerosis. Atherosclerosis. Jul; 1985 56(1):93–110. [PubMed: 4026939]
43. Mauldin FW, Zhu HT, Behler RH, Nichols TC, Gallippi CM. Robust principal component analysis and clustering methods for automated classification of tissue response to ARFI excitation. Ultrasound Med Biol. Feb; 2008 34(2):309–25. [PubMed: 17913334]
Biographies
Tomasz J. Czernuszewicz was born in Trenton, NJ, in 1985. He received his B.S. with honors degree in biomedical engineering from Marquette University in 2007. From 2007 to 2010 he worked at Zargis Medical Corp., a startup medical device company, as a software engineer developing computer-aided auscultation devices and telemedicine systems. Zargis was acquired by 3M Corp. in 2011. In 2016 he received his Ph.D. degree from the joint department of biomedical engineering at the University of North Carolina and North Carolina State University and has continued with the department as a postdoctoral fellow. His research interests include radiation force imaging methods and cardiovascular elasticity imaging.
Caterina M. Gallippi earned a B.S.E. degree in electrical engineering and a certificate in engineering biology from Princeton University in 1998. She completed her Ph.D. degree in biomedical engineering at Duke University in 2003 with a focus on ultrasonic imaging. She is currently an associate professor in the joint Department of Biomedical Engineering at the University of North Carolina - Chapel Hill and North Carolina State University. Her research interests include radiation force imaging, adaptive signal filtering, multidimensional motion tracking, and magneto-motive ultrasound.
A
uthor Man
uscr
ipt
A
uthor Man
uscr
ipt
A
uthor Man
uscr
ipt
A
uthor Man
uscr
Fig. 1.
Schematic of the layered model used to approximate an atherosclerotic plaque. (a) ARFI peak displacement image of a carotid plaque (white outline) with histologically validated fibrous cap and necrotic core (yellow outline) [26]. The various tissue layers that comprise the ARFI image are shown in the zoomed inset panel. The fibrous cap appears as a region of low displacement (blue pixels) above a region of high displacement (red pixels), which represents the necrotic core. (b) Simple layered geometry abstracted from the ARFI imaging including a stiff layer to represent the fibrous cap on top of a soft layer to represent the necrotic core. ARFI, acoustic radiation force impulse; IJV, internal jugular vein; FEM, finite element method.
A
uthor Man
uscr
ipt
A
uthor Man
uscr
ipt
A
uthor Man
uscr
ipt
A
uthor Man
uscr
Fig. 2.
Block diagram describing the semi-automated FC thickness measurement procedure. FC, fibrous cap; PD, peak displacement; FEM, finite element method; NaN, not a number.
A
uthor Man
uscr
ipt
A
uthor Man
uscr
ipt
A
uthor Man
uscr
ipt
A
uthor Man
uscr
Fig. 3.
Example of k-means clustering algorithm and FC thickness measurement. Imaging parameters for the following data set were 9 MHz tracking pulse and 1.5λ kernel, and the simulated FC was 0.5 mm thick. (a) ARFI PD image. (b) Cluster image after performing k-means clustering. (c) Largest cluster corresponding to the location of the FC with semi-automatic thickness measurements (white lines) overlaid. The measured FC thickness in this example was 0.59 mm. FC, fibrous cap; PD, peak displacement; ARFI, acoustic radiation force impulse.
A
uthor Man
uscr
ipt
A
uthor Man
uscr
ipt
A
uthor Man
uscr
ipt
A
uthor Man
uscr
Fig. 4.
Comparison of FEM simulated data to an in vivo example. (a) ARFI peak displacement from the in vivo example (lateral position 3.63 mm) shown in Figure 1. The fibrous cap appears as an area of low displacement from axial positions 24.5 mm to 26 mm while the necrotic core appears as an area of high displacement approximately spanning axial positions 25.5 mm to 27.5 mm. The full-width half-max of the fibrous cap is denoted by a black arrow. (b) Simulated data from FEM (gray, dashed line) and Field II (black, solid line) with fibrous cap thickness of 1 mm. The fibrous cap in the simulated data spans axial positions 20 mm to 21 mm, while the necrotic core spans positions 21 mm to 22 mm. Ultrasonic tracking of FEM displacements shows significant underestimation of displacement in the area of the necrotic core. The full-width half-max of the fibrous cap as measured by FEM and ultrasound are shown as gray and black arrows, respectively. US, ultrasound; ARFI, acoustic radiation force impulse; FEM, finite element method.
A
uthor Man
uscr
ipt
A
uthor Man
uscr
ipt
A
uthor Man
uscr
ipt
A
uthor Man
uscr
Fig. 5.
FEM-measured peak displacement results with and without saturation. (a) FEM-measured thickness versus true simulated thickness with no saturation. Dashed line indicates the line of equivalency. (b) FEM peak displacement profiles for all ten fibrous cap thicknesses with no saturation. Dashed line indicates border between lumen and fibrous cap. (c) FEM-measured thickness versus true simulated thickness with saturation. (d) FEM peak displacement profiles for all ten fibrous cap thicknesses with adaptive saturation. The cap thickness was measured as the full-width half-max between the fibrous cap and necrotic core layers, as shown by the black arrows in (b) and (d). Note that without saturation, FEM-measured thickness substantially overestimated the true simulated thickness due to mechanical coupling between the fibrous cap and necrotic core.
A
uthor Man
uscr
ipt
A
uthor Man
uscr
ipt
A
uthor Man
uscr
ipt
A
uthor Man
uscr
Fig. 6.
FEM thickness bias as a function of image saturation level. An image saturation level of 0 indicates the full dynamic range of peak displacement is used. Saturation levels greater than zero indicate reduction of dynamic range as depicted in Figure 5. FEM, finite element method.
A
uthor Man
uscr
ipt
A
uthor Man
uscr
ipt
A
uthor Man
uscr
ipt
A
uthor Man
uscr
Fig. 7.
Examples of simulated 2D ARFI peak displacement images for the ten fibrous cap
thicknesses taken with tracking pulses centered at 6 MHz and using a 1λ kernel (0.257 mm). The fibrous cap appears as a yellow-green band starting at axial position 20 mm. ARFI, acoustic radiation force impulse.
A
uthor Man
uscr
ipt
A
uthor Man
uscr
ipt
A
uthor Man
uscr
ipt
A
uthor Man
uscr
Fig. 8.
Examples of simulated 2D ARFI peak displacement images for the ten fibrous cap thicknesses taken with tracking pulses centered at 12 MHz and using a 2λ (0.257 mm) kernel. The fibrous cap appears as a yellow-green band starting at axial position 20 mm. Note that edge definition and contrast are qualitatively better compared to the lower tracking frequency shown in Figure 7. ARFI, acoustic radiation force impulse.
A
uthor Man
uscr
ipt
A
uthor Man
uscr
ipt
A
uthor Man
uscr
ipt
A
uthor Man
uscr
Fig. 9.
Simulated ARFI-measured fibrous cap thickness compared to true thickness grouped by relative kernel size (given as a fraction of wavelength, λ). Dashed line indicates the line of equivalency. ARFI, acoustic radiation force impulse.
A
uthor Man
uscr
ipt
A
uthor Man
uscr
ipt
A
uthor Man
uscr
ipt
A
uthor Man
uscr
Fig. 10.
Simulated ARFI-measured thickness bias a function of absolute kernel size. ARFI, acoustic radiation force impulse.
A
uthor Man
uscr
ipt
A
uthor Man
uscr
ipt
A
uthor Man
uscr
ipt
A
uthor Man
uscr
Fig. 11.
ARFI-measured contrast between the simulated fibrous cap and necrotic core layers as a function of absolute kernel size for three different fibrous cap thicknesses (0.2 mm, 0.5 mm, and 1.0 mm). The top row shows results for unsaturated images (β = 0), while the bottom row shows results for saturated images (β = 0.75). Note that saturation reduces contrast in some cases. Dashed line indicates FEM-measured contrast. ARFI, acoustic radiation force impulse; FC, fibrous cap.
A
uthor Man
uscr
ipt
A
uthor Man
uscr
ipt
A
uthor Man
uscr
ipt
A
uthor Man
uscr
Fig. 12.
ARFI-measured CNR between the simulated fibrous cap and necrotic core layers as a function of absolute kernel size for three different fibrous cap thicknesses (0.2 mm, 0.5 mm, and 1.0 mm). The top row shows results for unsaturated images (β = 0), while the bottom row shows results for saturated images (β = 0.75). Note that CNR increases with thickness saturation increases CNR in some cases. CNR, contrast to noise ratio; ARFI, acoustic radiation force impulse; FC, fibrous cap
A
uthor Man
uscr
ipt
A
uthor Man
uscr
ipt
A
uthor Man
uscr
ipt
A
uthor Man
uscr
Fig. 13.
FC thicknesses measured from ARFI images taken in vivo and compared against histology. (a) ARFI PD image of a Type Va carotid plaque showing the FC measurement lines in white. (b) Combined Masson’s elastin stain showing the FC thickness measurement for plaque example 1. (c) ARFI PD image of another Type Va carotid plaque. (d) Lillie’s-modified Masson’s trichrome stain for plaque in example 2. The table reports mean (± standard deviation) FC thicknesses measured from ARFI and histology as well as ARFI percent error. The tracking pulse frequency in these examples was 6.15 MHz, and a motion tracking kernel size of 1λ was utilized. Data to create this figure were adapted from [26].
A
uthor Man
uscr
ipt
A
uthor Man
uscr
ipt
A
uthor Man
uscr
ipt
A
uthor Man
uscr
Fig. 14.
The impact of kernel size and dynamic range (DR) color scaling on mean ARFI-measured fibrous cap thickness for two in vivo examples. ARFI images, motion tracked with various kernel sizes from Figure 13 (example 1), are shown in two columns. The first column shows images scaled using the median + 2*MAD color scaling (for a dynamic range of 2.7 μm), while the second column shows images scaled using median + 4*MAD color scaling (for a dynamic range of 4.2 μm). Four motion tracking kernels for each color scaling are shown (0.5λ, 1.5λ, 2.5λ, and 3.5λ) and fibrous cap measurement lines are displayed as white lines. Mean fibrous cap thickness for all kernel sizes and both in vivo examples is shown in the plot on the right. Note that both larger kernel size and higher dynamic range increases measurement bias. ARFI, acoustic radiation force impulse; MAD, median absolute deviation.
A
uthor Man
uscr
ipt
A
uthor Man
uscr
ipt
A
uthor Man
uscr
ipt
A
uthor Man
uscr
Fig. 15.
ARFI-measured contrast and CNR between the necrotic core and fibrous cap for the two in vivo examples from Figure 13. In each plot, two dynamic ranges are shown; one scaled using the median + 2*MAD (solid lines), and the other scaled to the maximum displacement within the necrotic core, i.e. an unsaturated image (dashed lines). Note that the saturated and unsaturated cases loosely reflect the simulated β = 0.75 and β = 0 saturation levels,
respectively.
A
uthor Man
uscr
ipt
A
uthor Man
uscr
ipt
A
uthor Man
uscr
ipt
A
uthor Man
uscr
A
uthor Man
uscr
ipt
A
uthor Man
uscr
ipt
A
uthor Man
uscr
ipt
A
uthor Man
uscr
ipt
T ABLE IMaterial Model Constants
Y
oung’s Moduli (kP
a)
P
oisson Ratios
Shear Moduli (kP
a)
Ea Eb Ec
ν ba νca
ν cb
Gab Gbc Gca Fibrous (MA T_002) 2312 2312 115.6 0.27 0.07 0.07 910.2 1175 1175 Necrotic (MA T_001)
Isotropic material with E = 1 kP
a, and ν = 0.499 The subscripts a, b , and
c represent longitudinal, circumferential, and radial directions, respecti
v
ely
, and lateral, ele
v
ation, and axial, respecti
v
ely
, in the ultrasonic coordinate def
A
uthor Man
uscr
ipt
A
uthor Man
uscr
ipt
A
uthor Man
uscr
ipt
A
uthor Man
uscr
ipt
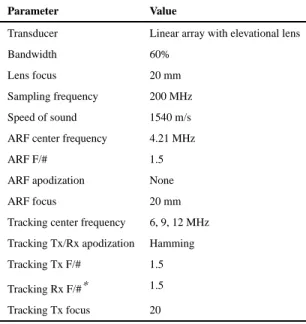
TABLE II
Simulation Parameters
Parameter Value
Transducer Linear array with elevational lens
Bandwidth 60%
Lens focus 20 mm
Sampling frequency 200 MHz
Speed of sound 1540 m/s
ARF center frequency 4.21 MHz
ARF F/# 1.5
ARF apodization None
ARF focus 20 mm
Tracking center frequency 6, 9, 12 MHz
Tracking Tx/Rx apodization Hamming
Tracking Tx F/# 1.5
Tracking Rx F/#* 1.5
Tracking Tx focus 20
*