A S S O C I A T I O N S T U D I E S A R T I C L E
Genome-wide association study of iron traits and
relation to diabetes in the Hispanic Community Health
Study/Study of Latinos (HCHS/SOL): potential genomic
intersection of iron and glucose regulation?
Laura M. Raffield
1,*, Tin Louie
2, Tamar Sofer
2, Deepti Jain
2, Eli Ipp
3,
Kent D. Taylor
4, George J. Papanicolaou
5, Larissa Avile´s-Santa
5,
Leslie A. Lange
1, Cathy C. Laurie
2, Matthew P. Conomos
2,
Timothy A. Thornton
2, Yii-Der Ida Chen
4,6, Qibin Qi
7, Scott Cotler
8,
Bharat Thyagarajan
9, Neil Schneiderman
10, Jerome I. Rotter
4,6,
Alex P. Reiner
11and Henry J. Lin
41
Department of Genetics, University of North Carolina, Chapel Hill, NC 27599, USA,
2Department of
Biostatistics, University of Washington, Seattle, WA 98195, USA,
3Department of Medicine and Division of
Endocrinology, Harbor-UCLA Medical Center, Torrance, CA 90502, USA and the David Geffen School of Medicine
at UCLA, Los Angeles, CA, USA,
4Institute for Translational Genomics and Population Sciences, Los Angeles
Biomedical Research Institute, and Department of Pediatrics, Harbor-UCLA Medical Center, Torrance, CA 90502,
and the David Geffen School of Medicine at UCLA, Los Angeles, CA, USA,
5Division of Cardiovascular Sciences,
NHLBI, NIH, Bethesda, MD 20892, USA,
6Department of Medicine, Harbor-UCLA Medical Center, Torrance, CA
90502, and the David Geffen School of Medicine at UCLA, Los Angeles, CA, USA,
7Department of Epidemiology
and Population Health, Albert Einstein College of Medicine, Bronx, NY 10461, USA,
8Department of Medicine,
Division of Hepatology, Loyola University Medical Center, Maywood, IL 60153, USA,
9Department of Laboratory
Medicine and Pathology, University of Minnesota, Minneapolis, MN 55455, USA,
10Department of Psychology
and Behavioral Medicine, University of Miami, FL 33124, USA and
11Department of Epidemiology, University of
Washington, Seattle, WA 98195, USA
*To whom correspondence should be addressed at: Department of Genetics, University of North Carolina, 5100 Genetic Medicine Building, 120 Mason Farm Road, Chapel Hill, NC 27599, USA. Tel: (919) 966-7255; Fax: (919) 843-4682; Email: [email protected]
Abstract
Genetic variants contribute to normal variation of iron-related traits and may also cause clinical syndromes of iron deficiency or excess. Iron overload and deficiency can adversely affect human health. For example, elevated iron storage is associated with increased diabetes risk, although mechanisms are still being investigated. We conducted the first genome-wide associ-ation study of serum iron, total iron binding capacity (TIBC), transferrin saturassoci-ation, and ferritin in a Hispanic/Latino cohort,
Received:October 25, 2016.Revised:February 16, 2017.Accepted:March 1, 2017
VCThe Author 2017. Published by Oxford University Press. All rights reserved. For Permissions, please email: [email protected]
1966
doi: 10.1093/hmg/ddx082
Advance Access Publication Date: 7 March 2017 Association Studies Article
the Hispanic Community Health Study/Study of Latinos (>12 000 participants) and also assessed the generalization of previ-ously known loci to this population. We then evaluated whether iron-associated variants were associated with diabetes and glycemic traits. We found evidence for a novel association between TIBC and a variant near the gene for protein phosphatase 1, regulatory subunit 3B (PPP1R3B; rs4841132,b¼ 0.116,P¼7.44108). The effect strengthened when iron deficient
individ-uals were excluded (b¼ 0.121,P¼4.78109). Ten of sixteen variants previously associated with iron traits generalized to
HCHS/SOL, including variants at the transferrin (TF), hemochromatosis (HFE), fatty acid desaturase 2 (FADS2)/myelin regula-tory factor (MYRF), transmembrane protease, serine 6 (TMPRSS6), transferrin receptor (TFR2), N-acetyltransferase 2 (arylamine N-acetyltransferase) (NAT2), ABO blood group (ABO), and GRB2 associated binding protein 3 (GAB3) loci. In examining iron variant associations with glucose homeostasis, an iron-raising variant ofTMPRSS6was associated with lower HbA1c levels (P¼8.661010). This association was attenuated upon adjustment for iron measures. In contrast, the iron-raising allele of PPP1R3Bwas associated with higher levels of fasting glucose (P¼7.70107) and fasting insulin (P
¼4.79106), but these
associations were not attenuated upon adjustment for TIBC—so iron is not likely a mediator. These results provide new gen-etic information on iron traits and their connection with glucose homeostasis.
Introduction
Iron is necessary for various metabolic processes, including oxygen transport and storage, redox reactions, cell signaling and microbial defense. Absorption, transport and storage of iron are carefully regulated (reviewed in1,2), presumably to avert potential toxic effects of free iron (such as formation of superoxide radicals and cellular apoptosis). Both iron overload and iron deficiency can be detrimental to health (1), so iron homeostasis is essential. Although many factors that take part in iron homeostasis are known (1,2), mechanisms by which the body regulates iron stores are still being elucidated (3).
In plasma, ferric iron is normally carried by transferrin (TF), en route to the TF receptor in organs such as the bone marrow, liver and spleen. Levels of serum ferritin, a key iron storage pro-tein in the cytosol, nucleus and mitochondria, correlate with iron stores under most physiological conditions. Biomarkers of iron homeostasis, including serum iron, total iron binding cap-acity (TIBC), transferrin saturation (SAT) and ferritin, are used clinically to assess iron overload or deficiency. Genetic factors play a role in inter-individual variation in levels of these iron biomarkers. For example, hemochromatosis (HFE) variants are associated with hereditary hemochromatosis, which can lead to iron overload and damage to the liver and other organs (4).
Iron biomarkers show significant heritability, apart from her-editary hemochromatosis (5). Single nucleotide polymorphisms (SNPs) associated with iron trait variation have been reported in European populations, where 11 loci associated with iron traits were detected in a recent meta-analysis (6). Other genome-wide association study (GWAS) analyses have been conducted in African Americans (7) and East Asian men (8). Analysis of candi-date variants in 233 Hispanic/Latino individuals replicated sev-eral associations for the TF locus and TIBC found in other populations (9). However, there has been no published genome-wide analysis of iron traits in Hispanic/Latino populations. Analysis of iron trait genetics in diverse populations is import-ant, as there are known differences between ancestry groups. For example, hereditary hemochromatosis is more common in indi-viduals of European versus African or Hispanic ancestry (10). There may also be differences in iron levels between population groups, such as lower SAT but higher serum ferritin among African Americans (compared with Europeans) (11). These differ-ences could be due in part to genetic factors.
A connection between metabolic disorders—such as diabetes, insulin resistance and fatty liver disease—and iron overload due to hereditary hemochromatosis (12), thalassemia with hyper-transfusion (13) or other conditions (14) is well-established.
Moreover, excess iron is epidemiologically associated with a higher incidence of type 2 diabetes (T2D) (reviewed in15,16). For example, elevated serum ferritin levels were associated with roughly a 4-fold increase in the odds of newly diagnosed diabetes in the National Health and Nutrition Education Survey study (17). A few studies have examined genetic factors that influence both iron stores and diabetes risk (18,19), yielding various results. Further work is needed. Better understanding of the genetic underpinnings of iron homeostasis may help elucidate new path-ways and connections between iron metabolism and chronic dis-eases, including diabetes.
Here we report a GWAS analysis of iron traits in the Hispanic Community Health Study/Study of Latinos (HCHS/SOL), to iden-tify potential novel factors involved in iron regulation. We also aimed to assess the role of previously identified iron trait vari-ants in a Hispanic/Latino population. A third goal was to exam-ine the overlap between iron-related loci and risk factors for diabetes or impaired glycemic control. Our results confirm known associations of iron traits with eight loci and potentially identify a novel iron locus.
Results
Outcome measures
Demographic characteristics and levels of iron measures are in
Table 1, for the entire sample and for females (n¼7241) and males (n¼5122) separately. Histograms for the distribution of iron measures in the cohort are in Supplementary Material, Fig. S1. Average age in the cohort was 46.1 years (SD 13.9). The aver-age body mass index (BMI) was 29.8 (SD 6.1, median 29), indicat-ing that a high percentage of the cohort was overweight or obese. Prevalence of diabetes was 19.6%, which is higher than the estimated prevalence in the entire HCHS/SOL cohort (16.9%, n¼16 385) (20). Serum iron levels correlated positively with fer-ritin (r¼0.420) and SAT (r¼0.939) and negatively with TIBC (r¼ 0.125) (Supplementary Material, Table S1).
Primary GWAS analysis
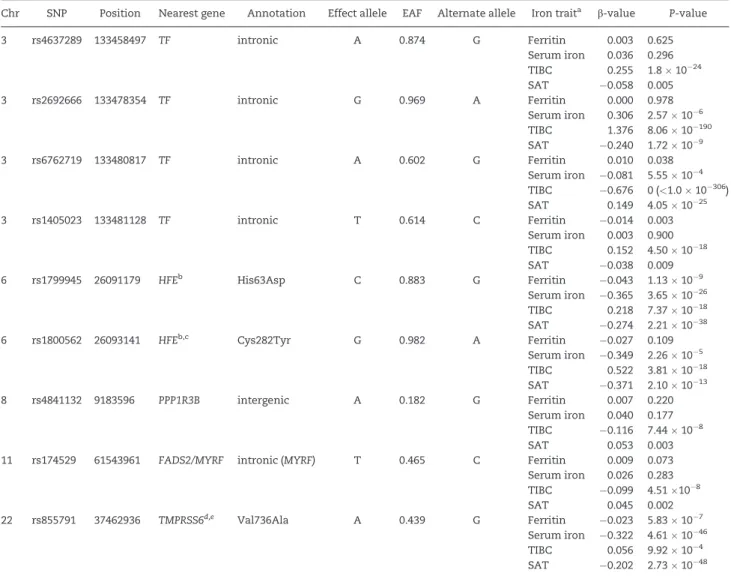
SNPs representing the previously reportedTF, HFE, fatty acid desaturase 2 (FADS2)/ myelin regulatory factor (MYRF) and transmembrane protease, serine 6 (TMPRSS6) loci were associated with one or more iron traits at genome-wide signifi-cance (P<5108) (Table 2). An additional novel variant at the
protein phosphatase 1, regulatory subunit 3B (PPP1R3B) locus was nearly genome-wide significant for TIBC (P¼7.44108).
Table 1. Demographic characteristics, glycemic traits and iron related measures in the HCHS/SOL, for the entire cohort and females and males Variable Entire cohort (n ¼ 12 363) Females (n ¼ 7241) Males (n ¼ 5122) Mean (SD) or % Median (Min, Max) N Mean (SD) or % Median (Min, Max) N Mean (SD) or % Median (Min, Max) N Age (years) 46.12 (13.86) 48 (18,76) 12 363 46.75 (13.64) 48 (18,76) 7241 45.23 (14.13) 47 (18,75) 5122 BMI (kg/m 2) 29.82 (6.07) 29 (14.3,70.3) 12 330 30.36 (6.5) 29.4 (14.3,70.3) 7224 29.06 (5.32) 28.5 (14.9,58.1) 5106 Waist/hip ratio 0.92 (0.08) 0.93 (0.52,1.42) 12 326 0.9 (0.07) 0.9 (0.52,1.42) 7221 0.95 (0.07) 0.95 (0.55,1.25) 5105 Central American heritage 10.85% – 1 2 363 10.94% – 7241 10.72% – 5122 Cuban heritage 17.73% – 1 2 363 15.96% – 7241 20.23% – 5122 Dominican heritage 9.29% – 1 2 363 10.33% – 7241 7.81% – 5122 Mexican heritage 37.30% – 1 2 363 38.17% – 7241 36.08% – 5122 Puerto Rican heritage 17.55% – 1 2 363 17.22% – 7241 18.02% – 5122 South American heritage 7.28% – 1 2 363 7.37% – 7241 7.15% – 5122 Former cigarette use 20.12% – 1 2 363 15.51% – 7241 26.65% – 5122 Current cigarette use 20.13% – 1 2 363 16.20% – 7241 25.69% – 5122 Diabetes 19.61% – 1 2 363 20.04% – 7241 19.00% – 5122 Fasting insulin ( m U/ml) 13.35 (12.93) 10.61 (0.33,726) 12 325 13.47 (11.54) 10.83 (0.33,296) 7225 13.18 (14.69) 10.33 (0.56,726) 5100 Fasting glucose (mg/dl) 104.83 (36.81) 95 (52,642) 12 360 102.52 (34.61) 94 (52,642) 7238 108.08 (39.5) 97 (53,449) 5122 2 h Post-load glucose (mg/dl) 123.79 (43.01) 115 (33,398) 10 168 127.78 (42.67) 119 (38,398) 5909 118.27 (42.86) 110 (33,342) 4259 HbA1c (%) 5.9 (1.29) 5.6 (3.3,19.1) 12 317 5.88 (1.21) 5.6 (3.7,19.1) 7213 5.92 (1.38) 5.6 (3.3,15.7) 5104 HOMA-B 141.02 (186.54) 113 (1.1,12600) 12 314 150.05 (217.02) 120 (1.1,12600) 7216 128.24 (130.83) 99.9 (1.9,5333.9) 5098 HOMA-IR 3.6 (4.3) 2.58 (0.07,200.77) 12 325 3.58 (4.17) 2.57 (0.07,179.06) 7225 3.62 (4.47) 2.6 (0.11,200.77) 5100 C-reactive protein (mg/l) 4.02 (6.18) 2.12 (0.11, 112.4) 12 357 4.66 (6.45) 2.69 (0.12, 112.4) 7237 3.12 (5.67) 1.64 (0.11, 104.2) 5120 Ferritin ( m g/l) 126.99 (136.5) 89 (7,3061) 12 363 79.02 (74.27) 58 (7,1083) 7241 194.79 (171.26) 152 (7,3061) 5122 Serum iron ( m g/dl) 89.82 (33.46) 87 (8,256) 12 363 81.76 (30.95) 80 (8,239) 7241 101.22 (33.56) 98 (13,256) 5122 TIBC ( m g/dl) 319.85 (46.86) 316 (140,564) 12 363 326.9 (48.92) 322 (140,564) 7241 309.88 (41.8) 308 (157,500) 5122 SAT (%) 28.81 (11.62) 28 (2,99) 12 363 25.74 (10.62) 25 (2,97) 7241 33.16 (11.59) 32 (4,99) 5122 Abbreviations: HbA1c, glycate d hemoglo bin; HOMA -B, homeostasis model assessment of b -cell function; HOMA-IR, homeostasis model assessment of insuli n resistance; TIBC, tota l iron-bind ing capacity; SAT, transferrin saturation.
All genome-wide significant variants listed inTable 2were dir-ectly genotyped or had an imputation r2>0.95. Manhattan and
quantile–quantile (Q–Q) plots and results for all SNPs withP<1
106for each iron trait are in the supplement (serum iron:
Supplementary Material, Fig. S2, Table S2; TIBC: Supplementary Material, Fig. S3, Table S3; SAT: Supplementary Material, Figure S4, Table S4; ferritin: Supplementary Material, Fig. S5, Table S5). Results for each locus are detailed below.
The TF locus.Variants in theTFlocus reached genome-wide significance for TIBC and SAT (Supplementary Material, Fig. S6). Conditional analysis of theTFlocus showed five distinct genome-wide significant signals for TIBC, represented by non-coding variants rs6762719, rs2692666, rs1130459, rs1405023 and rs4637289. Two of these variants are in modest
LD with rs6762719 in HCHS/SOL (rs1405023, r2 ¼ 0.43;
rs1130459, r2 ¼ 0.22) and two are not (rs2692666 and
rs4637289, r2 < 0.1). Variant rs1130459 was not associated with TIBC in the primary analysis (b-value¼ 0.0006, S.E.¼
0.018,P¼0.971), but became significant when conditioned on variants rs6762719 and rs2692666 (b-value ¼ 0.269; S.E. ¼
0.018, P ¼8.68 1051after conditioning). Our top TFSNP
(rs6762719) is in very high LD with the lead variant atTF re-ported in Europeans (rs8177240; r2¼0.98 in the 1000 Genomes
European reference panel) (6). Variant rs1405023 shows mod-est LD with rs8177179 (r2¼0.42 in 1000 Genomes Europeans),
which was identified by conditional analysis at theTFlocus in Europeans (6). Conditional analysis showed a single inde-pendent signal atTFfor SAT (rs6762719).
Table 2.SNPs significantly associated with one or more iron traits
Chr SNP Position Nearest gene Annotation Effect allele EAF Alternate allele Iron traita b-value P-value
3 rs4637289 133458497 TF intronic A 0.874 G Ferritin 0.003 0.625
Serum iron 0.036 0.296 TIBC 0.255 1.81024 SAT 0.058 0.005
3 rs2692666 133478354 TF intronic G 0.969 A Ferritin 0.000 0.978
Serum iron 0.306 2.57106 TIBC 1.376 8.0610190 SAT 0.240 1.72109
3 rs6762719 133480817 TF intronic A 0.602 G Ferritin 0.010 0.038
Serum iron 0.081 5.55104 TIBC 0.676 0 (<1.010306) SAT 0.149 4.051025
3 rs1405023 133481128 TF intronic T 0.614 C Ferritin 0.014 0.003
Serum iron 0.003 0.900 TIBC 0.152 4.501018 SAT 0.038 0.009
6 rs1799945 26091179 HFEb His63Asp C 0.883 G Ferritin 0.043 1.13109
Serum iron 0.365 3.651026 TIBC 0.218 7.371018 SAT 0.274 2.211038
6 rs1800562 26093141 HFEb,c Cys282Tyr G 0.982 A Ferritin 0.027 0.109
Serum iron 0.349 2.26105 TIBC 0.522 3.811018 SAT 0.371 2.101013
8 rs4841132 9183596 PPP1R3B intergenic A 0.182 G Ferritin 0.007 0.220
Serum iron 0.040 0.177 TIBC 0.116 7.44108
SAT 0.053 0.003
11 rs174529 61543961 FADS2/MYRF intronic (MYRF) T 0.465 C Ferritin 0.009 0.073 Serum iron 0.026 0.283 TIBC 0.099 4.51108
SAT 0.045 0.002
22 rs855791 37462936 TMPRSS6d,e Val736Ala A 0.439 G Ferritin 0.023 5.83107 Serum iron 0.322 4.611046 TIBC 0.056 9.92104 SAT 0.202 2.731048
aA log base 10 transformation was used for ferritin, and square root transformation was used for serum iron, TIBC, and transferrin saturation.
bThe minor alleles for both of theseHFEvariants are associated with higher iron levels [represented by a G nucleotide on theþstrand at rs1799945 (and aspartate at
residue 63) and an A nucleotide on theþstrand at rs1800562 (and tyrosine at residue 282)].
cTransferrin saturationHFEvariant rs79220007 is an LD proxy for coding variant rs1800562 p.Cys282Tyr (r2¼0.98). Variant rs79220007 was thus not included. dFerritin leadTMPRSS6variant rs760719 is in high LD (r2¼0.79) with coding variant rs855791, which is known to be associated with iron traits (6), and its effect was
non-significant when conditioned on rs855791. Variant rs760719 was thus not included.
eThe valine allele is listed as the reference allele in NCBI databases (2321A
>G; Val736Ala, with an A nucleotide on the – strand at rs855791), but alanine more likely represents the ancestral allele, because it is conserved across multiple species (gorilla, mouse, rat, chicken) (21).
Gene symbols and abbreviations:TF, transferrin;HFE, hereditary hemochromatosis;PPP1R3B, protein phosphatase 1, regulatory subunit 3B;MYRF, myelin regulatory
fac-tor;FADS2, fatty acid desaturase 2;TMPRSS6, transmembrane protease, serine 6; EAF, effect allele frequency; TIBC, total iron-inding capacity; SAT, transferrin saturation.
The HFE locus. TheHFElocus reached genome-wide significance for all tested iron traits (Supplementary Material, Fig. 7). For serum iron and ferritin, a single signal was revealed by conditional lysis (rs1799945, p.His63Asp). For TIBC and SAT, conditional ana-lysis showed two independent signals at theHFElocus, represented by rs1799945 (p.His63Asp) and rs1800562 (p.Cys282Tyr) (which are in very low LD, r2¼0.002). These codingHFEvariants are associated
with hereditary hemochromatosis in homozygotes and compound heterozygotes (hemochromatosis, type 1, OMIM 235200). The se-cond independent signal for SAT was led by rs79220007, which is in very strong linkage disequilibrium (LD) with rs1800562 (r2¼0.98).
The FADS2/MYRF locus.A single intron variant inMYRFwas associated with TIBC (P¼4.51108; Supplementary Material,
Fig. S8). The variant is in strong LD with an intron variant in
FADS2(rs174577, r2¼0.76 in 1000 Genomes Europeans), which
was associated with TF among Europeans (6).
The TMPRSS6 locus.There was a single independent signal at
TMPRSS6 (Supplementary Material, Fig. S9), which was con-firmed by conditional analysis. The signal was represented by lead variant rs855791 (p.Val736Ala) for serum iron and SAT, and by lead variant rs760719 for ferritin. Variants rs760719 and rs855791 are in strong LD (r2¼0.79).
The PPP1R3B locus.A novel association involving a variant near the PPP1R3B locus and TIBC showed near genome-wide
significance (rs4841132, b ¼ 0.116, P ¼ 7.44 108;
Supplementary Material, Fig. S10).
Additional signals. A low-frequency intergenic variant on chromosome 1 was associated with TIBC (rs78455250,
b¼ 0.621,P¼3.83108
; Supplementary Material, Fig. S11). A low-frequency intronic variant on chromosome 5 was associ-ated with SAT (rs2442120, P ¼ 4.92 108
; Supplementary Material, Fig. S12). However, the association became non-significant when conditioned on theTF,HFEandTMPRSS6loci, and replication was not pursued.
Replication of novel signals
The newly identifiedPPP1R3Bvariant was nominally associated with TF levels (which are linearly related to TIBC values) in the European meta-analysis (b¼ 0.0577,P¼0.0014; personal com-munication with Dr Benyamin) (6). A significant association was not observed in the Jackson Heart Study, although the esti-mated association was in the same direction (b¼ 2.162, P¼
0.246) (7). Variant rs4841132 was most common in the admixed American populations in 1000 Genomes Phase 1 (19% minor al-lele frequency, compared with 10% in African, 8% in European and 1% in Asian populations).
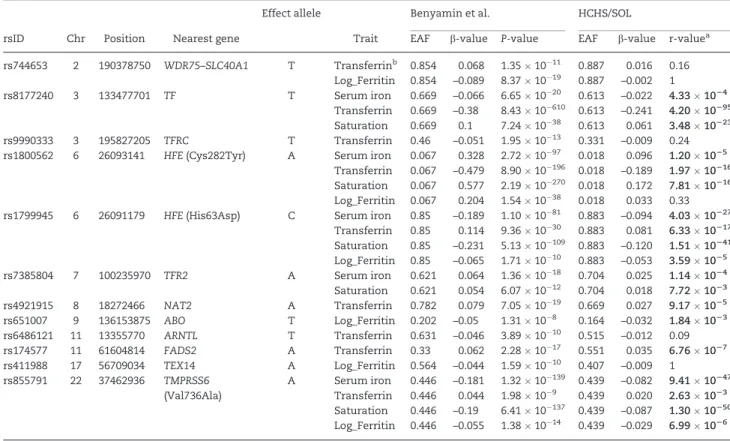
Table 3.Generalization of iron related variants identified in European populations by Benyaminet al.(6) in the HCHS/SOL
Effect allele Benyamin et al. HCHS/SOL
rsID Chr Position Nearest gene Trait EAF b-value P-value EAF b-value r-valuea
rs744653 2 190378750 WDR75–SLC40A1 T Transferrinb 0.854 0.068 1.351011 0.887 0.016 0.16 Log_Ferritin 0.854 –0.089 8.371019 0.887 –0.002 1
rs8177240 3 133477701 TF T Serum iron 0.669 –0.066 6.651020 0.613 –0.022 4.331024 Transferrin 0.669 –0.38 8.4310610 0.613 –0.241 4.2010295 Saturation 0.669 0.1 7.241038 0.613 0.061 3.4810223 rs9990333 3 195827205 TFRC T Transferrin 0.46 –0.051 1.951013 0.331 –0.009 0.24 rs1800562 6 26093141 HFE(Cys282Tyr) A Serum iron 0.067 0.328 2.721097 0.018 0.096 1.201025
Transferrin 0.067 –0.479 8.9010196 0.018 –0.189 1.9710216 Saturation 0.067 0.577 2.1910270 0.018 0.172 7.8110216 Log_Ferritin 0.067 0.204 1.541038 0.018 0.033 0.33 rs1799945 6 26091179 HFE(His63Asp) C Serum iron 0.85 –0.189 1.101081 0.883 –0.094 4.0310227
Transferrin 0.85 0.114 9.361030 0.883 0.081 6.3310217 Saturation 0.85 –0.231 5.1310109 0.883 –0.120 1.5110241 Log_Ferritin 0.85 –0.065 1.711010 0.883 –0.053 3.591025 rs7385804 7 100235970 TFR2 A Serum iron 0.621 0.064 1.361018 0.704 0.025 1.141024 Saturation 0.621 0.054 6.071012 0.704 0.018 7.721023 rs4921915 8 18272466 NAT2 A Transferrin 0.782 0.079 7.051019 0.669 0.027 9.171025 rs651007 9 136153875 ABO T Log_Ferritin 0.202 –0.05 1.31108 0.164 –0.032 1.841023 rs6486121 11 13355770 ARNTL T Transferrin 0.631 –0.046 3.891010 0.515 –0.012 0.09 rs174577 11 61604814 FADS2 A Transferrin 0.33 0.062 2.281017 0.551 0.035 6.761027 rs411988 17 56709034 TEX14 A Log_Ferritin 0.564 –0.044 1.591010 0.407 –0.009 1
rs855791 22 37462936 TMPRSS6 A Serum iron 0.446 –0.181 1.3210139 0.439 –0.082 9.4110247 (Val736Ala) Transferrin 0.446 0.044 1.98109 0.439 0.020 2.631023
Saturation 0.446 –0.19 6.4110137 0.439 –0.087 1.3010250 Log_Ferritin 0.446 –0.055 1.381014 0.439 –0.029 6.991026
Reportedb-values are from the generalization analysis, which used the same phenotype transformations as in Benyaminet al.(6)
aSignificant r-values are bolded (r<0.05).
bTIBC values were used to generalize transferrin results.
Gene symbols and abbreviations:WDR75–SLC40A1, WD repeat domain 75—solute carrier family 40 (iron-regulated transporter), member 1 (also known as ferroportin);
TF, transferrin;TFRC, transferrin receptor;HFE, hereditary hemochromatosis;TFR2, transferrin receptor 2;NAT2, N-acetyltransferase 2 (arylamine N-acetyltransferase);
ABO, ABO blood group;ARNTL, aryl hydrocarbon receptor nuclear translocator like;FADS2, fatty acid desaturase 2;TEX14, testis expressed 14;TMPRSS6, transmembrane protease, serine 6; EAF, effect allele frequency; TIBC, total iron-binding capacity.
As mentioned earlier, a variant on chromosome 1 was also associated with TIBC (rs78455250). The variant had a low minor allele frequency in HCHS/SOL (0.2%). The minor allele frequency was higher in the Jackson Heart Study (2.3%), but association with TIBC was in the opposite direction and non-significant (b¼1.451,
P ¼ 0.762). This variant was not observed in European 1000 Genomes participants, so replication in Europeans was not at-tempted. The variant is not considered further here.
Sensitivity analysis excluding individuals with iron deficiency
Excluding individuals with iron deficiency reduced effect sizes for TF and SAT loci in the European meta-analysis (6). Therefore, we excluded individuals with iron deficiency, as a sensitivity analysis for our HCHS/SOL GWAS. Most associations (28/36; Supplementary Material, Table S6) became more signifi-cant, despite the reduced sample size. For example, the associ-ation of rs4841132 (nearPPP1R3B) with TIBC became stronger and genome-wide significant (original model, b¼ 0.116, P ¼
7.44108, n¼ 12 585; excluding iron deficient individuals,
b¼ 0.121,P¼4.78109, n¼11 614).
Moreover, an additional 213 SNPs had genome-wide signifi-cant effects after excluding iron deficient individuals (1397 genome-wide significant SNPs, Supplementary Material, Table S7). All but 14 of these variants were in previously recognized loci in HCHS/SOL. For example, associations of SNPs inTFwith serum iron strengthened to genome-wide significance levels (lead variant rs2692696, P ¼ 5.11 109; Supplementary
Material, Fig. S13.a). However, a new genome-wide significant association of SNPs in ABO blood group(ABO)with ferritin was observed, led by intron variant rs657152 (b¼0.025,P¼1.94
108; Supplementary Material, Fig. S13.b). Variant rs657152 is in
modest LD (r2 ¼ 0.4 in the 1000 Genomes Europeans) with
rs651007, a variant downstream of ABO that was associated with ferritin levels in European populations (6) and generalized to HCHS/SOL (r-value¼1.84103;Table 3). Two imputed
vari-ants not at previously identified loci were also associated with serum iron (rs144628729 and rs181143083).
Generalization of previously identified GWAS signals in HCHS/SOL
In the largest European meta-analysis, Benyaminet al.detected associations between iron traits and 11 loci [HFE(two independ-ent variants), solute carrier family 40 (iron-regulated trans-porter), member 1(SLC40A1), TF, transferrin receptor 2(TFR2), transferrin receptor (TFRC), TMPRSS6, ABO, aryl hydrocarbon receptor nuclear translocator like (ARNTL), FADS2, N-acetyl-transferase 2 (arylamine N-acetylN-acetyl-transferase) (NAT2), testis expressed 14(TEX14)] (6). We investigated all variants for all iron traits, because several were associated with multiple iron traits. Eight of the twelve variants from Benyaminet al. general-ized to HCHS/SOL, with 5 generalizing for multiple iron traits (Table 3; Supplementary Material, Fig. S14.a–d).
There were a number of loci with different associations with iron traits in HCHS/SOL, compared with the European meta-analysis. For example, rs1800562 inHFEwas highly significant for ferritin in the discovery cohort, but it did not generalize and had a much lower estimated effect in HCHS/SOL (Supplementary Material, Fig. S14.d). This variant had strong as-sociations in HCHS/SOL with SAT, TIBC and serum iron, so lack of association with ferritin may not be simply due to lack of
power. Additionally, rs744653 near theWDR75–SLC40A1locus was associated with both ferritin and TF in Benyaminet al., but it was not associated with any iron trait in HCHS/SOL. Variants rs9990333 (nearTFRC), rs6486121 (inARNTL) and rs411988 (in
TEX14) also showed no evidence of generalization in HCHS/SOL. Finally, some variants that did generalize had confidence inter-vals that did not overlap with previously reportedb-values. For example,HFEvariant rs1800562 andTMPRSS6variant rs85579 consistently had more modest estimatedb-values in HCHS/SOL, suggesting differences in effect sizes between populations.
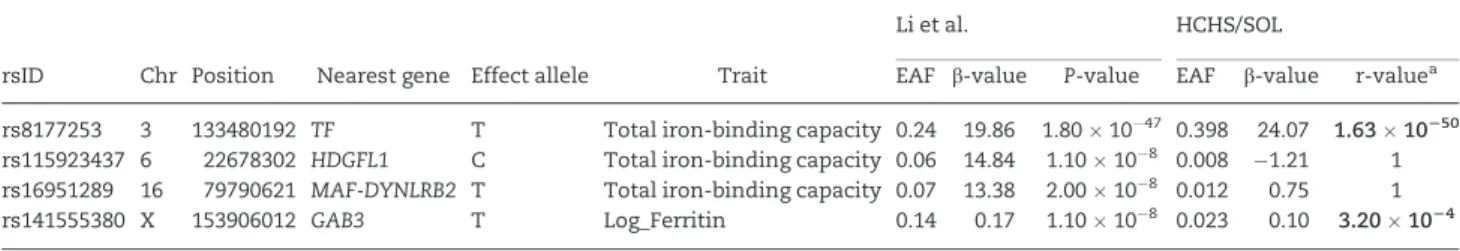
The largest analysis of iron-related traits in African Americans found four loci associated with ferritin and TIBC (7). Two of these generalized to HCHS/SOL (Table 4; Supplementary Material, Fig. S15.a and b). The estimated confidence intervals for the non-generalized loci are consistent with no association (rather than lack of power; Supplementary Material, Fig. 15.b). One variant was identified in an East Asian GWAS of ferritin, but the variant did not generalize to HCHS/SOL (rs5742933 on chromosome 2 (8),P¼0.122; not included inTables 3and4).
Associations of iron loci with glycemic traits
We tested the lead variants from each iron-associated locus for associations with glycemic traits: rs6762719 forTF, rs1799945 for
HFE, rs4841132 for PPP1R3B, rs174529 for FADS2/MYRF and rs855791 forTMPRSS6(Table 5). All effect alleles inTable 5 cor-respond to the iron raising allele, for easier interpretation of the
b-values.
The PPP1R3B locus.ThePPP1R3Bvariant was associated with higher fasting glucose (P¼7.70107
), insulin levels (P¼4.79
106
) and homeostasis model assessment of insulin resistance (HOMA-IR), a correlated, calculated measure of insulin resist-ance (P¼4.98107
). Adjustment for TIBC did not attenuate as-sociations ofPPP1R3Bwith glycemic traits, with little change in theP-values (insulin resistance,P¼1.02108
; fasting glucose,
P ¼5.05 107; fasting insulin, P ¼1.3 107) orb-values
(Supplementary Material, Table S8.a).
Other loci.The iron-raising alleles atTMPRSS6(rs855791,P¼
8.661010) andHFE(rs1799945,P¼2.44105) were
associ-ated withlowerHbA1c levels in HCHS/SOL. Adjustment for iron measures attenuated, but did not eliminate, the associations with HbA1c (Supplementary Material, Table S8.b). Adjustment for SAT most strongly attenuated the HFE association (P ¼
0.0166) and theTMPRSS6association (P¼2.40105). Iron is
therefore at least one of the likely mediators of the HbA1c associations.
An unweighted genetic risk score (GRS) based on the five sentinel SNPs was associated with lower HbA1c levels (P¼5.64
106) and was more nominally associated with higher
levels of fasting glucose (P ¼ 0.004) (multiple comparisons threshold,P<0.004;Table 5). These five sentinel SNPs together explain only a small percentage of the residual variance in iron traits (9.6% of TIBC, 1.8% of SAT, 1.6% of serum iron,<0.1% of ferritin), after adjusting for the potential confounders in our SNP association models (such as age, sex, heritage group and kinship). We also derived a 10-variant, unweighted GRS, based on the 5 sentinel SNPs plus 5 variants that generalized to HCHS/ SOL. Single variant associations for the five generalized SNPs with glycemic traits are shown in Supplementary Material, Table S9. The 10-variant GRS was associated with lower odds for diabetes (P¼1.43103) and lower HbA1c (P¼1.111015;
Table 5). For both the 5- and 10-variant scores, the association with HbA1c became non-significant when signals atHFEand
TMPRSS6(and GRB2 associated binding protein 3 (GAB3)for the 10-variant GRS) were removed (P>0.1). A more nominal associ-ation (P¼0.004) of the 5-variant score with higher fasting glu-cose was attenuated when the signal atPPP1R3Bwas removed (P>0.32).
Replication in other studies. We examined associations of our iron-related loci with T2D and related traits in published GWAS meta-analyses. No variant was associated with T2D status. The iron-raising allele of thePPP1R3B variant was associated with
higher fasting glucose (P¼3.35109) and higher fasting
insu-lin (P¼1.71109), as well as more nominally with higher
insu-lin resistance (P ¼ 0.001), as in HCHS/SOL (Supplementary Material, Table S10). SNPs at the loci forTMPRSS6(rs855791,P¼
2.741014) andHFE(rs1799945,P¼1.43104) were
associ-ated with lower HbA1c levels. MYRF/FADS2 proxy vari-ant rs174577 was strongly associated with higher fasting glucose (P¼1.541010) and more modestly with lowerb-cell function
(P ¼ 0.0001). The closely linked FADS1 gene is a recognized
Table 4.Generalization of iron related variants identified in African American populations by Liet al.(7) to the HCHS/SOL
Li et al. HCHS/SOL
rsID Chr Position Nearest gene Effect allele Trait EAF b-value P-value EAF b-value r-valuea
rs8177253 3 133480192 TF T Total iron-binding capacity 0.24 19.86 1.801047 0.398 24.07 1.6310250 rs115923437 6 22678302 HDGFL1 C Total iron-binding capacity 0.06 14.84 1.10108 0.008 1.21 1 rs16951289 16 79790621 MAF-DYNLRB2 T Total iron-binding capacity 0.07 13.38 2.00108 0.012 0.75 1 rs141555380 X 153906012 GAB3 T Log_Ferritin 0.14 0.17 1.10108 0.023 0.10 3.201024
Reportedb-values are from the generalization analysis, which used the same phenotype transformations as in Li et al. (7).
Gene symbols and abbreviations:TF, transferrin;HDGFL1, hepatoma derived growth factor-like 1;MAF-DYNLRB2, MAF bZIP transcription factor—dynein, light chain, roadblock-type 2;GAB3, GRB2 associated binding protein 3; EAF, effect allele frequency.
aSignificant r-values are bolded (r<0.05).
Table 5.Associations of iron-related loci with glycemic traits
rsID rs6762719 rs1799945 rs4841132 rs174529 rs855791
Chromosome 3 6 8 11 22
Position 133480817 26091179 9183596 61543961 37462936 GRSc
Gene TF HFE PPP1R3B FADS2/MYRF TMPRSS6 5-variant 10-variant
Iron raising allele A G A T G
Diabetes Odds ratio .95 0.97 1.00 1.03 0.92 0.99 0.99
P-valuea 0.225 0.622 0.983 0.554 0.060 0.075 1.431023
n 7746 7746 7745 7746 7746 7745 7745
2-h postload glucose b-valueb 0.063 1.367 1.652 0.537 0.691 0.458 0.388
P-value 0.885 0.035 0.002 0.229 0.103 0.035 0.021
n 9622 9622 9621 9622 9622 9621 9621
Fasting glucose b-value 0.132 0.115 0.706 0.266 0.209 0.167 0.092
P-value 0.257 0.499 7.701027 0.027 0.063 0.004 0.040
n 10065 10065 10064 10065 10065 10064 10064
Fasting insulin b-value 0.001 0.006 0.020 0.004 0.001 0.003 0.001
P-value 0.831 0.268 4.791026 0.323 0.824 0.129 0.371
n 10053 10053 10052 10053 10053 10052 10052
HbA1c b-value 0.006 0.031 0.009 0.013 0.030 0.012 0.016
Pvalue 0.235 2.441025 0.173 0.013 8.6610210 5.641026 1.1110215
n 9636 9636 9635 9636 9636 9635 9635
HOMA-B b-value 0.002 0.005 0.012 0.008 0.001 0.0002 0.00003
P-value 0.510 0.365 0.009 0.026 0.742 0.893 0.982
n 10045 10045 10044 10045 10045 10044 10044
HOMA-IR b-value 0.000 0.006 0.023 0.002 0.002 0.004 0.002
P-value 0.977 0.256 4.981027 0.543 0.649 0.062 0.248
n 10052 10052 10051 10052 10052 10051 10051
aSignificantP-values are bolded (P
<0.001 for single variant tests,P<0.004 for the GRS).
bAll
b-values are calculated with respect to the indicated iron raising alleles.
cThe GRSs are unweighted and based on either the five sentinel SNPs (5-variant) or the five sentinel SNPs plus 5 generalized SNPs from reported genome-wide
associ-ation studies (10-variant). The GRSs are calculated with respect to the iron raising alleles.
dA log base 10 transformation was used for fasting insulin, HOMA-IR and HOMA-B. Other glycemic trait measures were not transformed.
Gene symbols and abbreviations:TF, transferrin;HFE, hereditary hemochromatosis;PPP1R3B, protein phosphatase 1, regulatory subunit 3B;FADS2, fatty acid desatur-ase 2;MYRF, myelin regulatory factor;TMPRSS6, transmembrane protease, serine 6; HbA1c, glycated hemoglobin; HOMA-B, homeostasis model assessment ofb-cell function; HOMA-IR, homeostasis model assessment of insulin resistance.
genome-wide significant locus for fasting glucose and homeosta-sis model assessment ofb-cell function (HOMA-B) (22,23).
Discussion
Associations of variants with iron traits
In the HCHS/SOL cohort, we found genome-wide significant as-sociations of iron traits with four previously known loci (TF,
HFE, FADS2/MYRF, TMPRSS6) and identified a potential novel iron locus (PPP1R3B).
PPP1R3B is a subunit of the serine/threonine phosphatase, protein phosphatase-1 (PP1). PPP1R3B (originally called GL)
tar-gets PP1 to glycogen synthase in the liver, regulating glycogen storage. PPP1R3B is also highly expressed in human skeletal muscle (24). To our knowledge, there is no direct link between PPP1R3B and iron metabolism, and this variant has not been previously associated with iron traits. The observed association was replicated for TF in results from a European meta-analysis (6; Benyamin, personal communication). However, thePPP1R3B
association did not replicate in African Americans from the Jackson Heart Study—though the estimated association was in the same direction (7). The lack of replication could be due to differences in effect allele frequencies between populations, be-cause the identified variant has a higher effect allele frequency in admixed American populations in the 1000 Genomes refer-ence panel (compared with European, African, or Asian popula-tions). This higher frequency may have facilitated detection of the novel association with TIBC.
The SNP associated with TIBC (rs4841132) lies within a non-coding RNA locus (LOC157273)—roughly 200 kilobases away from thePPP1R3Bgene. Recent siRNA knockdown experiments suggest thatLOC157273, a hepatocyte specific transcript, regu-latesPPP1R3BmRNA levels (25). Moreover,LOC157273/PPP1R3B
locus variants have been associated with a variety of cardiome-tabolic phenotypes, including levels of LDL, HDL, total choles-terol (26), C-reactive protein (27), blood lactate (28), fat accumulation in the liver measured by computed tomography (29), fasting blood glucose (23), including levels during preg-nancy (30), fasting blood insulin (23) and liver enzymes (31). The potential pleiotropic effects of PPP1R3B or LOC157273 on these multiple cardiometabolic phenotypes warrant further study. The impact of the locus on iron traits in particular should be further assessed in diverse populations.
Generalization of previously observed variants
We attempted to generalize variant-phenotype associations observed in the largest GWAS analyses of European and African American populations (7). Eight of the twelve variants from the European meta-analysis generalized to HCHS/SOL for at least one iron trait. Two of the four variants from the African American study generalized. Several variants, including a variant near
GAB3 in African Americans and variants nearABO, NAT2and
FADS2in European Americans, have not been previously con-firmed in an independent study. Therefore, generalization to HCHS/SOL provides important validation of these results.
Other variants did not generalize to HCHS/SOL, including SNPs at WDR75–SLC40A1, TFRC, ARNTL and TEX14 from the European meta-analysis and hepatoma derived growth factor-like 1 (HDGFL1) and MAF bZIP transcription factor – dynein, light chain, roadblock-type 2 (MAF-DYNLRB2) from the African American meta-analysis. Lack of generalization may be due to different effect sizes in the original study population versus
HCHS/SOL. Alternatively, lack of power may have led to reduced precision in effect size estimation. For the variants from the European meta-analysis that did not generalize, the estimated directions of effects were consistent with those in HCHS/SOL (Supplementary Material, Figs S14.b and d) (6). For the two vari-ants from the African American meta-analysis that did not gen-eralize, the estimated direction of effect in HCHS/SOL was the same as in the original study for rs16951289, but not for rs115923437 (Supplementary Material, Fig. S15.b). Both variants had a much smaller effect allele frequency in HCHS/SOL than in the original analysis by Liet al.(7). Differences in allele frequen-cies are less extreme for the non-generalized variants from the European GWAS. Specifically, no non-generalized variant had a minor allele frequency<10% in either cohort. However, several variants do have lower minor allele frequencies in HCHS/SOL than in the Benyaminet al.meta-analysis, which may modestly impact power (e.g. rs9990333). Other possible reasons for lack of generalization include differences in causal variants or haplo-type structure between populations, gene–environment inter-actions and heterogeneity in environmental exposures between populations (such as iron in the diet), sampling error in either the original study or HCHS/SOL (such that the tested subpopula-tion does not represent the larger populasubpopula-tion), and unaccounted for sources of variance.
Apart from variants that did not generalize, some variants showed evidence of different effect sizes in HCHS/SOL. For ex-ample, HFE variant rs1800562 (p.Cys282Tyr) consistently showed a smaller effect size in HCHS/SOL than in the European meta-analysis – likely due to the higher prevalence of hereditary hemochromatosis and p.Cys282Tyr homozygotes in Europeans (10). TheTMPRSS6(rs855791) andTF(rs8177240) variants also had significantly lower estimated effect sizes in HCHS/SOL. The reasons for these population differences in effect size are un-clear. Differences in non-genetic factors between studies, such as socioeconomic status, demographic traits and diet, may play a role. However, our results generally support the role of known iron trait loci in a Hispanic/Latino population, suggesting that these alleles are derived from a common founder population.
Associations of variants with iron and diabetes related traits
Excess iron is epidemiologically associated with an increased incidence of T2D (15,16). Many mechanisms for this link have been proposed. Although iron is needed forb-cell function and survival, free iron gives rise to reactive oxygen species in these metabolically active cells. Excess iron may also influence glu-cose utilization in hepatic and adipose tissue. As a possible mechanism, high iron (like high oxygen) decreases levels of hypoxia inducible factors, which in turn reduces levels of glu-cose transporters and insulin secretion. Iron also may impact circadian rhythms in the liver (altering hepatic gluconeogene-sis) or mediate epigenetic effects, such as histone demethyla-tion (15,16). Therefore, associations of iron loci with diabetes and glycemic traits are of interest. Five sentinel SNPs were se-lected from among the iron related loci found in HCHS/SOL (TF, HFE, PPP1R3B, FADS2/MYRF and TMPRSS6). We hypothesized that alleles associated with raised iron levels may also be asso-ciated with increased diabetes risk.
PPP1R3B. The TIBC lowering and SAT raising allele for
PPP1R3Bvariant rs4841132 was associated with higher levels of fasting glucose, fasting insulin and insulin resistance in HCHS/ SOL. In earlier GWAS analyses, rs4841132 was associated with
higher fasting insulin and fasting glucose levels (23), including levels during pregnancy (30). As discussed earlier, PPP1R3B regu-lates glycogen storage in the liver, providing a potential mech-anistic link to glucose homeostasis (32). Adjustment for TIBC did not attenuate associations ofPPP1R3Bwith fasting glucose, fasting insulin, or insulin resistance. Therefore, iron is not a likely mediator of the observed diabetes-related effects of rs4841132. PPP1R3B or LOC157273 may instead have pleiotropic effects on both iron and glycemic phenotypes. An effect of a
PPP1R3Bvariant (rs9987289) on CRP levels in a previous study was similarly not attenuated by adjustment for HDL, LDL or total cholesterol (all traits associated with rs9987289). Lack of at-tenuation is compatible with pleiotropic effects on these traits (33). A number of iron loci identified here or in previous studies have been associated with lipid traits by the Global Lipids Genetics Consortium (PPP1R3B, FADS2, ABO, HFE, NAT2) (26), suggesting there may be shared determinants of lipids and iron that could have relevance to diabetes.
TMPRSS6 and HFE.Iron-raising alleles forTMPRSS6(rs855791,
P¼8.661010) andHFE(rs1799945,P¼2.44105) were
asso-ciated with lower HbA1c levels. Iron attenuated these associ-ations in HCHS/SOL. In support of our results, TMPRSS6
(rs855791) andHFE (rs1800562) variants were associated with lower HbA1c levels in a meta-analysis of nondiabetic adults of European descent (34). Red blood cell production involves iron, so we performed look-ups for our five sentinel variants with eight hematological traits in a previous HCHS/SOL GWAS (Supplementary Material, Table S11). Iron-raising variants of
HFEandTMPRSS6were associated with higher hemoglobin (P
8.20108), mean corpuscular volume (MCV) (P8.49106),
and mean corpuscular hemoglobin (MCH) (P 2.39 1011),
along with other red blood cell traits—similar to results from a European meta-analysis (35). Iron-raising alleles ofTMPRSS6(at rs855791) andHFE(at rs1799945 and rs1800562) may therefore contribute to increased hemoglobin levels (35)—resulting in a lower calculated percentage of HbA1c. Alternatively, iron may impact the rate of hemoglobin glycation. Iron-deficiency anemia has been associated with spuriously high HbA1c, compared with other markers of glycemia. Moreover, iron re-placement therapy lowers HbA1c and raises total hemoglobin levels in diabetic and non-diabetic individuals (36–38). Malondialdehyde, which is elevated in patients with iron defi-ciency anemia (38), can increase hemoglobin glycationin vitro, providing a possible mechanism (39). Further assessment of the role of genetic factors that influence iron traits on HbA1c as a screening tool for diabetes is warranted.
Genetic risk scores.Overall, we found few compelling ations with either a 5- or 10-variant GRS, except for an associ-ation with lower HbA1c—likely due to effects on red cells, instead of glucose.
No association with increased risk for diabetes was observed. We did see nominal associations with quantitative glycemic traits indicative of higher diabetes risk, e.g. higher fasting glucose.
Our results are consistent with the limited evidence for a link between iron variants and diabetes risk in previous studies. A GRS based on six iron variants was modestly associated with increased odds for diabetes among men in the Health Professionals Follow-Up Study (18). However, the association was not observed in women and was attenuated by BMI adjust-ment. In a Chinese cohort, the iron loweringTMPRSS6rs855791 A variant (with valine at position 736) was associated with lower plasma ferritin levels (b¼ 0.061,P¼0.002) and with modestly lower risk for T2D (OR 0.801, 95% CI 0.65–0.98;P¼0.031) (19).
Strengths and limitations
Our study represents the first GWAS of iron indices in a Hispanic/Latino cohort. Additional strengths are analyses of the impact of iron deficiency on SNP-iron trait associations (which were generally stronger when iron deficient individuals were excluded) and a formal generalization analysis of GWAS loci identified in European and African American populations. We hypothesize that excluding individuals with iron deficiency re-duces heterogeneity due to non-genetic factors, such as dietary iron, blood loss (among premenopausal women), regional back-ground and socioeconomic status. Limitations include lack of a sample size large enough for a more comprehensive evaluation of variants and inability to further explore reasons for lack of generalization. We were also unable to further clarify potential reasons for significant differences in effect sizes between popu-lations in the generalization analysis. The low variance in iron traits explained by our five sentinel SNPs limits our power to de-tect modest associations between the genetic determinants of iron levels (as assessed by a GRS) and diabetes or related traits. Identification of more variants associated with iron traits in larger Hispanic/Latino cohorts would improve power. We thus cannot exclude a modest effect of iron related variants on dia-betes related traits. Lack of differentiation between type 1 and type 2 diabetes (in a small percentage of cases) in HCHS/SOL may also impact our ability to detect associations with diabetes case/control status.
Future directions
Important future studies of iron genetics may include trans-ethnic meta-analyses and evaluations of iron biomarkers in additional Hispanic/Latino cohorts, which may help identify other iron-associated variants. Assessment of iron variants in multi-ethnic cohorts may also be useful for identifying reasons for lack of generalization between populations or different vari-ant effect sizes. Large scale sex-stratified analyses may also be an important future direction, as women generally have lower body iron stores (particularly premenopausal women). However, we observed no heterogeneity in effects between men and women for genome-wide significant loci in HCHS/SOL (by Cochran Q testing; results not shown). The lack of compelling associations of iron related SNPs with glycemic traits and dia-betes in HCHS/SOL should also be explored in additional ances-try groups, because a relationship between iron traits and diabetes may vary between populations.
Summary
Our results show the generalization of previously reported asso-ciations between iron traits andTF,HFE,FADS2/MYRF,TMPRSS6,
TFR2,NAT2,ABOandGAB3to a Hispanic/Latino population. We identified a potential novel iron locus,PPP1R3B, where lead vari-ant rs4841132 was associated with lower TIBC levels. The asso-ciation was replicated in summary statistics from a previous European meta-analysis and warrants further exploration. The
PPP1R3Bvariant was associated with higher fasting glucose and insulin levels, and higher insulin resistance, but these effects were unrelated to TIBC. None of the other iron variants was associated with increased risk for diabetes, either individually or as part of a GRS. Further research is needed to explore poten-tial links between the genetic determinants of iron and glucose homeostasis.
Materials and Methods
HCHS/SOLThe HCHS/SOL cohort began in 2006 as a prospective study of Hispanic/Latino populations in the USA. (40–42). From 2008 to 2011, 16 415 adults were recruited from a random sample of households in four communities (the Bronx, Chicago, Miami, and San Diego). Each Field Center recruited>4000 participants from diverse socioeconomic groups. Most participants self-identified as having Cuban, Dominican, Puerto Rican, Mexican, Central American or South American heritage. A total of 12 803 individuals consented for genotyping. The study protocol was approved by the institutional review boards of all collaborating institutions, and written informed consent was obtained for all participants. Here we use data collected from study participants at their first clinic visit.
Outcome measures
Tests used to characterize body iron stores included serum iron, TIBC and ferritin. Serum iron was measured on a Roche Modular P chemistry analyzer using a ferrozine reagent (Roche Diagnostics, Indianapolis, IN). Unsaturated iron binding cap-acity (UIBC) was assayed on the same sample, and TIBC was cal-culated by the formula: TIBC¼serum ironþUIBC. Ferritin was measured in serum with Roche reagents on a Cobas 6000 Analyzer (Roche Diagnostics), using a particle enhanced immu-noturbidimetric assay. SAT levels were calculated by the for-mula: SAT¼serum iron/TIBC100.
Diabetes mellitus status was defined using American Diabetes Association criteria (43). Individuals with a level of fasting (>8 h) glucose126 mg/dl, non-fasting (8 h) glucose or 2-h postload glucose from an oral glucose tolerance test (OGTT)
200 mg/dl, HbA1c6.5%, or who used a diabetes medication were defined as diabetes cases. Individuals with levels of fasting glucose <100 mg/dl, 2-h post-load glucose from an OGTT
<140 mg/dl, and HbA1c<5.6% were defined as diabetes controls. Individuals with intermediate values, which may indicate an increased risk for diabetes, were not included as controls. There were 2499 cases and 5247 controls defined by these criteria. The prevalence of diabetes among 18–29-year olds was only 2.6% in the entire HCHS/SOL cohort (20). We estimate that the preva-lence of T2D among diabetic individuals in our analysis is roughly>95% (with a small percentage of type 1 diabetes cases likely included), based on the low diabetes prevalence in younger HCHS/SOL participants. Diabetes cases were excluded from analyses of glycemic traits, including 2-h postload glucose from an OGTT, fasting glucose and insulin, HbA1c and the homeostasis model assessments of insulin resistance andb-cell function (HOMA-IR and HOMA-B).
Genotyping and imputation
Genotyping and imputation protocols have been described pre-viously in (44). Genotyping was performed by Illumina Microarray Services with a custom array [>2.5 million SNPs from the HumanOmni2.5-8v1-1 array and 150 000 custom SNPs; Illumina (San Diego, CA)]. Genotype data were cleaned and quality checked centrally at Illumina Microarray Services, LA Biomed, and the University of Washington, which heads the HCHS/SOL Genetic Analysis Center. SHAPEIT2 was used for pre-phasing (45), and imputation to the 1000 Genomes full, cosmo-politan phase 1 version 1 reference panel was completed using
IMPUTE2 (46). There were>25.5 million imputed genotypes, for a total of 27.7 million tested SNPs. We excluded variants with low minor allele counts (<30) and low imputation quality (<0.3) from all results shown.
Primary GWAS analysis
GWAS analyses of iron traits were performed in all individuals with genomic and iron trait data (12 375 participants for ferritin; 12 580 for serum iron; 12 586 for TIBC; and 12 589 for SAT). Extreme outliers were excluded (ferritin>10 000 ng/ml; serum iron>270mg/dl; TIBC >580mg/dl). Participants with malignant tumors of the blood or lymph system or bone cancer (n¼28), high immature granulocyte counts (n¼2), end-stage renal disease (n¼
46) or pregnancy at the time of iron trait measurement (n¼8) were excluded, as were participants on chemotherapy (n¼54).
To approximate a normal distribution, a log base 10 trans-formation was used for ferritin, and square root transtrans-formation was used for serum iron, TIBC and SAT. We used a mixed model approach implemented in the GENESIS package (GENetic EStimation and Inference in Structured samples) in R (version 2.0.1), which can account for population structure/ancestry in related individuals (47), to assess SNP associations with iron-related traits. A detailed description of the GWAS analysis methods for HCHS/SOL has been previously published in (48). SNP associations were adjusted for sex, age, cigarette use, heri-tage group (Mexican, Central American, South American, Cuban, Dominican, Puerto Rican), sampling design, kinship, household, census block, recruitment center and the first five ancestry principal components. Individuals who were outliers for ancestry principal components were excluded (n ¼ 56). Chromosome X was analyzed separately, with adjustment for chromosome X specific eigenvectors. The HCHS/SOL Genetic Analysis Center tracks all genome-wide analyses performed (see Supplementary Material, Table S12 for analysis identifica-tion numbers). Genomic inflaidentifica-tion was assessed with Q–Q plots. Variants withP<106were annotated with ANNOVAR (49) and
included in the online Supplementary Tables. We defined asso-ciations with P < 5 108
as genome-wide significant. LocusZoom plots (50) were used to visualize genome-wide sig-nificant loci, with LD for these plots calculated from HCHS/SOL genotype data. HaploReg v4.1 was used to explore the potential functional significance of identified lead variants (51).
To study the possibility that an associated locus may contain more than one distinct association signal, conditional analyses were done for each genome-wide significant locus using GENESIS. The lead variant was included as a covariate, with se-quential inclusion of the next lead variant until no genome-wide significant signals remained within 1 Mb.
Replication of novel signals
We attempted to replicate the associations for two novel genome-wide significant signals (for TIBC) by accessing sum-mary statistics from previous GWAS analyses for these variants. We contacted the lead authors of a meta-analysis of European populations (48 972 subjects from 11 discovery and eight repli-cation cohorts) (6) and a GWAS of African Americans in the Jackson Heart Study (2347 subjects from a population-based study from the Jackson, MS, metropolitan area) (7) to obtain these results. In Europeans, results for TF were used to replicate TIBC associations, because TF and TIBC levels are linearly
related (52,53). An association was considered replicated if the variant had the same direction of association andP<0.05.
Sensitivity analysis excluding individuals with iron deficiency
We also repeated our genome-wide analyses for ferritin, TIBC, serum iron and SAT after excluding individuals with iron defi-ciency (defined by ferritin values below the reference range:<25
mg/l for men and<15mg/l for women).
Generalization analysis
We tested loci identified in GWAS analyses in African American and European populations for generalization in HCHS/SOL. Following Soferet al. (54), the generalization null hypothesis takes into account both the discovery study and the generaliz-ing study (here HCHS/SOL). The generalization null hypothesis is rejected if evidence for SNP-phenotype association exists in both studies, with the same direction of association. As a first step, we estimated SNP-phenotype associations in HCHS/SOL using the same phenotype transformations that were used in the original study. Next, we tested the generalization null hy-pothesis, while controlling for the false discovery rate (FDR) due to multiple testing, by calculating FDR-controlling directional r-values (54) for all SNP associations. We concluded that an asso-ciation was generalized if the SNP-phenotype assoasso-ciation had an r-value < 0.05. All 12 variants from the European meta-analysis (6) were tested for generalization for all four iron traits in HCHS/SOL. However, the four variants from the African American GWAS were tested on only the significant trait from the original report, because association results were not avail-able for all iron traits (7).
Analysis of iron variants with glycemic traits
We chose a single lead variant from each identified iron locus to test for associations with diabetes and six glycemic traits [2-h postload glucose from an OGTT, fasting glucose and insulin, HbA1c, HOMA-IR (insulin resistance) and HOMA-B (b-cell func-tion)]. Five sentinel SNPs were assessed in this way, represent-ing the most significant SNP at all genome-wide significant loci and the near genome-wide significant locus at PPP1R3B. Associations withP<0.001 were accepted as significant, based on a correction factor of 1/35 (for testing five SNPs and seven traits).
To increase power, we derived an unweighted GRS based on the five sentinel SNPs (calculated with respect to iron raising al-leles). Sample sizes for GRS analyses depended on the number of participants with no missing genotypes for any of the vari-ants. We also derived a 10-variant, unweighted GRS, based on the 5 sentinel SNPs plus 5 previously reported variants (6,7) that generalized to HCHS/SOL (rs1800562 inHFE, rs7385804 inTFR2, rs4921915 nearNAT2, rs651007 nearABO, rs141555380 inGAB3). The five-variant GRS focused on loci that were genome-wide significant in HCHS/SOL. The 10-variant GRS more comprehen-sively examined all independent loci that showed evidence for influencing iron traits in HCHS/SOL. None of the generalized variants was in significant LD with the five sentinel SNPs (r2<0.1). Associations withP<0.004 were considered
sig-nificant for GRS analyses, based on a correction factor of 1/14 (for 2 GRS values and 7 traits).
We additionally assessed effects of our five iron-related loci on T2D status in a published trans-ethnic GWAS meta-analysis of European, East Asian, South Asian, Mexican and Mexican American ancestry individuals (55). Examination of previous European ancestry GWAS results was also performed for gly-cemic traits, including 2-hour post-load glucose from OGTT data (56), fasting glucose and insulin (unadjusted for BMI) (23), HbA1c (34), HOMA-IR and HOMA-B (22) in nondiabetic individ-uals. Data on glycemic traits were contributed by MAGIC inves-tigators (downloaded from www.magicinvesinves-tigators.org). Data were not available from these GWAS meta-analyses for rs174529 (FADS2/MYRF) or rs6762719 (TF), so proxy SNPs were selected. We chose to analyze the lead European variants at these loci (rs8177240 forTFand rs174577 for FADS2), because both generalized to HCHS/SOL and were strongly associated with our iron traits of interest.
Look-up of HCHS/SOL hematological trait results
We performed look-ups for our five sentinel iron variants in a previous HCHS/SOL GWAS on hematological traits (red blood cell count, hemoglobin, hematocrit, MCV, MCH, mean corpuscu-lar hemoglobin concentration, red blood cell distribution width, platelet count). All complete blood counts were assessed at the central laboratory at the University of Minnesota Medical Center, Fairview, in Minneapolis. We used a multiple testing corrected significance threshold ofP<0.001.
Supplementary Material
Supplementary Material is available atHMGonline.
Acknowledgements
We thank the staff and participants of HCHS/SOL for their im-portant contributions. We also thank the authors of reported iron-related analyses for providing look-up of novel associ-ations (Benyaminet al.and Liet al.). The HCHS/SOL is a collab-orative study supported by contracts from the National Heart, Lung, and Blood Institute (NHLBI) to the University of North Carolina (N01- HC65233), University of Miami (N01-HC65234), Albert Einstein College of Medicine (N01-HC65235), Northwestern University (N01-HC65236) and San Diego State University (N01-HC65237).
Conflict of Interest statement. None declared.
Funding
The Genetic Analysis Center at the University of Washington was supported by NHLBI and NIDCR contracts (HHSN268201300005C AM03 and MOD03). The following Institutes/Centers/Offices con-tribute to the HCHS/SOL through a transfer of funds to the NHLBI: National Institute on Minority Health and Health Disparities, National Institute on Deafness and Other Communication Disorders, National Institute of Dental and Craniofacial Research, National Institute of Diabetes and Digestive and Kidney Diseases, National Institute of Neurological Disorders and Stroke, NIH Institution-Office of Dietary Supplements. Dr Raffield is sup-ported by a training grant (T32HL129982) from the NHLBI, and Dr Qi is supported by a Scientist Development Award (K01HL129892) from the NHLBI. The views expressed in this article are those of the authors and do not necessarily represent the views of the
National Heart, Lung, and Blood Institute; the National Institutes of Health; or the U.S. Department of Health and Human Services.
References
1. Ganz, T. (2013) Systemic iron homeostasis.Physiol. Rev.,93, 1721–1741.
2. Silva, B. and Faustino, P. (2015) An overview of molecular basis of iron metabolism regulation and the associated path-ologies.Biochim. Biophys. Acta,1852, 1347–1359.
3. Wu, X.G., Wang, Y., Wu, Q., Cheng, W.H., Liu, W., Zhao, Y., Mayeur, C., Schmidt, P.J., Yu, P.B., Wang, F.et al. (2014) HFE interacts with the BMP type I receptor ALK3 to regulate hep-cidin expression.Blood,124, 1335–1343.
4. Adams, P.C. and Barton, J.C. (2007) Haemochromatosis.
Lancet,370, 1855–1860.
5. Whitfield, J.B., Cullen, L.M., Jazwinska, E.C., Powell, L.W., Heath, A.C., Zhu, G., Duffy, D.L. and Martin, N.G. (2000) Effects of HFE C282Y and H63D polymorphisms and poly-genic background on iron stores in a large community sam-ple of twins.Am. J. Hum. Genet.,66, 1246–1258.
6. Benyamin, B., Esko, T., Ried, J.S., Radhakrishnan, A., Vermeulen, S.H., Traglia, M., Gogele, M., Anderson, D., Broer, L., Podmore, C.et al. (2014) Novel loci affecting iron homeo-stasis and their effects in individuals at risk for hemo-chromatosis.Nat. Commun.,5, 4926.
7. Li, J., Lange, L.A., Duan, Q., Lu, Y., Singleton, A.B., Zonderman, A.B., Evans, M.K., Li, Y., Taylor, H.A., Willis, M.S.
et al. (2015) Genome-wide admixture and association study of serum iron, ferritin, transferrin saturation and total iron binding capacity in African Americans.Hum. Mol. Genet.,24, 572–581.
8. Liao, M., Shi, J., Huang, L., Gao, Y., Tan, A., Wu, C., Lu, Z., Yang, X., Zhang, S., Hu, Y.et al. (2014) Genome-wide associ-ation study identifies variants in PMS1 associated with serum ferritin in a Chinese population.PLoS One,9, e105844. 9. McLaren, C.E., McLachlan, S., Garner, C.P., Vulpe, C.D.,
Gordeuk, V.R., Eckfeldt, J.H., Adams, P.C., Acton, R.T., Murray, J.A., Leiendecker-Foster, C.et al. (2012) Associations between single nucleotide polymorphisms in iron-related genes and iron status in multiethnic populations.PLoS One,
7, e38339.
10. McLaren, G.D. and Gordeuk, V.R. (2009) Hereditary hemo-chromatosis: insights from the Hemochromatosis and Iron Overload Screening (HEIRS) Study. Hematology Am. Soc. Hematol. Educ. Program, 195–206.
11. Beutler, E. and West, C. (2005) Hematologic differences be-tween African-Americans and whites: the roles of iron defi-ciency and alpha-thalassemia on hemoglobin levels and mean corpuscular volume.Blood,106, 740–745.
12. Root, H. (1929) Insulin resistance and bronze diabetes.N Engl. J. Med.,201, 201–206.
13. Merkel, P.A., Simonson, D.C., Amiel, S.A., Plewe, G., Sherwin, R.S., Pearson, H.A. and Tamborlane, W.V. (1988) Insulin re-sistance and hyperinsulinemia in patients with thalassemia major treated by hypertransfusion. N. Engl. J. Med., 318, 809–814.
14. Mendler, M.H., Turlin, B., Moirand, R., Jouanolle, A.M., Sapey, T., Guyader, D., Le Gall, J.Y., Brissot, P., David, V. and Deugnier, Y. (1999) Insulin resistance-associated hepatic iron overload.Gastroenterology,117, 1155–1163.
15. Fernandez-Real, J.M., McClain, D. and Manco, M. (2015) Mechanisms linking glucose homeostasis and iron
metabolism toward the onset and progression of type 2 dia-betes.Diabetes Care,38, 2169–2176.
16. Simcox, J.A. and McClain, D.A. (2013) Iron and diabetes risk.
Cell Metab.,17, 329–341.
17. Ford, E.S. and Cogswell, M.E. (1999) Diabetes and serum fer-ritin concentration among U.S. adults. Diabetes Care, 22, 1978–1983.
18. He, M., Workalemahu, T., Manson, J.E., Hu, F.B. and Qi, L. (2012) Genetic determinants for body iron store and type 2 diabetes risk in US men and women.PLoS One,7, e40919. 19. Gan, W., Guan, Y., Wu, Q., An, P., Zhu, J., Lu, L., Jing, L., Yu, Y.,
Ruan, S., Xie, D.et al. (2012) Association of TMPRSS6 poly-morphisms with ferritin, hemoglobin, and type 2 diabetes risk in a Chinese Han population. Am. J. Clin. Nutr., 95, 626–632.
20. Schneiderman, N., Llabre, M., Cowie, C.C., Barnhart, J., Carnethon, M., Gallo, L.C., Giachello, A.L., Heiss, G., Kaplan, R.C., LaVange, L.M.et al. (2014) Prevalence of diabetes among Hispanics/Latinos from diverse backgrounds: the Hispanic Community Health Study/Study of Latinos (HCHS/SOL).
Diabetes Care,37, 2233–2239.
21. Nai, A., Pagani, A., Silvestri, L., Campostrini, N., Corbella, M., Girelli, D., Traglia, M., Toniolo, D. and Camaschella, C. (2011) TMPRSS6 rs855791 modulates hepcidin transcription in vitro and serum hepcidin levels in normal individuals.Blood,118, 4459–4462.
22. Dupuis, J., Langenberg, C., Prokopenko, I., Saxena, R., Soranzo, N., Jackson, A., Wheeler, E., Glazer, N., Bouatia-Naji, N., Gloyn, A.et al. (2010) New genetic loci implicated in fast-ing glucose homeostasis and their impact on type 2 diabetes risk.Nat. Genet.,42, 105–116.
23. Manning, A.K., Hivert, M.F., Scott, R.A., Grimsby, J.L., Bouatia-Naji, N., Chen, H., Rybin, D., Liu, C.T., Bielak, L.F., Prokopenko, I. et al. (2012) A genome-wide approach ac-counting for body mass index identifies genetic variants influencing fasting glycemic traits and insulin resistance.
Nat. Genet.,44, 659–669.
24. Munro, S., Cuthbertson, D.J., Cunningham, J., Sales, M. and Cohen, P.T. (2002) Human skeletal muscle expresses a glycogen-targeting subunit of PP1 that is identical to the insulin-sensitive glycogen-targeting subunit G(L) of liver.
Diabetes,51, 591–598.
25. Lipovich, L., Manning, A., Goustin, A., Leong, A., Morrison, A.C., Brody, J., Liu, C., Brown, J.B., Chen, Y., Sladek, R.et al. (2016) In American Diabetes Association Meeting, New Orleans, LA.
26. Willer, C.J., Schmidt, E.M., Sengupta, S., Peloso, G.M., Gustafsson, S., Kanoni, S., Ganna, A., Chen, J., Buchkovich, M.L., Mora, S.et al. (2013) Discovery and refinement of loci associated with lipid levels.Nat. Genet.,45, 1274–1283. 27. Dehghan, A., Dupuis, J., Barbalic, M., Bis, J.C., Eiriksdottir, G.,
Lu, C., Pellikka, N., Wallaschofski, H., Kettunen, J., Henneman, P.et al. (2011) Meta-analysis of genome-wide as-sociation studies in>80 000 subjects identifies multiple loci for C-reactive protein levels.Circulation,123, 731–738. 28. Tin, A., Balakrishnan, P., Beaty, T.H., Boerwinkle, E.,
Hoogeveen, R.C., Young, J.H. and Kao, W.H. (2016) GCKR and PPP1R3B identified as genome-wide significant loci for plasma lactate: the Atherosclerosis Risk in Communities (ARIC) study.Diabet Med,33, 968–975.
29. Speliotes, E.K., Yerges-Armstrong, L.M., Wu, J., Hernaez, R., Kim, L.J., Palmer, C.D., Gudnason, V., Eiriksdottir, G., Garcia, M.E., Launer, L.J.et al. (2011) Genome-wide association ana-lysis identifies variants associated with nonalcoholic fatty