doi: 10.1093/cercor/bhw403
Advance Access Publication Date: 7 January 2017 Original Article
O R I G I N A L A R T I C L E
Joint Attention and Brain Functional Connectivity
in Infants and Toddlers
Adam T. Eggebrecht
1
, Jed T. Elison
2
, Eric Feczko
3
, Alexandre Todorov
4
,
Jason J. Wolff
5
, Sridhar Kandala
4
, Chloe M. Adams
4
, Abraham Z. Snyder
1
,
John D. Lewis
6
, Annette M. Estes
7
, Lonnie Zwaigenbaum
8
,
Kelly N. Botteron
1,4
, Robert C. McKinstry
1
, John N. Constantino
4
,
Alan Evans
6
, Heather C. Hazlett
9
, Stephen Dager
10
, Sarah J. Paterson
11,12
,
Robert T. Schultz
11
, Martin A. Styner
9
, Guido Gerig
13
, Samir Das
6
,
Penelope Kostopoulos
6
, The IBIS Network
†
, Bradley L. Schlaggar
14
,
Steven E. Petersen
14
, Joseph Piven
9,
‡
and John R. Pruett, Jr
4,
‡
1
Mallinckrodt Institute of Radiology, Washington University School of Medicine, St Louis, MO 63110, USA,
2Institute of Child Development, University of Minnesota, Minneapolis, MN 55455, USA,
3Department of
Behavioral Neuroscience, Oregon Health & Sciences, Portland, OR 97239, USA,
4Department of Psychiatry,
Washington University School of Medicine, St Louis, MO 63110, USA,
5Department of Educational Psychology,
University of Minnesota, Minneapolis, MN 55455, USA,
6McConnell Brain Imaging Center, Montreal
Neurological Institute, McGill University, Montreal, QC H3A 2B4, Canada,
7Department of Speech and Hearing
Sciences, University of Washington, Seattle, WA 98195, USA,
8Department of Psychiatry, University of Alberta,
1E1 Walter Mackenzie Health Sciences Centre (WMC), Edmonton, AB T6G 2B7, Canada,
9Department of
Psychiatry, University of North Carolina at Chapel Hill, Chapel Hill, NC 27514, USA,
10Department of Radiology,
University of Washington, Seattle, WA 98195, USA,
11The Children
’
s Hospital of Philadelphia, University of
Pennsylvania, Philadelphia, PA 19104, USA,
12Department of Psychology, Temple University, Philadelphia, PA
19122, USA,
13Tandon School of Engineering, New York University, Brooklyn, NY 11201, USA and
14Department
of Neurology, Washington University School of Medicine, St Louis, MO 63110, USA
Address correspondence to Adam T. Eggebrecht, Mallinckrodt Institute of Radiology, Washington University School of Medicine, 660 S. Euclid Ave, St Louis, MO 63110, USA. Email: [email protected].
†The Infant Brain Imaging Study (IBIS) Network is an NIH funded Autism Centers of Excellence project and consists of a consortium of eight universities
in the United States and Canada. Clinical Sites: University of North Carolina: J. Piven (IBIS Network PI), H.C. Hazlett, C. Chappell; University of Washington: S. Dager, A. Estes, D. Shaw; Washington University: K. Botteron, R. McKinstry, J. Constantino, J. Pruett; Children’s Hospital of Philadelphia: R. Schultz, S. Paterson; University of Alberta: L. Zwaigenbaum; University of Minnesota: J. Elison; Data Coordinating Center: Montreal Neurological Institute: A.C. Evans, D.L. Collins, G.B. Pike, V. Fonov, P. Kostopoulos; S. Das; Image Processing Core: New York University: G. Gerig; University of North Carolina: M. Styner; Statistical Analysis Core: University of North Carolina: H. Gu.
‡Co-senior authors.
© The Author 2017. Published by Oxford University Press.
Abstract
Initiating joint attention (IJA), the behavioral instigation of coordinated focus of 2 people on an object, emerges over thefirst 2 years of life and supports social-communicative functioning related to the healthy development of aspects of language, empathy, and theory of mind. Deficits in IJA provide strong early indicators for autism spectrum disorder, and therapies targeting joint attention have shown tremendous promise. However, the brain systems underlying IJA in early childhood are poorly understood, due in part to significant methodological challenges in imaging localized brain function that supports social behaviors during thefirst 2 years of life. Herein, we show that the functional organization of the brain is intimately related to the emergence of IJA using functional connectivity magnetic resonance imaging and dimensional behavioral assessments in a large semilongitudinal cohort of infants and toddlers. In particular, though functional connections spanning the brain are involved in IJA, the strongest brain-behavior associations cluster within connections between a small subset of functional brain networks; namely between the visual network and dorsal attention network and between the visual network and posterior cingulate aspects of the default mode network. These observations mark the earliest known description of how functional brain systems underlie a burgeoning fundamental social behavior, may help improve the design of targeted therapies for neurodevelopmental disorders, and, more generally, elucidate physiological mechanisms essential to healthy social behavior development.
Key words:development, enrichment, fMRI, initiating joint attention, network
Introduction
The emergence of joint attention (JA), the coordinated orienting of 2 people toward an object or event, occurs during thefirst 2 years of life, arguably the most dynamic and important period of early child development (Scaife and Bruner 1975). It is theo-rized that engaging in JA lays the foundation for prosocial cooperative behavior, from basic social-communicative func-tioning and language development (Premack 2004) to sophisti-cated forms of empathy (Mundy and Jarrold 2010) and theory of mind (Adolphs 2003). In fact, early exhibition of joint attention is strongly associated with later language ability (Morales et al. 2000;Mundy et al. 2007), and atypical development of the initi-ation of joint attention (IJA) is strongly indicative of autism spectrum disorder (ASD) (Bruinsma et al. 2004). The neural sub-strates underlying IJA in early childhood are poorly understood (Barak and Feng 2016), due in part to significant methodological challenges in imaging localized brain function that supports social behaviors in children during thefirst 2 years of life.
Developmental trajectories, evident during thefirst 2 years of life via directly observed behavior, physiology, or networks of genetic transcription or brain function (Lin et al. 2008;Gao et al. 2009; Fransson et al. 2011; Smyser et al. 2011; Petersen and Posner 2012; Toulmin et al. 2015), may illuminate underlying mechanisms of normative function and may be predictive of neurodevelopmental disorders (Tsodyks et al. 1999; Parikshak et al. 2015; Richiardi et al. 2015). During early childhood, the sequential emergence and consolidation of social behaviors (i.e., eye gaze following [Emery 2000], responding to a bid for joint attention [RJA] [Scaife and Bruner 1975;Elison et al. 2013], initiat-ing joint attention [Mundy et al. 2000]) exhibit a distinctive cas-cading and phylogenetically preserved trajectory (Carpenter et al. 1998;Tomasello and Carpenter 2007;Okamoto-Barth et al. 2011), with an infant’s capacity for IJA manifesting as a key ontogenetic watershed (Tomasello et al. 2005). Recent studies in adults using functional magnetic resonance imaging (fMRI) have shown that regions recruited in acts of both RJA and IJA are distributed throughout fronto-temporal-parietal cortices and populate social-cognitive, voluntary attention, orienting, and visual net-works (Redcay et al. 2012;Caruana et al. 2015), as well as subcor-tical and cingulate areas involved in reward processing (Schilbach et al. 2010;Pfeiffer et al. 2014;Oberwelland et al. 2016).
While some of this work incorporated a developmental sample including school-aged participants (Oberwelland et al. 2016) and participants with ASD (Redcay et al. 2013b), a key question is how the emergence of IJA relates to the maturation of the brain’s functional networks during typical and atypical early develop-ment (Barak and Feng 2016;Chahrour et al. 2016). Because we expect IJA behaviors to potentially serve different functions at different ages, we do not necessarily expect to observe a down-ward extension of the adult or school-aged participantfindings to infants and toddlers. Thus, we are taking a data-driven strat-egy to test the brain-behavior relationships underlying IJA.
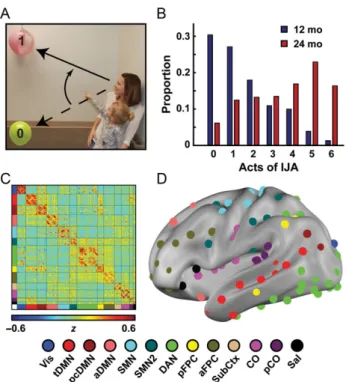
In the current study, we tested the extent of the relationship between IJA and functional connections between brain networks over the period of emergence and consolidation of IJA. We mea-sured the frequency of spontaneous acts of IJA (Fig.1A) by 12-month-old (mo) infants and 24 mo toddlers using a semistruc-tured dimensional behavioral assessment. Separately, we mea-sured brain functional networks in the same group of infants and toddlers using resting-state functional connectivity MRI (fcMRI) (Power et al. 2011). We hypothesized that IJA would be significantly correlated with a limited set of interactions between functional brain regions, and that these associations would change over time. To determine which functional networks sig-nificantly contribute to the overall brain-behavior relationship, we utilized an enrichment analysis adapted from research in large-scale genetic association studies (Backes et al. 2014), a novel strategy for analyzing neuro-behavioral relationships.
Materials and Methods
Participants
study. Behavioral assessments and MRI data were acquired at each site, and the data were used for research purposes only.
Inclusion Criteria
To maximize variance in a dimensional measure of IJA, we enrolled children who were at HR for developing ASD as well as children with LR (typically developing control participants) for developing ASD. Children at high risk for developing ASD carry a familial liability typically associated with behaviors, such as impaired IJA, subthreshold to a full autism diagnosis, but distrib-uted along a continuum. The HR infants were defined as having at least one sibling with an ASD diagnosis, and LR infants had at least one typically developing older sibling and did not have any
first- or second-degree family members with ASD or intellectual disability. Participants were excluded for comorbid medical or neurological diagnoses influencing growth, development, or cog-nition; prior genetic conditions; premature birth or low birth weight; maternal substance abuse during pregnancy; contraindi-cation for MRI; or familial history of psychosis, schizophrenia, or bipolar disorder (Wolff et al. 2012;Elison et al. 2013). All infants and toddlers included in these analyses participated in a com-prehensive battery of behavioral assessments and received an Autism Diagnostic Observation Schedule (ADOS,Gotham et al. 2007) at 24 months. ADOSs and all other testing and interview data were independently reviewed by experienced clinicians for DSM-IV-TR (American Psychiatric Association 2000) criteria for autistic disorder or pervasive developmental disorder not other-wise specified. This paper includes data from infants who, at 24 months of age, did and did not meet criteria for ASD according
to research clinical best estimate using a DSM-IV-TR checklist. The children with a positive diagnosis were included to extend the range of observed IJA behavior at each age group. The age groups did not differ by proportion of children later diagnosed with ASD (Fisher’s exact test,P=0.29).
Demographics
Two cohorts were defined: children were assessed at visits cor-responding to 12- and 24-mo age groups (ranges: 11.7–14.5 mo and 23.5–25.9 mo, respectively, Supplementary Table 1). All data sets were subject to stringent fcMRI quality control criteria and Infant Brain Imaging Study (IBIS) Network behavioral and structural MRI inclusion criteria. Data sets passing all inclusion criteria for both the Communication and Symbolic Behavioral Scale (CSBS) and MRI includeN=116 at 12 andN=98 at 24 months of age, with 37 individuals providing data at both time points. Age groups did not significantly differ by proportion of HR participants (P=0.99), girls (P=0.32), or IQ (Mullen compo-site standard score,t=−0.92, df=687,P=0.18).
Assessment of IJA Behavior
IJA behavior was assessed at IBIS Network clinical sites with the Communication and Symbolic Behavioral Scales-Developmental Profile (CSBS-DP) (Wetherby et al. 2002), which is designed to eli-cit social and communicative behaviors in infants and toddlers between 12 and 24 months of age (Fig. 1B). The interaction between examiner and infant is divided into 6 sampling oppor-tunities: wind-up toy, balloon, bubbles, jar, books, and play, with the complete assessment generally lasting up to 30 min. The metric used for our study is calculated as the number of sampling opportunities that included one or more acts of IJA, defined as an act used to direct another’s attention to an object, event, or topic of a communicative act (Wetherby et al. 2002): “The child’s goal is to get the adult to look at or notice some-thing,”(Question #7 of the CSBS). Acts for IJA are carefully dis-tinguished from acts used for behavioral regulation (e.g., requesting as action) and acts that are used to draw the adult’s attention to the self (an act of social interaction but not expli-citly IJA). Assessments are video recorded and scored by research-reliable expert raters to ensure accuracy and intersite and intrasite reliability across the IBIS network. There was no effect of site on IJA scores (F=0.97, P=0.41), and age-in-months was not correlated with IJA score within time point (12 mo:ρ=0.03,P=0.46 and 24 mo:ρ=−0.02,P=0.68).
Image Acquisition
All scans were acquired at IBIS Network clinical sites using iden-tical 3-T Siemens TIM Trio scanners (Siemens Medical Solutions) equipped with standard 12-channel head coils. Infants were naturally sleeping. The IBIS imaging protocol includes T1-weighted (T1W) and T2W anatomical imaging, 25-direction DTI and 65-25-direction HARDI DWI diffusion sequences, and resting-state fcMRI (Wolff et al. 2012). This study made use of the 3D sagittal T2W sequence (time echo [TE]=497 ms, time repetition [TR]=3200 ms, matrix 256×256×160, 1 mm3voxels). Functional images were collected as a gradient-echo echo pla-nar image (TE=27 ms, TR=2500 ms, voxel size 4×4×4 mm3,
flip angle 90°,field of view 256 mm, matrix 64×64, bandwidth 1906 Hz). All included infants provided at least 2 fMRI runs, each run comprising 130 temporally contiguous frames (6.25 min).
Conditioning Infants for MRI Scanning
A multistep conditioning approach was developed for acquiring optimally reliable and successful MRI data in unsedated and naturally sleeping infants and toddlers. First, parents were sent a CD containing MRI sounds along with instructions to play the CD at an increasingly loud volume every night at the infant’s bedtime. The CD was played at home for 7–10 days. On the night of the scan, a nonmagnetic crib and rocking chair were placed in the scanner suite, and all lights in the room were turned off. Child sized earplugs were placed in the infants’ears and secured with a piece of tape. If appropriate, infants were also swaddled. The MRI CD was then streamed into the room and played during the scanning session. The parent and the infant followed their normal bedtime routine in the room, often feeding the child and rocking them to sleep. Once the infant fell naturally to sleep, the study team waited an additional 20 min before moving the infant to the MRI table. Babies, able to be scanned prone, supine, or on their side, were placed on the table in their most common sleeping position. Sandbags were placed on the sides of the infant to help stabilize and pre-vent rolling over. MRI compatible sound diminishing head-phones were placed on the child, and the infant was allowed to sleep for 20 more minutes to enter a deeper sleep before the scan was initiated. Once the scan began, a research technician stayed in the room, at the foot of the scanner to carefully moni-tor the infant. If the baby awoke at any time, the scan was immediately suspended and the process was reinitiated. When feasible, MRI scan visits were scheduled in the evening as close to the infant’s normal bedtime as possible and usually lasted 2–4 h. We did not track if participants arrived to the scanning session awake or alternatively for how long they had been asleep. The sleep stages of the participants while they were undergoing their functional MRI scans may be more variable than if all participants arrived awake.
fMRI Preprocessing
Initial fMRI data preprocessing followed previously described procedures (Smyser et al. 2010;Pruett et al. 2015). These proce-dures included 1) compensation for slice-dependent time shifts using sinc interpolation, 2) correction of systematic odd–even slice intensity differences caused by interleaved acquisition, and 3) spatial realignment to compensate for head motion within and across fMRI runs. The fMRI data were intensity scaled (one multiplicative constant over all voxels and frames) to obtain a whole brain mode value of 1000 (Ojemann et al. 1997). Such scaling facilitates the computation of variance mea-sures for purposes of quality assessment but does not alter computed correlations. Atlas registration of functional data was achieved by a sequence of affine transforms (fMRI average vol-ume—T2W—atlas-representative target). Age-specific (12 and 24 months) atlas-representative targets (Fonov et al. 2011) were used to account for shape differences across developmental age categories. Following fMRI—T2W—atlas transform composition, the volumetric time series were resampled in atlas space (3 mm3voxels) including correction for head movement in a sin-gle resampling step. Each atlas-transformed functional data set was visually inspected in sagittal, transverse, and coronal views to exclude potential errors not otherwise identified.
Frame Censoring
Head motion, even of submillimeter magnitude, has been
identi-fied as a nonphysiological source of spurious variance in
resting-state fMRI data (Power et al. 2012; Van Dijk et al. 2012; Satterthwaite et al. 2013). Data were subjected to rigorous frame censoring (“superscrubbing”) based on the frame-to-frame dis-placement (FD) measure (Power et al. 2014), which sums 3 abso-lute translations (X, Y, Z) and 3 absoabso-lute rotations (Pitch, Yaw, Roll) evaluated at a radius of 50 mm. Frames with FD≥0.2 mm were marked for subsequent censoring. Temporally isolated (5 or fewer contiguous) FD<0.2 mm frames were also censored. fMRI runs with fewer than 30 uncensored frames were discarded. To control for potential biases attributable to the amount of data per cohort, 150 noncensored (retained) fMRI frames were used, prioritizing runs with the most retained frames, for correlation analysis in each subject.
fcMRI Preprocessing
P=0.57 and 24 mo:ρ=−0.1,P=0.89). In the end, all participants contributed exactly 150 frames clean for analyses.
Definition of ROI and Functional Connectivity Computation
ROIs (n=280) were adopted from a combination of task data and cortical functional areal parcellations (Cohen et al. 2008) obtained in healthy adults (Power et al. 2011), and meta-analyses of autism studies (Philip et al. 2012). Three viewers inspected ROI placements in age-specific atlas templates. Of the 280 ROIs, 50 were partially outside the whole brain mask or showed visible differences in gray-matter coverage at different ages. These ROIs were removed leaving 230 usable ROIs (Supplementary Fig. 1A, Supplementary Spreadsheet 1) (Pruett et al. 2015). ROI-representative time series were calculated as the average of the time series across all gray-matter voxels contained by the 10-mm-diameter sphere located at a given ROI center. Pairwise Pearson correlation values were gener-ated for each of the 26 335 possible pairs of ROI and then Fisher-z transformed.
Derivation of Putative Functional Networks in Infants and Toddlers
A model for the organization of functional brain networks rep-resentative of the infants and toddlers in the study was gener-ated using a set of clean fcMRI data from 48 children acquired at both the 12- and 24-month time points (Fig.1C,D). Closely following previous methods (Power et al. 2011), the full set of ROI-pair correlations (Fisher-z values) were averaged across subjects (Fig.1C). The resulting average set of correlations were thresholded and binarized at a variety of correlation thresholds calculated to create connection matrices with specific degrees of sparseness (ranging from 1% to 10% of all possible connec-tions surviving the threshold, in steps of 0.01%). Connecconnec-tions between ROI pairs separated by an Euclidean distance of <20 mm were removed to minimize the effects of blurring in the fMRI data. At each threshold, the resulting connection matrices were evaluated using the Infomap algorithm (Rosvall and Bergstrom 2008) that assigns ROIs to communities (subnet-works) at each correlation threshold based on the maximiza-tion of within-module random walks in the connecmaximiza-tion matrix. Communities with 5 or fewer ROIs were designated“en masse” as Unassigned (US). The solutions for each threshold were then combined using an algorithmic “consensus” procedure that combined Infomap solutions across edge density thresholds by maximizing the normalized mutual information of groups of neighboring solutions and maximizing the modularity of thefinal consensus model. This provided a reasonable single summary view of the functional networks of the brain. This consensus model of the combined infant–toddler functional network of the brain includes 13 putative networks with naming informed by the adult set of networks: Vis (visual), tDMN (temporal default mode network), pcDMN (posterior cingulate DMN), aDMN (anterior DMN), SMN (somato-motor network), SMN2 (somato-motor network 2), DAN (dorsal attention network), pFPC (posterior frontal parietal control network), aFPC (anterior frontal parietal control network), SubCtx (subcortex), CO (cingulo-opercular), pCO (posterior CO), and Sal (salience). To generate complementary analyses using adult-functional networks, we adapted a previously published model of adult-functional networks (Power et al. 2011) (Supplementary Fig. 1C).
Statistical Analysis
Demographic characteristics were recorded at visits correspond-ing to the 12- and 24-mo time points (ranges: 11.7–14.5 mo and 23.5–25.9 mo, respectively). Potential group differences between age groups in proportion of HR participants, proportion of chil-dren later diagnosed with ASD and proportion of girls were tested with Fisher’s exact test. Potential differences in intelli-gence assessed via the Mullen Scales of Early Learning compos-ite score were tested with Welch’st-test. The potential effect of site on IJA score was tested using a one-way ANOVA. To ensure the subset of participants who contributed fcMRI data that represent the larger sample, potential differences in the IJA scores between these groups were tested with the Mann– WhitneyUtest. The difference in IJA score across age was calcu-lated across the larger sample of participants who contributed behavioral data (n=429 at 12 mo,n=384 at 24 mo, andn=311 with data at both time points) with the Wilcoxon signed-rank test. The potential effect of age on IJA score within each age group was tested with Spearman’s correlation.
To investigate the relationship between the fcMRI data and the IJA metric for each age group, we first calculated the Spearman rank correlation for each ROI-ROI fcMRI pair against the IJA score across subjects (Fig. 2A). Second, methods for enrichment analyses were adapted from those used in large-scale genomic association studies (Rivals et al. 2007; Khatri et al. 2012;Backes et al. 2014). Each network pair was tested for enrichment of strong Spearman correlation values, defined as values remaining after being thresholded and binarized at an associated uncorrectedPvalue≤0.05 (Supplementary Fig. 2A). Two complementary tests were conducted: a 1-degree-of-freedomχ2test and a hypergeometric test (Supplementary Fig. 2B,C). The χ2 test compares the observed number of strong brain-behavior correlations within a functional network pair to that which would be expected if the overall number of strong correlations was uniformly distributed across all possible net-work pairs. The statistic is large when the number of strong correlations within a network pair is much less than (depletion) or much greater than (enrichment) expected. EmpiricalPvalues were calculated using randomization, as described below. The hypergeometric statistic, as in Fisher’s exact test, assesses the likelihood of observing a given number of strong correlations in a network pair, given 1) the total number of strong correlations observed overall and 2) the total number of possible hits for that network pair (i.e., the total number or ROI pairs within a given network pair). Both the χ2test and the hypergeometric tests had to pass the significance threshold for a given network pair’s enrichment to be considered significant. Finally, we used a McNemarχ2test to investigate differences in brain-behavior relationships between the ages of 12 mo and 24 mo. Within each network pair, the McNemar statistic uses the number of discordant tests (b =number of ROI pairs True at 12 mo but False at 24 mo,c=the number of ROI pairs False at 12 mo but True at 24 mo) between ages. The McNemarχ2statistic is (b−c)2/ (b+c), if (b+c)>25, and (|b−c|−1)2/(b+c) otherwise.
1 000 000 iterations, permutations—wherein complete fcMRI matrices were matched to a randomly swapped IJA score—were performed separately for the 12-mo-only group, for the 24-mo-only group, and for the set of data at both time points. The groups were then recombined for analysis. Within each iter-ation, asymptotic P values reflecting depletion were set to 1. This was done to explicitly focus the statistical test on the pro-bability of observing strong enrichment. Thus, the reported brain-wide permutation-based false-positive rate of thePvalues reflects the empirical probability of calculating the actual observed statistical value of enrichment at the 5% false-positive rate level for the permutations. The permutation-based false-positive-rate exhibited no correlation with the number of ROIs within a network pair (Supplementary Fig. 2F,G). As an extra troubleshooting step, we also tested the within-network-pair-only false-positive rate to ensure no asymptoticPvalues showed up in the randomizations more than 5% of the time. Within the significantly enriched network pairs, to test whether this set of strong correlations were significantly different from zero, a 2-tailedt-test was performed. All anatomical MRI, fMRI, and fcMRI preprocessing was carried out with the Washington University in-house 4dfp-tools processing package (Pruett et al. 2015). All analyses conducted and visualizations generated were executed in MATLAB (Mathworks).
Results
This study focused on data collected in 116 infants and 98 tod-dlers who contributed both behavioral and imaging data at 12 and/or 24 months, of whom 37 participants contributed data at both time points (Supplementary Table 1). The 12 -mo infants and 24-mo toddlers exhibited markedly different amounts of spontaneous IJA behavior; the distribution in IJA scores reflected the emergence of IJA over the second year of life with
the expected large age-related increase in IJA (Wilcoxon signed-rank test,z=−11.8,P<3.4×10⁻³²) (Fig.1B). Thus, the relation-ship to brain function was assessed within and across age.
We then measured intrinsic brain functional connectivity using resting-state fcMRI in 12 mo infants and 24 mo toddlers during unsedated natural sleep. Stringent data quality control procedures minimized the presence of signal contamination due to motion-induced artifacts and ensured at least 6.25 min of high-quality MRI data. The distribution of IJA values in the participants for whom we had fcMRI data was not significantly different from that of a larger sample population (Mann–WhitneyUtest, 12 mo: n=429,z=0.60,P=0.55; 24 mo:n=384,z=1.2,P=0.24). We computed zero-lag Pearson correlation coefficients between 230 ROIs (Supplementary Fig. 1A) located throughout the cerebrum and cerebellum and adapted from task data and cortical func-tional parcellation studies in healthy adults (Power et al. 2011) and meta-analyses of autism studies (Philip et al. 2012).
To facilitate analyses within each age group as well as across age, we generated a cross-age network model using fcMRI data sets fromn =48 participants contributing data at both the 12-and 24-mo time points (inclusive of the 37 longitudinal subjects with IJA data; Fig. 1C,D; Supplementary Fig. 1B). This model enabled direct cross-age comparisons of brain-behavior relation-ships. The naming of the functional subnetworks was adapted from a previous study in healthy adults (Power et al. 2011). We also performed the brain-behavior analyses using a published adult network structure (see below; Supplementary Fig. 1C).
We tested the relationship between IJA and brain fc across subjects by calculating the Spearman correlation between IJA scores and fcMRI data for each of the 26 335 ROI pairs (Fig.2A). Individual brain-behavior correlations were of a moderate magnitude; none passed Bonferroni correction for multiple comparisons. However, stronger brain-behavior correlations of matching sign generally clustered within functional network
Figure 2.The strongest brain-behavior relationships are concentrated in a small subset of functional network pairs. (A) Brain fc was correlated against IJA scores across subjects for each ROI pair separately for each age group. (B) Strong positive (red) and negative (blue) Spearman correlations cluster within some network pairs. (C) Quantifying the level of clustering with enrichment analyses (shown here are hypergeometric statistics,Pvalues determined through randomization) reveals sig-nificant grouping of brain-behavior associations constrained to a minority of network pairs (●). (D) Significant differences in brain-behavior associations between age groups (McNemarχ2) were observed in a partially overlapping set of network pairs (●). (E) Only 2 functional network pairs significantly enriched at either age (
pairs (e.g., the grouping of dark blue correlation values in the Vis-DAN block at 12 mo; Fig.2B). To quantify the level of clus-tering of stronger brain-behavior correlations within specific pairs of functional brain networks, we conducted the following enrichment analyses. First, strong connections were defined as ROI-pair brain-behavior correlations with uncorrected P ≤0.05 (Supplementary Fig. 2A). Next, 2 complementary metrics (a χ2 test and a hypergeometric test) were used to determine whether the number of strong brain-behavior correlations within each network pair was significantly greater than the number expected if the strong connections were uniformly distributed throughout the brain (Supplementary Fig. 2B,C). Empirical significance levels, using a brain-wide false-positive rejection (FPR) rate of 0.05, were determined using randomization (Supplementary Fig. 2D,E). There was no relationship between the number of ROI pairs within a network pair and the brain-wide FPR rate at 12 mo (n= 91,χ2, Pearsonr=−0.15,P<1.6×10⁻¹; hypergeometric,r=−0.19, P<7.5×10⁻²; Supplementary Fig. 2F) or at 24 mo (χ2, r=−0.05, P < 6.2 × 10⁻¹; hypergeometric, r = −0.03, P < 7.8 × 10⁻¹; Supplementary Fig. 2G).
Functional network pairs containing a significant clustering of strong brain-behavior correlations at 12 mo (Vis-pcDMN, hyper-geometric brain-wide FPRP<1.3×10⁻²; Vis-DAN,P<5.4×10⁻³; SMN2-aDMN,P<7.5×10⁻³; SMN2-SMN,P<1.9×10⁻²) did not overlap with those observed at 24 mo (aFPC-DAN,P<2.0×10⁻²; aFPC-aFPC, P< 3.6× 10⁻²; Sal-aDMN, P< 4.3× 10⁻²; Fig.2C). Additionally, only 3 (of 91 total) functional network pairs exhib-ited a significantly different set of brain-behavior relationships between 12 mo and 24 mo (Fig. 2D, Vis-DAN, McNemar brain-wide FPRP<6.5×10⁻³; Vis-pcDMN,P<2.2×10⁻²; tDMN-tDMN, P<5.0×10⁻²). Overall, the global set of brain-behavior relation-ships at the ROI-pair level were different between the 2 age groups (McNemarχ2=4.5,P<1.7×10⁻²), partially driven by there being nearly 8% more strong ROI-pair brain-behavior correlations at 24 mo. From the systems-level perspective, although a differ-ent and not-overlapping set of functional network pairs were implicated at 12 mo and 24 mo, only 2 of 91 network pairs were both significantly associated with IJA at a given age and signifi -cantly different in their set of brain-behavior relationships across age: Vis-DAN and Vis-pcDMN (Fig.2E, Supplementary Table 2).
In contrast, while the other network pairs implicated at 12 mo were not significantly enriched at 24 mo (based on theχ2 and hypergeometric tests), they did not yield different enough brain-behavior relationships to pass significance across age (McNemar brain-wide FPR; SMN2-aDMNP<1.1×10⁻¹, SMN2-SMN P < 2.1 × 10⁻¹). This reflects a more subtle difference wherein the contributions of the connections within the net-work pairs to IJA become more muted over the second year of life. Similarly, in those network pairs implicated at 24 mo but neither significantly enriched at 12 mo nor different across age (i.e., aFPC-DANP <1.5 ×10⁻¹, aFPC-aFPCP <2.0 ×10⁻¹, Sal-aDMN, P < 7.0 × 10⁻²), the relationships of the connections within the network pairs to IJA become strengthened over the second year of life. These discovery results (significant at one age, but not statistically different from a nonsignificant result at the other age) provide potential targets for future hypothesis-driven longitudinal studies.
In 4 of the 7 significantly enriched infant–toddler functional network pairs, general consistency was present in the signs of the brain-behavior correlations (all at 12 mo, Figs 3 and 4), whether or not the correlations were significantly positive (Vis-pcDMN [t-test of sign vs. zero,t=9.2, P<3.5×10⁻¹¹], SMN2-aDMN [t=9.2,P<1.4×10⁻¹¹]) or negative (Vis-DAN [t=−19.9, P<6.8×10⁻³²] and SMN2-SMN [t=−9.7,P<1.1×10⁻¹¹]) (Fig.4).
To explain: negative brain-behavior correlation involving 12 mo Vis-DAN ROIs means that as the brain fc decreased, the fre-quency of IJA increased. In contrast, positive brain-behavior correlation between Vis-pcDMN means that as the brain fc increased, the frequency of IJA also increased. Additionally, within these networks, the sign of the fcMRI correlation values themselves was also generally conserved across ROI pairs (Fig. 4). For example, at 12 mo, strong positive brain-behavior correlations were apparent in connections of ROIs between the Vis-pcDMN (Fig.3), and the fc between those ROIs was also gen-erally positive (orange and yellow lines in Fig.4). This means that as the fc values increased from zero to strong and positive, presumably reflecting a significant history of in-phase (coher-ent) co-activation (Lewis et al. 2009), the frequency of IJA increased. This finding stood in contrast to connections between the SMN2-aDMN where most ROI pairs displayed a positive brain-behavior correlation over a negative range of fc values (green lines in Fig.4). In this case, a history of strong antiphase co-activation (i.e., strong magnitude fc but negative in sign) correlated with fewer acts of IJA.
These patterns were also detectable when using a brain func-tional network structure derived from a previously published independent fcMRI data set of typical adults (Power et al. 2011) (Supplementary Figs 1C and 3). The adult-functional network pairs displayed a qualitatively more heterogeneous set of brain-behavior relationships than those obtained using the infant– tod-dler networks (presumably, because our infant–toddler-derived networks better reflect the developing brain’s functional archi-tecture for these infant–toddler brain-behavior correlation ana-lyses). Additionally, 4 of the 7 adult-functional network pairs contain significantly different brain-behavior relationships across age, including one enriched at 24 mo (VAN-DMN).
Discussion
Here, we show that IJA is intimately and differentially related to the systems-level organization of the 12-mo and 24-mo developing brain. In particular, we found that though func-tional connections spanning the brain are involved in IJA, the strongest brain-behavior associations are clustered within con-nections between a small subset of functional brain networks. We found different sets of implicated networks at each age, with the strongest associations between visual and dorsal attention networks and between the visual network and par-ietal aspects of the default mode network at 12 months.
fcMRI at time points within the period of emergence of IJA. Because of near complete absence of extant data about brain-behavior associations during this epoch of development, we chose to use data-driven methods with the power to identify unanticipated relationships between IJA and functional connect-ivity. The current results reveal that specific network pairs exhi-biting the strongest associations with IJA within age as well as the strongest differences across age include the Vis-DAN and the Vis-pcDMN in the 12-mo age group. At 24 mo, though 8% more ROI pairs have strong correlations between fc and IJA, these strong correlations are more distributed throughout the brain, reflecting a different balance of brain function underlying the complex behavior of IJA. The presentfindings of strong brain-behavior relationships at either 12 mo or 24 mo (but not signifi -cantly different across age) are discovery results to be used as features for model generation for future studies.
These observed differences in functional network associa-tions with increasing frequency of IJA across 12–24 months may reflect changes in fc driven by social experience-dependent learning that occurs over the second year of life (Tomasello et al. 2005;Canals et al. 2009;Lewis et al. 2009;Fransson et al. 2011) and the unfolding, later transition from nonverbal to verbal com-munication (Morales et al. 2000;Mundy et al. 2007;Kuhl 2010; Igualada et al. 2015). Additionally, these observed varying brain-behavior relationships may relate to the toddlers’ increasing
capacity to use multiple strategies to initiate joint attention. Infants around 12 mo tend to use eye gaze shifts, pointing ges-tures, or a simple vocalization. However, by 24 mo as IJA becomes a more salient aspect of behavior, toddlers integrate these communicative domains into an actionable unit, combin-ing eye gaze shifts, pointcombin-ing gestures, and vocalizations into a single multifaceted gesture. This shift in behavioral strategies may reflect maturation of connections between default mode network regions, known to be involved in hetero-modal integra-tion as well as processing of socially relevant stimuli and inter-actions, with primary visual and sensory-motor regions along with higher association areas distributed throughout the pre-frontal and parietal cortex (Buckner et al. 2008;Fransson et al. 2011).
The ROIs used in the current study are well defined and have been used in the literature in typical and autism-related studies (Pruett et al. 2015), and offer a foundation for the cur-rent analysis. One limitation is that the ROIs derive from work in older subjects. In the future, the analyses described in this paper may be extended to alternate ROIs such as infant and toddler functional areal parcellations. There are significant challenges, however, to generating these, and this idea consti-tutes an exciting future direction.
Another limitation of the current study is that the fcMRI data were acquired while the participants were naturally sleeping
and sleep stage was not monitored with EEG polysomnography. Potential differences in sleep stage may exist both within and between the age groups, complicating interpretation of the fcMRI data. Acquiring fMRI data during natural sleep provides potential insight into a population that generally is challenging to study (Dehaene-Lambertz et al. 2002; Redcay et al. 2007; Graham et al. 2015; Pruett et al. 2015). Future studies using combined fcMRI-EEG present exciting opportunities to better interpret brain function in sleeping infants and toddlers. Alternatively, given that IJA is a fundamentally interactive com-munication behavior, advances in wearable and minimally invasive neuroimaging technology (Hassanpour et al. 2015; Lloyd-Fox et al. 2015;Begus et al. 2016;Ferradal et al. 2016) may facilitate further advancements in study designs that use awake and directly interacting participants (Redcay et al. 2013a; Oberwelland et al. 2016). An additional limitation of the study is the potential for differences in brain-behavior relationships between high- and low-risk groups both within and across age, including the possibility that the network architecture under-lying IJA may differ in children who develop ASD. However, our
study was not designed or powered to address these questions. The underlying psychological and behavioral features of ASD are continuously distributed in the population (e.g.,Constantino and Todd 2000; Constantino 2011; Constantino and Charman 2016). Infants with an older sibling with an ASD diagnosis (HR) are >10×more likely to be diagnosed with the disorder than infants without an older sibling or immediate relative with a positive ASD diagnosis (LR). In addition, those HR infants who do not develop autism will eventually show rates of>30% with other traits subthreshold (for autism) psychopathology. As such, this sample provided the range of behavior required to adequately test the brain-IJA relationships that we report. Though the sam-ple is too small to test for differences within age between risk or diagnostic groups (Supplementary Table 1), this work sets the stage for future studies comparing brain-behavior relationships in larger age-specific, risk and outcome subgroups.
In summary, these observations offer afirst glimpse into the functional brain structure underlying the emergence and con-solidation of IJA across the second year of life. These results may inform clinical therapies by providing further physiological
foundation for JA-based behavior interventions that have been shown to significantly improve outcome in children with ASD (Kasari et al. 2012;Chahrour et al. 2016). Important future direc-tions include the examination of reladirec-tionships between brain-IJA correlations and those for specific behavioral and cognitive domains of function suspected (or known) to be intimately related to IJA at different points in development (Conboy et al. 2015;Igualada et al. 2015). Our methods would enable explora-tions of potential overlap and nonoverlap of brain-behavior rela-tionships for IJA and RJA (aspects of which are evolutionarily conserved [Adolphs 2003]), language (Premack 2004), and Theory of Mind (Adolphs 2003;Penn and Povinelli 2007;Krupenye et al. 2016). Related experiments could characterize the brain-behavior relationships for what may be“building blocks”of IJA-specific motor processes (pointing, head turning, gaze shifting), visuo-motor integration (pointing at what you are looking at), and aspects of visual attention (selecting the target object in the visual field). Additionally, studies utilizing dense longitudinal designs could employ these methods, using brain data taken as early as 6 months, to elucidate within-subject trajectories for normal socio-cognitive maturation that may help differentiate typical from atypical development.
Supplementary Material
Supplementary material can be found atCerebral CortexJournal.
Funding
This work was supported by the National Institutes of Health (grant numbers K01-MH103594 to A.T.E., R01-MH093510 to J.R.P., R01-HD055741 to J.P., K01-MH101653 to J.J.W., P30-NS048056 to A.Z.S., and U54-HD087011 to J.N.C. and B.L.S.), the McDonnell Center for Systems Neuroscience, Autism Speaks (grant number #6020 to J.P.), and the Simons Foundation (grant number #140209 to J.P.).
Author Contributions
Conceptualization: J.R.P., J.T.E., J.J.W., and J.P.; Data Curation: J.T. E., J.J.W., A.M.E., L.Z., J.N.C., C.M.A., A.Z.S, S.K., K.N.B., M.A.S., G.G., R.C.M., S.D., P.K., and J.D.L.; Formal Analysis: A.T.E. and A.T.; Investigation: A.T.E., J.T.E., A.T., J.R.P., E.F., and S.K.; Methodology: A.T.E, S.E.P., E.F., A.T., J.R.P., B.L.S., and S.K.; Project Administra-tion: J.R.P., J.T.E., J.P., K.N.B., R.C.M., J.N.C., L.Z., A.C.E., H.C.H., S.J. P., R.T.S., S.D., A.M.E., and M.A.S.; Resources: K.N.B., A.C.E., H.C.H., S.D., S.J.P., R.T.S., J.P., and J.R.P.; Software: A.T.E., A.T., J.R.P.; Supervision: K.N.B., A.C.E., H.C.H., S.D., S.J.P., R.T.S., J.P., and J.R.P.; Visualization: A.T.E.; Writing—Original Draft: A.T.E., J.T.E., J.R.P.; Writing—Review and Editing: A.T.E., J.T.E., E.F., A.T., J.J.W., C.M.A., J.D.L., A.M.E., L.Z., K.N.B., R.C.M., J.N.C., H.C.H., S.D., S.J.P., R.T.S., M.A.S., G.G., P.K., B.L.S., S.E.P., J.P., and J.R.P.; Funding Acquisition: J.P., J.R.P., A.T.E., and J.J.W.
Notes
We wish to thank the families and children for their time and participation. We thank Sarah Hoertel for key early analyses and for guiding the brain-behavior analysis strategy. We also thank Leigh MacIntyre for managing the full IBIS database. We thank Lisa Flake and Meghan Campbell for helpful discussion about interpreting the behavior assessments. We also thank Dr Natasha Marrus, Dr Patrick Wright, Claire McKinnon, and Dr Muriah Wheelock for helpful comments on the manuscript. Conflict of Interest:The authors declare the following conflicts of
interests: R.C.M. receives acting, modeling, and speaking fees from Siemens Healthcare and A.C.E. is a founder and a member of the Board of Directors of Biospective Inc. All other authors declare no competingfinancial interests.
References
Adolphs R. 2003. Cognitive neuroscience of human social behaviour. Nat Rev Neurosci. 4:165–178.
American Psychiatric Association. 2000. Diagnostic and Statistical Manual of Mental Disorders. 4th ed., Text Revision. Washington, DC: American Psychiatric Association. Backes C, Ruhle F, Stoll M, Haas J, Frese K, Franke A, Lieb W, Wichmann HE, Weis T, Kloos W, et al. 2014. Systematic per-mutation testing in GWAS pathway analyses: identification of genetic networks in dilated cardiomyopathy and ulcera-tive colitis. BMC Genomics. 15:622.
Barak B, Feng G. 2016. Neurobiology of social behavior abnor-malities in autism and Williams syndrome. Nat Neurosci. 19:647–655.
Begus K, Lloyd-Fox S, Halliday D, Papademetriou M, Darboe MK, Prentice AM, Moore SE, Elwell CE. 2016. Using fNIRS to study working memory of infants in rural Africa. Adv Exp Med Biol. 876:273–279.
Bruinsma Y, Koegel RL, Koegel LK. 2004. Joint attention and children with autism: a review of the literature. Ment Retard Dev Disabil Res Rev. 10:169–175.
Buckner RL, Andrews-Hanna JR, Schacter DL. 2008. The brain’s default network: anatomy, function, and relevance to dis-ease. Ann NY Acad Sci. 1124:1–38.
Canals S, Beyerlein M, Merkle H, Logothetis NK. 2009. Functional MRI evidence for LTP-induced neural network reorganization. Curr Biol. 19:398–403.
Caplan R, Chugani HT, Messa C, Guthrie D, Sigman M, de Traversay J, Mundy P. 1993. Hemispherectomy for intract-able seizures: presurgical cerebral glucose metabolism and post-surgical non-verbal communication. Dev Med Child Neurol. 35:582–592.
Carpenter M, Nagell K, Tomasello M. 1998. Social cognition, joint attention, and communicative competence from 9 to 15 months of age. Monogr Soc Res Child Dev. 63:i–vi., 1–143.
Caruana N, Brock J, Woolgar A. 2015. A frontotemporoparietal network common to initiating and responding to joint attention bids. Neuroimage. 108:34–46.
Chahrour M, O’Roak BJ, Santini E, Samaco RC, Kleiman RJ, Manzini MC. 2016. Current perspectives in autism spectrum disorder: from genes to therapy. J Neurosci. 36:11402–11410. Cohen AL, Fair DA, Dosenbach NU, Miezin FM, Dierker D, Van
Essen DC, Schlaggar BL, Petersen SE. 2008. Defining tional areas in individual human brains using resting func-tional connectivity MRI. Neuroimage. 41:45–57.
Conboy BT, Brooks R, Meltzoff AN, Kuhl PK. 2015. Social inter-action in infants’learning of second-language phonetics: an exploration of brain-behavior relations. Dev Neuropsychol. 40:216–229.
Constantino JN. 2011. The quantitative nature of autistic social impairment. Pediatr Res. 69:55R–62R.
Constantino JN, Charman T. 2016. Diagnosis of autism spec-trum disorder: reconciling the syndrome, its diverse origins, and variation in expression. Lancet Neurol. 15:279–291. Constantino JN, Todd RD. 2000. Genetic structure of reciprocal
Dehaene-Lambertz G, Dehaene S, Hertz-Pannier L. 2002. Functional neuroimaging of speech perception in infants. Science. 298:2013–2015.
Elison JT, Wolff JJ, Heimer DC, Paterson SJ, Gu HB, Hazlett HC, Styner M, Gerig G, Piven J, IBIS_Network. 2013. Frontolimbic neural circuitry at 6 months predicts individual differences in joint attention at 9 months. Dev Sci. 16:186–197.
Emery NJ. 2000. The eyes have it: the neuroethology, function and evolution of social gaze. Neurosci Biobehav Rev. 24: 581–604.
Ferradal SL, Liao SM, Eggebrecht AT, Shimony JS, Inder TE, Culver JP, Smyser CD. 2016. Functional imaging of the devel-oping brain at the bedside using diffuse optical tomography. Cereb Cortex. 26:1558–1568.
Fonov V, Evans AC, Botteron K, Almli CR, McKinstry RC, Collins DL. 2011. Unbiased average age-appropriate atlases for pedi-atric studies. Neuroimage. 54:313–327.
Fransson P, Aden U, Blennow M, Lagercrantz H. 2011. The func-tional architecture of the infant brain as revealed by resting-state fMRI. Cereb Cortex. 21:145–154.
Friston KJ, Williams S, Howard R, Frackowiak RS, Turner R. 1996. Movement-related effects in fMRI time-series. Magn Reson Med. 35:346–355.
Gao W, Zhu H, Giovanello KS, Smith JK, Shen D, Gilmore JH, Lin W. 2009. Evidence on the emergence of the brain’s default network from 2-week-old to 2-year-old healthy pediatric subjects. Proc Natl Acad Sci USA. 106:6790–6795.
Gotham K, Risi S, Pickles A, Lord C. 2007. The Autism Diagnostic Observation Schedule: revised algorithms for improved diag-nostic validity. J Autism Dev Disord. 37:613–627.
Graham AM, Pfeifer JH, Fisher PA, Lin W, Gao W, Fair DA. 2015. The potential of infant fMRI research and the study of early life stress as a promising exemplar. Dev Cogn Neurosci. 12: 12–39.
Hassanpour MS, Eggebrecht AT, Culver JP, Peelle JE. 2015. Mapping cortical responses to speech using high-density diffuse optical tomography. Neuroimage. 117:319–326. Hazlett HC, Gu H, McKinstry RC, Shaw DW, Botteron KN, Dager
SR, Styner M, Vachet C, Gerig G, Paterson SJ, et al. 2012. Brain volumefindings in 6-month-old infants at high famil-ial risk for autism. Am J Psychiatry. 169:601–608.
Henderson LM, Yoder PJ, Yale ME, McDuffie A. 2002. Getting the point: electrophysiological correlates of protodeclarative pointing. Int J Dev Neurosci. 20:449–458.
Igualada A, Bosch L, Prieto P. 2015. Language development at 18 months is related to multimodal communicative strategies at 12 months. Infant Behav Dev. 39:42–52.
Kasari C, Gulsrud A, Freeman S, Paparella T, Hellemann G. 2012. Longitudinal follow-up of children with autism receiv-ing targeted interventions on joint attention and play. J Am Acad Child Adolesc Psychiatry. 51:487–495.
Khatri P, Sirota M, Butte AJ. 2012. Ten years of pathway ana-lysis: current approaches and outstanding challenges. PLoS Comput Biol. 8:e1002375.
Krupenye C, Kano F, Hirata S, Call J, Tomasello M. 2016. Great apes anticipate that other individuals will act according to false beliefs. Science. 354:110–114.
Kuhl PK. 2010. Brain mechanisms in early language acquisition. Neuron. 67:713–727.
Lewis CM, Baldassarre A, Committeri G, Romani GL, Corbetta M. 2009. Learning sculpts the spontaneous activity of the rest-ing human brain. Proc Natl Acad Sci USA. 106:17558–17563. Lin W, Zhu Q, Gao W, Chen Y, Toh CH, Styner M, Gerig G, Smith
JK, Biswal B, Gilmore JH. 2008. Functional connectivity MR
imaging reveals cortical functional connectivity in the developing brain. AJNR Am J Neuroradiol. 29:1883–1889. Lloyd-Fox S, Szeplaki-Kollod B, Yin J, Csibra G. 2015. Are you
talking to me? Neural activations in 6-month-old infants in response to being addressed during natural interactions. Cortex. 70:35–48.
Mathias A, Grond F, Guardans R, Seese D, Canela M, Diebner HH. 2004. Algorithms for spectral analysis of irregularly sampled time series. J Stat Softw. 11:1–27.
Morales M, Mundy P, Delgado CEF, Yale M, Messinger D, Neal R, Schwartz HK. 2000. Responding to joint attention across the 6- through 24-month age period and early language acquisi-tion. J Appl Dev Psychol. 21:283–298.
Mundy P, Block J, Delgado C, Pomares Y, Van Hecke AV, Parlade MV. 2007. Individual differences and the development of joint attention in infancy. Child Dev. 78:938–954.
Mundy P, Card J, Fox N. 2000. EEG correlates of the development of infant joint attention skills. Dev Psychobiol. 36:325–338. Mundy P, Jarrold W. 2010. Infant joint attention, neural
net-works and social cognition. Neural Netw. 23:985–997. Oberwelland E, Schilbach L, Barisic I, Krall SC, Vogeley K, Fink
GR, Herpertz-Dahlmann B, Konrad K, Schulte-Ruther M. 2016. Look into my eyes: Investigating joint attention using interactive eye-tracking and fMRI in a developmental sam-ple. Neuroimage. 130:248–260.
Ojemann JG, Akbudak E, Snyder AZ, McKinstry RC, Raichle ME, Conturo TE. 1997. Anatomic localization and quantitative analysis of gradient refocused echo-planar fMRI susceptibil-ity artifacts. Neuroimage. 6:156–167.
Okamoto-Barth S, Moore C, Barth J, Subiaul F, Povinelli DJ. 2011. Carryover effect of joint attention to repeated events in chimpanzees and young children. Dev Sci. 14:440–452. Parikshak NN, Gandal MJ, Geschwind DH. 2015. Systems biology
and gene networks in neurodevelopmental and neurode-generative disorders. Nat Rev Genet. 16:441–458.
Penn DC, Povinelli DJ. 2007. On the lack of evidence that non-human animals possess anything remotely resembling a‘ the-ory of mind’. Philos Trans R Soc Lond B Biol Sci. 362:731–744. Petersen SE, Posner MI. 2012. The attention system of the
human brain: 20 years after. Annu Rev Neurosci. 35:73–89. Pfeiffer UJ, Schilbach L, Timmermans B, Kuzmanovic B,
Georgescu AL, Bente G, Vogeley K. 2014. Why we interact: on the functional role of the striatum in the subjective experi-ence of social interaction. Neuroimage. 101:124–137. Philip RC, Dauvermann MR, Whalley HC, Baynham K, Lawrie
SM, Stanfield AC. 2012. A systematic review and meta-analysis of the fMRI investigation of autism spectrum disor-ders. Neurosci Biobehav Rev. 36:901–942.
Power JD, Barnes KA, Snyder AZ, Schlaggar BL, Petersen SE. 2012. Spurious but systematic correlations in functional connectivity MRI networks arise from subject motion. Neuroimage. 59:2142–2154.
Power JD, Cohen AL, Nelson SM, Wig GS, Barnes KA, Church JA, Vogel AC, Laumann TO, Miezin FM, Schlaggar BL, et al. 2011. Functional network organization of the human brain. Neuron. 72:665–678.
Power JD, Mitra A, Laumann TO, Snyder AZ, Schlaggar BL, Petersen SE. 2014. Methods to detect, characterize, and remove motion artifact in resting state fMRI. Neuroimage. 84:320–341.
Premack D. 2004. Psychology. Is language the key to human intelligence? Science. 303:318–320.
Accurate age classification of 6 and 12 month-old infants based on resting-state functional connectivity magnetic res-onance imaging data. Dev Cogn Neurosci. 12:123–133. Redcay E, Dodell-Feder D, Mavros PL, Kleiner M, Pearrow MJ,
Triantafyllou C, Gabrieli JD, Saxe R. 2013a. Atypical brain activation patterns during a face-to-face joint attention game in adults with autism spectrum disorder. Hum Brain Mapp. 34:2511–2523.
Redcay E, Kennedy DP, Courchesne E. 2007. fMRI during natural sleep as a method to study brain function during early childhood. Neuroimage. 38:696–707.
Redcay E, Kleiner M, Saxe R. 2012. Look at this: the neural corre-lates of initiating and responding to bids for joint attention. Front Hum Neurosci. 6:169.
Redcay E, Moran JM, Mavros PL, Tager-Flusberg H, Gabrieli JD, Whitfield-Gabrieli S. 2013b. Intrinsic functional network organization in high-functioning adolescents with autism spectrum disorder. Front Hum Neurosci. 7:573.
Richiardi J, Altmann A, Milazzo AC, Chang C, Chakravarty MM, Banaschewski T, Barker GJ, Bokde AL, Bromberg U, Buchel C, et al. 2015. BRAIN NETWORKS. Correlated gene expression supports synchronous activity in brain networks. Science. 348:1241–1244.
Rivals I, Personnaz L, Taing L, Potier MC. 2007. Enrichment or depletion of a GO category within a class of genes: which test? Bioinformatics. 23:401–407.
Rosvall M, Bergstrom CT. 2008. Maps of random walks on com-plex networks reveal community structure. Proc Natl Acad Sci USA. 105:1118–1123.http://www.ncbi.nlm.nih.gov.becker proxy.wustl.edu/pubmed/18216267.
Satterthwaite TD, Wolf DH, Ruparel K, Erus G, Elliott MA, Eickhoff SB, Gennatas ED, Jackson C, Prabhakaran K, Smith A, et al. 2013. Heterogeneous impact of motion on funda-mental patterns of developfunda-mental changes in functional connectivity during youth. Neuroimage. 83:45–57.
Scaife M, Bruner JS. 1975. The capacity for joint visual attention in the infant. Nature. 253:265–266.
Schilbach L, Wilms M, Eickhoff SB, Romanzetti S, Tepest R, Bente G, Shah NJ, Fink GR, Vogeley K. 2010. Minds made for sharing: initiating joint attention recruits reward-related neurocircuitry. J Cogn Neurosci. 22:2702–2715.
Smyser CD, Inder TE, Shimony JS, Hill JE, Degnan AJ, Snyder AZ, Neil JJ. 2010. Longitudinal analysis of neural network development in preterm infants. Cereb Cortex. 20: 2852–2862.
Smyser CD, Snyder AZ, Neil JJ. 2011. Functional connectivity MRI in infants: exploration of the functional organization of the developing brain. Neuroimage. 56:1437–1452.
Tomasello M, Carpenter M. 2007. Shared intentionality. Dev Sci. 10:121–125.
Tomasello M, Carpenter M, Call J, Behne T, Moll H. 2005. Understanding and sharing intentions: the origins of cul-tural cognition. Behav Brain Sci. 28:675–691. discussion 691-735.
Toulmin H, Beckmann CF, O’Muircheartaigh J, Ball G, Nongena P, Makropoulos A, Ederies A, Counsell SJ, Kennea N, Arichi T, et al. 2015. Specialization and integration of functional thala-mocortical connectivity in the human infant. Proc Natl Acad Sci USA. 112:6485–6490.
Tsodyks M, Kenet T, Grinvald A, Arieli A. 1999. Linking spontan-eous activity of single cortical neurons and the underlying functional architecture. Science. 286:1943–1946.
Van Dijk KR, Sabuncu MR, Buckner RL. 2012. The influence of head motion on intrinsic functional connectivity MRI. Neuroimage. 59:431–438.
Wetherby AM, Allen L, Cleary J, Kublin K, Goldstein H. 2002. Validity and reliability of the communication and symbolic behavior scales developmental profile with very young chil-dren. J Speech Lang Hear Res. 45:1202–1218.