Sharif University of Technology
Scientia IranicaTransactions B: Mechanical Engineering http://scientiairanica.sharif.edu
Numerical evaluation of the operating room ventilation
performance: Ultra-Clean Ventilation (UCV) systems
B. Sajadi
a,*, M.H. Saidi
b, and G. Ahmadi
ca. School of Mechanical Engineering, College of Engineering, University of Tehran, Tehran, Iran. b. School of Mechanical Engineering, Sharif University of Technology, Tehran, Iran.
c. Department of Mechanical and Aeronautical Engineering, Clarkson University, Potsdam, NY. Received 23 October 2017; received in revised form 24 March 2018; accepted 27 October 2018
KEYWORDS Operating Room (OR);
Ultra-Clean Ventilation (UCV) system;
Computational Fluid Dynamics (CFD); Surgical Site Infection (SSI);
Surgical light.
Abstract.Surgical Site Infection (SSI) is one of the most important infectious problems in hospitals, which may happen in 2.6% of all surgeries. According to the literature, the primary source of SSI is the akes released from the exposed skin of surgical sta or patients. It is well known that appropriate ventilation strategy is the most eective way to control bacteria-carrying airborne particles responsible for SSI. In this research, the eect of the most dominant design parameter, namely inlet air velocity, on the performance of Ultra-Clean Ventilation (UCV) systems is evaluated in detail using the Computational Fluid Dynamics (CFD). The results showed an optimum value for the inlet air velocity, which was mainly due to formation of a thermal plume over the wound tissue. This thermal plume protected the wound from contaminants deposition like a shield and might be disturbed at too high inlet air velocity. In addition, the eect of critical factors including particle size, wound temperature, operating lights boundary condition, and existence of xed and removable partitions on the optimum inlet air velocity was investigated and is extensively discussed in this article.
© 2019 Sharif University of Technology. All rights reserved.
1. Introduction
Surgical Site Infection (SSI) is one of the most im-portant and potentially protectable causes of remedy duration increment and even death of the patients. According to the reports of the Center for Disease Control (CDC), SSI is the third most usual (14-16%) nosocomial infection [1] and 2.6% of all surgeries lead to SSI [2]. It is obvious that the risk of SSI is greatly more during deep surgeries such as joint replacement. The additional cost of SSI approximated $2000 per case *. Corresponding author. Tel.: +98 21 6111 9944
E-mail addresses: [email protected] (B. Sajadi);
[email protected] (M.H. Saidi); [email protected] (G. Ahmadi)
doi: 10.24200/sci.2018.5431.1269
in 1980 [3], which rose to $5000 in 1999 [2]. In addition to such a rapid growth rate, the digits show that SSI imposes direct cost of approximately $3:5 billion per year on the US healthcare industry [4].
It is well known that the most common pathogen causing SSI is Staphylococcus aureus, which is re-sponsible for 48% of all cases [2]. Staphylococcus aureus is a spherical bacterium naturally found in the normal human skin, of which the resultant infections have become more challenging in the recent decades with the recognition of several antibiotic-persistent strands of bacteria [4]. According to the literature, the primary source of Staphylococcus aureus is the akes or squames, which are released from the exposed skin of surgical sta or patients [5]. These particles are 25 m in diameter and 3-5 m in thickness. It is estimated that during two to four hours of surgery, 1.15 to 90 million akes are released [6], among which typically
(MIS) methods, SSI still occurs. Woods et al. [5] categorized the sources of wound infection into (1) patient, (2) non-sterilized instruments, and (3) air-borne bacteria. It is believed that the major number of SSI cases are due to airborne bacterial particles, which may be minimized using an optimum ventilation strategy. Application of an appropriate ventilation system is well known as the most eective way to control harmful microbiological agents responsible for SSI. The reason for this idea is that plausible evidences have shown considerable reduction in the number of postoperative SSIs after the application of cleanroom technology to operating rooms in 60s [11]. Field studies of Lidwell et al. [12], Charnley [13], and Ferrazzi et al. [14] on joint replacement, hip replacement, and cardiac surgeries, respectively, showed approximately 50% improvement in the wound infection control using a proper ventilation airow pattern.
Classication of the operating room ventilation systems is almost the same as the cleanroom ones [15]: (1) conventional and (2) unidirectional or laminar. Laminar systems, which are also known as Ultra-Clean
congurations such as horizontal [19], diagonal [20], trumpet-shaped [4], exponential [21], and local [22] have also been presented during the years, which may be preferable to the vertical pattern in specic situations [23].
Since the early 90s, with considerable improve-ment in the computational capacity of computers, Computational Fluid Dynamics (CFD) techniques have become powerful tools for engineering design, including investigation into the Indoor Air Quality (IAQ) [24]. Generally, ow characteristics in an operating room de-pend on the supply inlets/return outlets conguration, the ventilation airow rate, and the eect of obstacles such as surgical luminaries. It is generally agreed that the location of return outlets is not as important as that of the supply inlets [25-27]. Memarzadeh and Manning [9] suggested that using mixed high-low level outlets might lead to a better airow distribution; however, the dierences were not signicant enough to make low-or high-level systems unreliable. Although supply inlets arrangement has a considerable eect on the airow pattern and the Indoor Air Quality (IAQ) in
conventionally ventilated cleanrooms [26,27], it seems that there is no concern for this issue in a UCV system, provided that the unidirectional zone covers all the operating site and the surgical team. As one of the pioneers in this area, Chen et al. [25] investigated the contaminant concentration and the draught risk in an operating room through Eulerian-Eulerian numerical approach. They concluded that increasing the venti-lation airow rate would lead to a better air quality. Later, this conclusion was also reported by some other researchers [28]. It is noteworthy that this result is contrary to some experimental evidences proving that sometimes the ventilation airow increment has no [29] or even negative eect [30] on the wound infection rate. It is believed that this inconsistency is mainly due to using Eulerian point of view in describing the trans-mission of bacterial particles. As mentioned previously, bacteria-carrying skin akes are approximately 10 m in diameter. In this size, particles are not in hydro-dynamic equilibrium with the airow [31] and thus, Eulerian approach cannot reect all the aspects of the behavior of particles. Memarzadeh and Manning [32] in National Institute of Health (NIH) conducted extensive numerical studies to investigate the eect of operating room ventilation system on reducing the risk of surgery. Using a Eulerian-Lagrangian code, they concluded that the indoor air pattern was more important than the airow ventilation rate to prevent the wound from infection. They found that for laminar airow systems, there was an optimum value for the inlet air velocity, namely 0.15 m/s, over which the particles deposition on the wound increased due to break of the protecting wound thermal plume [9]. Based on this result, which has also been stated by Rui et al. [33] and supported by the previous eld studies [29,30], although the ventilation airow increment leads to less contaminant concentration in the operating room, it does not necessarily decrease wound infection. Despite the fact that the results of Memarzadeh and Manning [9] are the basis for ASHRAE recommendations [34], it seems that the optimum inlet air velocity is not thoroughly unique. They proposed the optimum velocity near 0.15 m/s, but other researchers have reported somehow dierent values [15,33,35], which may be due to some discrepancies in other design parameters.
In addition to the ow pattern and the inlet air velocity, the previous research studies have shown that openings [36] and the conguration of internal obstacles may aect the indoor airow in operating rooms. The main obstacles around a patient are surgical sta and operating luminaries, which may inuence the infection risk. During the recent years, some studies have been performed, mainly by Sadrizadeh et al., to investigate the eect of the number of sta members [37], their clothing [38], their position [39], and their move-ment [40] on the airow pattern and the dispersion
of airborne particles in surgical theaters. Recently, Zoon [41] compared the eect of three operating lamp types on the ow eld in a typical surgical room using the laminar ow index, numerically. However, they did not provide any clear recommendation regarding the eect of the light location, which may be as important as its type.
In this research, the airow pattern in an oper-ating room equipped with a UCV system is studied in detail and the eect of important factors, e.g., the operating lights boundary conditions, on the optimum inlet air velocity is evaluated. This investigation and its results are useful in getting a better understanding of the airow pattern over the operating rooms and in developing more eective ventilation strategies. 2. Numerical modeling
2.1. Geometry
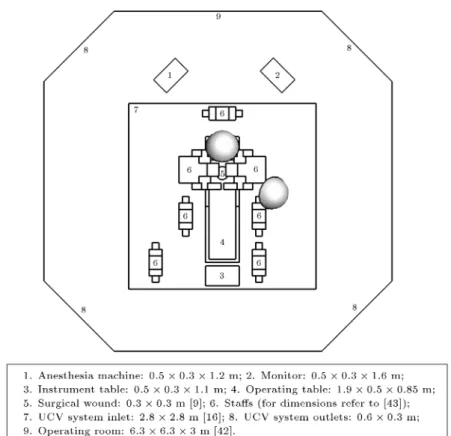
Figure 2 shows a schematic of the operating room model. It has an area of 37 m2, which is common
around the world, including Iran [42]. Since the main geometric features of operating rooms are almost the same, far more or less, arrangement of the operating sta, the equipment, and the patient is done in ac-cordance with DIN 4799 [43]. Due to the complex geometry of the model, a tetrahedral unstructured mesh is used to discretize the computational domain. The primary study shows that 1:8 106 cells are
sucient to guarantee the independency of the results from the number of grids and the mesh should be denser in the ultra-clean area, where the gradients are predicted to be higher.
2.2. Governing equations
For an incompressible ow, Reynolds-averaged govern-ing equations are [44]:
Mass equation:
ui;j= 0: (1)
Momentum equation:
ujui;j= P;i+(ui;j u0iu0j);j+g(T T1): (2)
Energy equation:
cpujT;j = (kT;j cpT0u0j);j; (3)
where the buoyancy force is estimated using Boussinesq model and the viscous dissipation term is neglected in the energy equation. Reynolds stresses, u0
iu0j, and
Reynolds heat uxes, cpT0u0j, rise from turbulent
uctuations and should be estimated through an ap-propriate turbulence model. Among many turbulence models, which have been presented through the years,
Figure 2. Geometric specications of the operating room model. For standard distance refer to [43].
Boussinesq hypothesis-based k-" family models are very popular for industrial applications due to their simplicity, stability, and acceptable results [44]. In the middle of the 90s, Chen [45] compared 5 most common k-" models and recommended RNG k-" one for simu-lating the indoor airows, although the standard model also gave acceptable results. During the past decades, most of the researchers have used the standard [9,46] or RNG k-" [46,47] model and few studies, which were conducted using other models [48-50], did not report a signicant preference. In the present study, the momentum equations are closed using RNG k-" turbulence model and, as the model fails in the near-wall region, the standard near-wall function is implemented to resolve the problem [44]. The governing equations are solved on a collocated grid using ANSYS FLUENT 12.1 [51] as a solver. Pressure-velocity coupling is established through SIMPLE [52] algorithm and the convection terms are discretized using second-order upwind scheme, which has an acceptable accuracy in the indoor airow modeling [53].
It is almost well known that the Eulerian-Eulerian approach is not suitable to study the motion of bac-terial airborne particles due to their relatively large size [9]. Using Lagrangian approach, the particle motion equation becomes [54]:
dupi
dt =
1
(ui upi) + gi+ ni(t); (4)
where gi and ni are the gravity and Brownian forces,
respectively, and , the particle relaxation time, is dened as:
= Sd182pCc; (5)
where S is the particle to uid density ratio and Cunningham slip correction factor, Cc, is implemented
to compensate for the non-continuum eects: Cc= 1 + Kn
1:257 + 0:4 exp
1:1 Kn
; (6)
where Knudsen number is: Kn= 2d
p; (7)
and is the air mean free path, which equals 68 nm in the normal conditions. Other forces, such as Saman's lift force, are negligible due to the relatively large size of the investigated particles.
As the turbulence diusion is one of the most important features of the indoor airow, its accurate estimation is necessary for predicting the particle trajectory. In this study, the Discrete Random Walk (DRW) model [51] is used, which simulates the turbu-lent uctuating velocity components as:
u0 i= G
q u0
where G is a white noise random number and q
u0 i2
is the Root Mean Square (RMS) of the uctuating velocity components. For the k-" turbulence models, the RMS components are the same and equal to 2/3 k. To evaluate the appropriate time to update the random number G, the eddy lifetime and the particle crossing time concepts are used. The characteristic lifetime of the turbulent energy containing eddies is dened as a constant:
e= 2TL; (9)
where TL is the turbulent Lagrangian time scale and
for the k-" turbulence models, it can be estimated as:
TL= 0:15k": (10)
The particle eddy crossing time, that is, the time a particle needs to pass across an eddy, is dened as:
c= In
1 ju uLe
pj
; (11)
where Le is the eddy length scale and for the k-"
turbulence models, it can be approximated by: Le= 0:16k
3=2
" : (12)
The particle is assumed to interact with eddies over the smaller values of e and c [51]; thus, the random
number, G, should be updated at this time. 2.3. Boundary conditions
The boundary condition at the UCV system inlet is constant velocity and constant temperature of 300 K; also, all gradients are assumed to be zero at the outlets. While no slip boundary condition is almost always applied to the momentum equations for the walls, appropriate thermal boundary condition is one of the most important factors regarding heat source surfaces. As the power of heat sources is usually known, constant heat ux is the most common type of boundary condition on the walls. However, there are some issues that bring this choice into question. The total surface area of the modeled source, e.g., a human manikin, is usually considerably dierent from the real one. In addition, the thermal radiation heat transfer mechanism, e.g., in surgical lights, is usually neglected in the indoor airow modeling. Both of the above-mentioned simplications lead to surface temperature in the source and cause the resultant thermal plume power to be far from the actual value. Accordingly, if there are some experimental results regarding the surface temperature of the heat sources, using constant temperature boundary conditions seems to be more realistic. In this investigation, constant temperature
of 300 K [18,25] is used for the human (sta and patient) skin, except at the surgical wound, where the temperature equals 310 K, i.e., the core body temperature [9]. In contrast to human skin, there is not much information about surface temperature of the surgical lights. However, some previous experimental studies [55] have shown that it is almost 350 K; this value is used for the basic simulation and the eect of the surgical luminary thermal boundary condition on the results is discussed separately.
The behavior of the particles on the boundaries is also important for the particle trajectory. As emphasized by Tian et al. [55] through comparison between experimental and LES numerical results, the particles tend to deposit on the oor, but they usually rebound onto a vertical wall or a ceiling. This behavior has a considerable eect on the nal deposition rate of the airborne particles. As a particle reaches the outlets, it is assumed that it exits the computational domain.
2.4. Validation
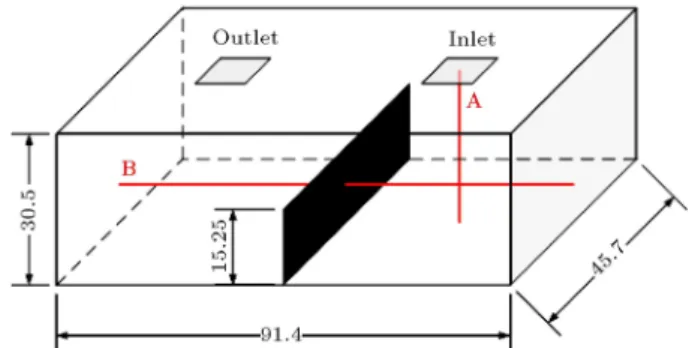
To validate the implemented numerical method, the benchmark of Posner et al. [56], which is widely accepted for the validation of the research work on indoor airow modeling [57], has been used. As shown in Figure 3, the geometry is a room of 91.4 cm length, 45.7 cm width, and 30.5 cm height. A partition with the length of 45.7 cm and height of 15.25 cm divides the room into two equal parts. The air is supplied with the velocity of 0.235 m/s from a 10:1 10:1 cm2
inlet grill at the ceiling of one of the room parts and it exits through a similar outlet grill at the ceiling of the other part. In Figure 4, the numerical results of the y-velocity along line A and the x-y-velocity along line B are compared with the experimental data [56]. According to the results, the present model may predict the indoor airow with reasonably good accuracy.
3. Results and discussion
The most important specication of UCV systems is the ventilation airow inlet velocity. As mentioned
pre-Figure 3. Geometric specications of the validation model [56] (dimensions are in millimeters).
Figure 4. Comparison of the simulation results with the experimental data [56]: (a) y-velocity along line A and (b) x-velocity along line B.
Figure 5. Eect of ventilation airow inlet velocity and particle size on the particles deposition: (a) Deposition percentage and (b) normalized deposition percentage.
viously, there is no unique agreement in the literature on the optimum value and it, more or less, depends on geometry of the room. In 2003, Memarzadeh and Manning [9] found that only particles released close to the wound may lead to its contamination. As a result, although some experimental evidences are needed, it seems that the contaminant source location is not as important as other parameters in an operating room equipped with a UCV system. To study the eect of design parameters on the wound contamination, particles released uniformly from 0.01 m3volume over
the wound and the percentage of particles deposition on the wound are evaluated. The particle specications are assumed to be similar to water, as bio-aerosols are mostly made of water. The primary study shows that 105 particles are necessary to ensure that the
percentage of deposited particles becomes independent of the number of released particles.
Figure 5(a) shows the eect of the inlet air velocity and the size of particles on the percentage of deposited particles. As depicted in the gure,
the particles deposition is almost independent of the particle size in the range of 0.1-1.0 m and increases rapidly over 1.0 m due to gravitational sedimentation. As the Stokes' number of particles is relatively small, the impaction eect has no meaningful contribution to their deposition. In addition, due to relatively large size of particles, Brownian motion is negligible and the main deposition mechanisms are only turbulence diusion and gravitational sedimentation. Sedimentation eects vanish rapidly as the particle size goes below 1.0 m and the deposition curves become almost the same, as the turbulence diusion is independent of the particle size. The main feature of the deposition curves in Figure 5(a) is that all show an optimum value for the inlet velocity to minimize the deposition of particles. As an interesting result, the optimum inlet velocity is independent of the particle size. To better evaluate the optimum value, the particles deposition curves can be normalized based on the minimum deposition percentage, as shown in Figure 5(b). The existence of such an optimum value is due to the formation
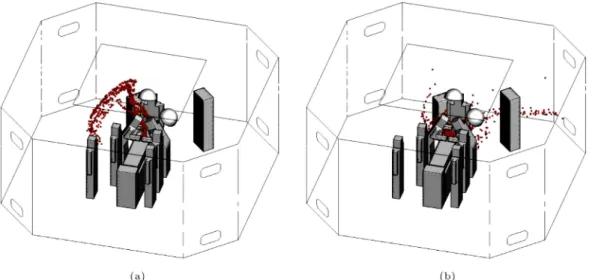
Figure 6. Eect of ventilation inlet air velocity on the dispersion of 10 m particles after 60 seconds: (a) 0.1 m/s and (b) 0.2 m/s.
Figure 7. Eect of inlet air velocity on the z-velocity contours in the operating room: (a) 0.1 m/s and (b) 0.2 m/s.
of a thermal plume over the wound, which acts as a protecting shield at low velocities and may be disturbed when the ventilation airow inlet velocity goes beyond an optimum value. As mentioned previously, turbulent diusion is the main mechanism to deposit the contam-inant particles on the wound. The turbulence diusion depends not only on the particle concentration, but also on the average turbulence intensity over the wound. Consequently, the ventilation airow should be su-ciently high to remove the particles form the wound and reduce the particle concentration on it. At the same time, it should not be too high to destroy the protecting wound thermal plume and increase the turbulence intensity level over the wound. Such behavior of the operating room indoor airow leads to the existence of an optimum value for the ventilation air inlet velocity. The dispersion of 10 m particles after 60 seconds is illustrated at Figure 6(a) and (b) for the inlet air velocities of 0.1 m/s and 0.2 m/s, respectively. In
addition, Figure 7(a) and (b) depict the z-velocity contours for the operating room. As it is clear in the gures, increase in the inlet velocity beyond the optimum value disturbs the wound thermal plume and increases unfavorable particles deposition, accordingly. The thermal plume, which is generated by the temper-ature dierence between the wound tissue and the body skin, forms an upward ow over the wound and protects it from contaminant airborne particles. Beyond the optimum inlet velocity, the shielding thermal wound breaks down and the particles deposition increases, accordingly, as the released particles may be pushed to the wound due to the high level of turbulence intensity. To describe the role of the shielding thermal plume in protecting the wound from contaminants more extensively, an evident case is investigated in which the wound thermal plume has been removed using 300 K as the wound temperature. The particles deposition curves of the evident case are compared
Figure 8. Eect of the wound thermal plume on the particles deposition: (a) Deposition percentage and (b) normalized deposition percentage.
Figure 9. Indoor airow specications in a case without thermal plume at 0.1 m/s inlet air velocity: (a) Dispersion of 10 m particles after 60 seconds and (b) z-velocity contours in the operating room.
with the basic one in Figure 8. Based on the gure, the existence of an optimum value for the inlet air velocity is a direct consequence of the thermal plume formation over the wound. As depicted in Figure 8, without any temperature dierence between the wound tissue and the body skin, there is no optimum value for the inlet air velocity and the ventilation system performance shows a continuous improvement as the inlet air velocity increases. The eect of the wound thermal plume is more sensible at low inlet air velocity when it acts as a shield to protect the wound from contaminant particles. At high inlet air velocity, the thermal plume breaks down and the results are almost the same in both cases. The eect of the wound thermal plume may be found out better via the comparison of Figure 9(a) and (b) with Figures 6 and 7, respectively. As shown in the gures, the thermal plume directs the particles outwards the wound and protects it from deposition of bacteria-carrying akes.
As discussed previously, UCV systems usually
use a downward airow pattern. As a result, the downstream obstacles may inuence the optimum inlet air velocity and the resultant indoor airow distribu-tion. It is well known that operating lights, as the main downstream obstacles in operating rooms, have a considerable negative eect on the ventilation airow pattern due to both hydrodynamic obstruction eect and generation of a thermal plume. Although the hydrodynamic obstruction of a light depends only on its geometry and is almost xed, the power of the generated thermal plume is completely coupled with the light surface thermal boundary condition. It is very common to use a constant heat ux boundary condition for the operating lights based on their power consumption. However, as mentioned previously in the section on boundary conditions, most of the power used by the lights is transmitted via radiation mechanism, which is not normally considered in the indoor air-ow investigations. Such a simplication in the heat transfer mechanisms modeling leads to over-prediction
Figure 10. Eect of the operating luminary boundary condition on the particles deposition: (a) Deposition percentage and (b) normalized deposition percentage.
of the luminary surface temperature and the resultant thermal plume.
Luscuere et al. [58] pointed out that the ow disturbance due to thermal plumes of the lights was not as important as their obstruction eect. However, Tinker and Robert [59], via CFD modeling, found out that the eect of the thermal plumes was thoroughly dispersed only when the inlet air velocity was over 0.3 m/s. This trend was also supported quantitatively by the numerical work of Chow and Yang [18,28]. As the optimum inlet air velocity is considerably lower than 0.3 m/s, the eect of the thermal plumes of the operating lights on the operating room indoor airow pattern and the resultant wound contamination may still be considerable.
In Figure 10, the eect of the luminary boundary condition on the particles deposition is illustrated for two constant temperature boundary conditions, namely 350 K and 400 K, and two constant heat ux boundary conditions, namely 100 W and 200 W. As depicted in the gure, the operating lights boundary condition has a considerable eect on the particles deposition curve, both on the deposition values and on the optimum inlet air velocity. The negative eect of the thermal plumes generated over the luminaries is such strong that it can increase the optimum inlet air velocity up to 0.14 m/s. The eect of the surgical lights thermal plume may better be understood by looking at Figure 11, in which the thermal plume power is illustrated by z-velocity iso-surfaces. As depicted in the gure, the plume causes an upward ow over the light, which may disturb the airow pattern. To achieve the best performance, the inlet airow should have enough momentum to overcome the upward ow of plumes. As a consequence, the case in Figure 11(d), which has the most powerful thermal plume, requires the highest optimum inlet air velocity, namely 0.14 m/s.
Another upstream obstacle, which may be found in an operating room, is the ultra-clean area partitions.
Figure 11. +0:1 m/s z-velocity iso-surfaces at 0.1 m/s inlet air velocity: (a) 350 K, (b) 400 K, (c) 100 W, and (d) 200 W.
The xed and the removable partitions have been proposed by NHS [16] as a solution to improving the UCV system air quality; however, their eectiveness has not been evaluated yet in detail. As shown in Figure 2, the xed and the removable partitions are 1 m in height and mounted on the ceiling, one after another, to protect the ultra-clean surgical area. The xed partitions may be installed in the operating room as built, whereas the removable ones are only applicable after the surgical team settles down in the operating ultra-clean area. The eect of the partitions on the particles deposition percentage is illustrated in Figure 12. As shown in the gure, using the xed partition reduces the number of deposited particles, while it has no eect on the optimum ventilation airow
Figure 12. Eect of using xed and removable partitions on the particles deposition: (a) Deposition percentage and (b) normalized deposition percentage.
Figure 13. Indoor airow specications in a case with the xed partition at 0.1 m/s inlet air velocity: (a) Dispersion of 10 m particles after 60 seconds and (b) z-velocity contours in the operating room.
Figure 14. Indoor airow specications in a case with both partitions at 0.1 m/s inlet air velocity: (a) Dispersion of 10 m particles after 60 seconds and (b) z-velocity contours in the operating room.
rate. In contrary, using the removable one may even lead to increase in the particles deposition rate, which throws its usefulness into question.
The eect of partitions on the airow pattern and the resultant particles deposition may better be
understood by referring to Figures 13 and 14. As depicted in the gures, the main eect of the partitions installation is to direct the ventilation airow toward the surgical table and to prevent its momentum from decay due to expansion. However, this eect is not
strong enough to change the optimum inlet air velocity. In addition, using the removable partition causes the inlet ventilation airow to reach the wound with little changes and to disturb its protecting thermal plume, as shown in Figure 14(a). As a result, airborne particles deposition and wound infection increase in turn by higher turbulence diusion. As illustrated in Figure 13(a), using the xed partition pushes the released particles outward the wound by the thermal plume and the dispersion of particles becomes more regular than the basic case depicted in Figure 6(a). By adding the removable one, an extra momentum imposed by the airow on the thermal plume makes it break down and disperse the released particles, as shown in Figure 14(a).
4. Conclusions
In this research, the eect of UCV system parameters on the ventilation performance and the risk of wound infection was investigated, numerically. The results may be summarized as follows:
1. Due to a relatively small Stokes' number and large size of the studied particles, the contribution of the inertial impaction and Brownian diusion to the particles deposition was almost negligible. Accord-ingly, the main deposition mechanisms were tur-bulence diusion and gravitational sedimentation. However, the eect of the latter rapidly vanished as the particle size went below 1.0 m. It can be concluded that if the deposition percentage of dierent particle sizes becomes normalized based on the minimum value, all deposition curves will be almost the same;
2. The formation of a thermal plume over the wound, due to temperature dierence between the wound tissue and the body skin, led to an optimum value for the inlet air velocity, which minimized the par-ticles deposition. Over the optimum inlet velocity, the protecting thermal plume was destroyed and the particles deposition increased because of the high level of turbulence intensity near the wound;
3. The boundary condition of the operating luminaries had a considerable eect on the optimum inlet air velocity. Although the constant heat ux is the most common type of boundary condition for the indoor heat sources, it may lead to an over-estimated surface temperature and thermal plume power by simplifying the geometries and/or neglect-ing the radiation heat transfer mechanism. Ac-cording to the results of this study, using dierent boundary conditions for the operating lights may change the optimum inlet velocity in a relatively vast range from 0.1 to 0.14 m/s;
4. Although using xed partitions in a UCV system decreases the particles deposition on the wound and the resultant infection risk, it has no meaningful eect on the optimum inlet air velocity. In addition, the installation of removable partitions showed a negative eect on the ultra-clean air quality by increase in the turbulence intensity level near the wound. As a result, it seems that the removable partitions should be used cautiously; however, more experimental and numerical research is needed in this area.
Acknowledgement
The nancial support of this research, provided by Iran National Foundation Society (INFS), is greatly appreciated.
References
1. Malone, D.L., Genuit, T., Tracy, J.K., Gannon, C., and Napolitano, L.M. \Surgical site infections: reanal-ysis of risk factors", Journal of Surgical Research, 103, pp. 89-95 (2002).
2. Kirkland, K., Briggs, J.P., Trivette, S.L., Wilkinson, W.E., and Sexton, D.J. \The impact of surgical-site infections in the 1990s: attributable mortality, excess length of hospitalization, and extra costs", Infection Control and Hospital Epidemiology, 20, pp. 725-730 (1999).
3. Mangram, A.J., Horan, T.C., Pearson, M.L., Silver, L.C., and Jarvis, W.R. \Guideline for prevention of surgical site infection", Infection Control and Hospital Epidemiology, 20, pp. 247-278 (1999).
4. Stevenson, T.C. \Experimental investigation of hos-pital operating room air distribution", M.Sc. Thesis, Georgia Institute of Technology, Atlanta, GA (2008). 5. Woods, J.E., Brayman, D., Rasmussen, R.W., and
Montag, G.M. \Ventilation requirements in hospital operating rooms - Part I: Control of airborne parti-cles", ASHRAE Transactions, 92, pp. 396-426 (1996). 6. Goldman, M. \Operating room airow and distribu-tion", ASHRAE Winter Meeting, Dallas, TX (2000). 7. Noble, W.C. \Dispersal of bacteria from human skin",
International Symposium on Contamination Control, Copenhagen, Denmark (1976).
8. Zamuner, N., ASHRAE Technical Data Bulletin: Hos-pital and Operating Room Ventilation, ASHRAE, At-lanta, GA (1986).
9. Memarzadeh, F. and Manning, A. \Reducing risks of surgery", ASHRAE Journal, 45, pp. 28-33 (2003). 10. Lewis, J.R. \Operating room air distribution
eec-tiveness", ASHRAE Transactions, 99, pp. 1191-1199 (1993).
11. Turner, R.S. \Laminar air ow", Journal of Bone and Joint Surgery, 56, pp. 430-435 (1974).
15. Whyte, W., Cleanroom Technology, John Wiley & Sons, Chichester, UK (2001).
16. Health Technical Memorandum (2025): Ventilation in Healthcare Premises, National Health Service (NHS) Estates, London, UK (1994).
17. Humphreys, H., Stacey, A.R., and Taylor, E.W. \Survey of operating theatres in Great Britain and Ireland", Journal of Hospital Infection, 30, pp. 245-252 (1995).
18. Chow, T.T. and Yang, X.Y. \Performance of ven-tilation system in a non-standard operating room", Building and Environment, 38, pp. 1401-1411 (2003). 19. Liu, J., Wang, H., and Wen, W. \Numerical simulation
on a horizontal airow for airborne particles control in hospital operating room", Building and Environment, 44, pp. 2284-2289 (2009).
20. Woloszyn, M., Virgone, J., and Stephane, M. \Di-agonal air distribution system for operating rooms experiment and modeling", Building and Environment, 39, pp. 1171-1178 (2004).
21. Sadrizadeh, S. and Holmberg, S. \Eect of a portable ultra-clean exponential airow unit on the particle distribution in an operating room", Particuology, 18, pp. 170-178 (2015).
22. Loomans, M.G.L.C., de Visser, I.M., Loogman, J.G.H., and Kort, H.S.M. \Alternative ventilation system for operating theaters: Parameter study and full-scale assessment of the performance of a local ventilation system", Building and Environment, 102, pp. 26-38 (2016).
23. Sadrizadeh, S., Holmberg, S., and Tammelin, A. \A numerical investigation of vertical and horizontal lam-inar airow ventilation in an operating room", Building and Environment, 82, pp. 517-525 (2014).
24. Chen, Q. and Jiang, Q.Z. \Signicant questions in predicting room air motion", ASHRAE Transactions, 98, pp. 929-939 (1992).
25. Chen, Q., Zhai, J., and Moser, A. \Control of airborne particle concentration and draught risk in an operating room", Indoor Air, 2, pp. 154-167 (1992).
26. Murakami, S., Kato, S., and Suyama, Y. \Numerical and experimental study on turbulence diusion elds
90 (2002).
30. Salvati, E.A. \Infection rates after 3,175 total hip and total knee replacements performed with and without a horizontal unidirectional ltered airow system", Journal of Bone and Joint Surgery, 64, pp. 525-535 (1982).
31. Hinds, W.C., Aerosol Technology, John Wiley & Sons, Chichester, UK (1999).
32. Memarzadeh, F. and Manning, A. \Comparison of operating room ventilation systems in the protection of the surgical site", ASHRAE Transactions, 108, pp. 3-5 (2002).
33. Rui, Z., Guangnei, T., and Jihong, L. \Study on biological contaminant control strategies under dier-ent vdier-entilation models in hospital operating room", Building and Environment, 43, pp. 793-803 (2008). 34. HVAC Design Manual for Hospitals and Clinics,
ASHRAE, Atlanta, GA (2003).
35. \Guidelines for design and construction of hospitals and health care facilities", AIA, Washington, DC (2006).
36. Sadrizadeh, S., Pantelic, J., Sherman, M., Clark, J., and Abouali, O. \Airborne particle dispersion to an operating room environment during slid-ing and hslid-inged door openslid-ing", Journal of Infec-tion and Public Health, 11(5), pp. 631-635 (2018). https://doi.org/10.1016/j.jiph.2018.02.007
37. Sadrizadeh, S., Tammelin, A., Ekolind, P., and Holm-berg, S. \Inuence of sta number and internal constel-lation on surgical site infection in an operating room", Particuology, 13, pp. 42-51 (2014).
38. Sadrizadeh, S. and Holmberg, S. \Surgical clothing systems in laminar airow operating room: a nu-merical assessment", Journal of Infection and Public Health, 7, pp. 508-516 (2014).
39. Sadrizadeh, S., Afshari. A., Karimipanah, T., Hakans-son, U., and Nielsen, P.V. \Numerical simulation of the impact of surgeon posture on airborne particle distribution in a turbulent mixing operating theatre", Building and Environment, 110, pp. 140-147 (2016). 40. Chow, T.T. and Wang, J. \Dynamic simulation on
impact of surgeon bending movement on bacteria-carrying particles distribution in operating theatre", Building and Environment, 57, pp. 68-80 (2012).
41. Zoon, W.A.C. \On the applicability of the laminar ow index when selecting surgical lighting", Building and Environment, 45, pp. 1976-1983 (2010).
42. MPROG 287: Healthcare Facilities - Guidelines for Mechanical Installations, MPROG, Tehran, Iran (2006).
43. DIN 4799: Heating, Ventilation and Air Conditioning-Testing of Air Distribution Systems Serving Operating Theatres, DIN, Berlin, Germany (1990).
44. Chen, C.J. and Jaw, S.Y., Fundamentals of Turbulence Modeling, Taylor & Francis, Washington, DC (1998). 45. Chen, Q. \Comparison of dierent k-" models for in-door airow computations", Numerical Heat Transfer: Part B, 28, pp. 353-369 (1995).
46. Tian, Z.F., Tu, J.Y., Yeoh, G.H, and Yuen, R.K.K. \On the numerical study of contaminant particle con-centration in indoor airow", Building and Environ-ment, 41, pp. 1504-1514 (2006).
47. Mendez, C., San Jose, J.F., Villafruela, J.M., and Castro, F. \Optimization of a hospital room by means of CFD for more ecient ventilation", Energy and Buildings, 40, pp. 849-854 (2008).
48. Chen, Q. \Prediction of room air motion by Reynolds-stress models", Building and Environment, 31, pp. 233-244 (1996).
49. Costa, J.J., Oliveira, L.A., and Blay, D. \Test of several versions for the k-" type turbulence model-ing of internal mixed convection ows", International Journal of Heat and Mass Transfer, 42, pp. 4391-4409 (1999).
50. Stamou, A. and Katsiris, I. \Verication of a CFD model for indoor airow and heat transfer", Building and Environment, 41, pp. 1171-1181 (2006).
51. ANSYS FLUENT 12.1 User's Guide, ANSYS Inc., Canonsburg, PA (2009).
52. Versteeg, H.K. and Malalasekera, W. An Introduction to Computational Fluid Dynamics: The Finite Volume Method, Addison-Wesley, Boston, MA (1996). 53. Davidson, L. and Fontaine, J.R. \Calculation of the
ow in a ventilated room using dierent nite dier-ence schemes and dierent treatments of the walls", CLIMA 2000, Yugoslavia, Sarajevo (1989).
54. Sajadi, B., Saidi, M.H., Ahmadi, G., Kenney, S.M., and Taylor, J. \On the induced airow and particle resuspension due to a falling disk", Particulate Science and Technology, 31, pp. 190-198 (2013).
55. Tian, Z.F., Tu, J.Y., Yeoh, G.H, and Yuen, R.K.K. \Numerical studies of indoor airow and particle
dispersion by large eddy simulation", Building and Environment, 42, pp. 3483-3492 (2007).
56. Posner, J.D., Buchanan, C.R., and Dunn-Rankin, D. \Measurement and prediction of indoor air ow in a model room", Energy and Buildings, 35, pp. 515-526 (2003).
57. Sajjadi, H., Salmanzadeh, M., Ahmadi, G., and Ja-fari, S. \Simulations of indoor airow and particle dispersion and deposition by the lattice Boltzmann method using LES and RANS approaches", Building and Environment, 102, pp. 1-12 (2016).
58. Luscuere, P.G., Lemaire, T.D., and Ham, P.J. \Im-provement capabilities of operating theatres with the help of computer ow modeling", Proceedings of Indoor Air, Helsinki, Finland (1993).
59. Tinker, J.A. and Roberts, D. \Indoor air quality and infection problems in operating theatres", Proceedings of the 2nd European Conference on Energy Perfor-mance and Indoor Climate in Buildings (EPIC), Lyon, France (1998).
Biographies
Behrang Sajadi is an Assistant Professor in the School of Mechanical Engineering at University of Tehran, Iran. His current research interests include aerosol mechanics, indoor air quality, energy modelling, heat transfer enhancement in refrigeration systems, and novel HVAC and refrigeration systems.
Mohammad Hassan Saidi is a Professor in the School of Mechanical Engineering at Sharif University of Technology, Iran. His current research interests include MEMS, heat transfer enhancement in boiling and condensation, modeling of pulse tube refrigeration, vortex tube refrigerators, indoor air quality and clean room technology, energy eciency in home appliances, and desiccant cooling systems.
Goodarz Ahmadi is a Professor of Mechanical and Aeronautical Engineering at Clarkson University, NY. He has been awarded the title of \Clarkson Distin-guished Professor." Some of his research interests include multiphase and granular ows, three-phase slurry ows, aerosols, micro-contamination control, turbulence modeling, stability of uid motions, con-tinuum mechanics, nonlinear random vibrations, and earthquake engineering.
![Figure 1. Interaction of the factors participating in the risk of SSI [10].](https://thumb-us.123doks.com/thumbv2/123dok_us/8367728.2222371/2.892.206.707.820.1112/figure-interaction-factors-participating-risk-ssi.webp)
![Figure 4. Comparison of the simulation results with the experimental data [56]: (a) y-velocity along line A and (b) x-velocity along line B.](https://thumb-us.123doks.com/thumbv2/123dok_us/8367728.2222371/6.892.160.762.146.410/figure-comparison-simulation-results-experimental-data-velocity-velocity.webp)